
Abstract
Objective:
To describe the epidemiology of thyroid eye disease (TED).
Methods:
A population-based cohort of all Olmsted County, Minnesota, residents who had newly diagnosed TED between January 1, 2005, and December 31, 2020, was identified through the medical diagnostic index of the Rochester Epidemiology Project. Individuals aged 18 years and older were included. Incidence rates and point prevalence were calculated. Baseline disease characteristics and progression of disease were described.
Results:
We identified 83 incident patients, of whom 75 (90.4%) were female. The overall age and sex adjusted incidence for the U.S. population were 5 cases/100,000 person-years. Females had higher incidence (8.9 cases/100,000 person-years) compared with men (1 case/100,000 person-years). The distribution of peak incidence rates by 5-year age groups differed between male and female, in which females had peak incidence rates in the age groups 60–64 years and 80–84 years (18.3 cases and 18 cases/100,000 person-years, respectively), while male had peak incidence rate in the age group 70–74 years (5.7 cases/100,000 person-years). No clear trend was identified for the yearly incidence between 2005 and 2020. The overall estimated point prevalence per 100,000 was 65 (CI, 53.3–78.7). Prevalence was 114.5 (CI, 92.6–139.9) for females and 13.8 (CI, 6.8–24.6) for males (p < 0.001). Factors associated with disease progression were severity of soft tissue involvement (hazard ratio [HR] 7.7; CI, 2–29.8) and presence of diplopia (HR 2.5, CI, 1.2–5.1).
Conclusions:
Incidence rates for TED remained stable over the past two decades, yet lower than that in the previous study from our population. Females continue to have the peak incidence rate a decade earlier than males, and the majority of disease burden is present after the age of 50 years. Appropriate resources should be devoted to furthering education, management, and research into this condition.
Introduction
Thyroid eye disease (TED), also known as thyroid-associated orbitopathy or Graves’ ophthalmopathy, is a debilitating inflammatory eye condition that typically coexists with autoimmune thyroid disorders, such as Graves’ disease. About 25–50% of patients with Graves’ disease present with clinical signs of TED. 1 Rarely, it occurs in patients who are euthyroid or have autoimmune hypothyroidism. 2 Upper eyelid retraction, proptosis, erythema, and edema of the periorbital tissues and conjunctivae are the most common features of TED. 3 It affects the muscles, fatty tissues, and soft tissues of the eye that can potentially lead to significant visual impairments such as diplopia, ocular hypertension, and optic nerve damage if severe. 4 TED is more common in women, but it tends to be more severe in men. 5 Other risk factors for disease development or worsening include smoking (both current and previous smoking status), older age, and radioactive iodine (RAI) treatment. 6
Clinical assessment of TED is based on the severity grading criteria and disease activity. The grading criteria is classified as mild, moderate to severe, and sight-threatening disease, each characterized by the degree of proptosis, diplopia, lid retraction, and soft-tissue changes. 7 Mild TED has little to no impact on activities of daily living as opposed to moderate-to-severe TED. Sight-threatening TED requires urgent therapy to prevent blindness. 8 Typically, the disease starts with an active phase that involves acute inflammation followed by a chronic or stable phase, as the inflammation subsides, and fibrosis evolves. 9 Several classification systems are used to assess the severity and clinical activity of TED. The clinical activity score (CAS) was proposed in 1989, 10 and it remains widely used, including in clinical trials. 11 –14
There are limited data reported on the prevalence and incidence of TED in the United States. A meta-analysis in 2020 by Chin et al. showed that the overall pooled prevalence in patients with Graves’ disease was 40%, which varied among continents with 38% in Europe, 44% in Asia, 27% in North America, and 58% in Oceania. 4 Several recent studies have come from European and Asian countries, with great variability in their inclusion criteria, mostly utilizing registry-based or insurance claim databases. 15 –17 Meanwhile, the last U.S.-based population cohort study investigating the incidence and prevalence of TED was conducted in our county, but more than two decades ago. 18 This study aims to report the updated incidence and prevalence of TED in Olmsted County, MN, USA.
Methods
We used the Rochester Epidemiology Project (REP) (https://rochesterproject.org) to identify patients from Olmsted County, Minnesota who had TED between January 1, 2005, and December 31, 2020. This was a retrospective, population-based cohort study. The electronic medical records of the participants were reviewed. We used clinical diagnosis made by clinicians as documented on clinical notes and confirmed with the presence of 1) autoimmune thyroid dysfunction or presence of thyroid antibodies (thyroid-stimulating immunoglobulin or thyroid-stimulating hormone receptor antibody) accompanied by 2) specific eye symptoms and signs, including periorbital and retroorbital pain or pressure, lid retraction, proptosis, diplopia, lagophthalmos, soft tissue involvement, or inflammatory features. Demographics, clinical history, and disease characteristics such as CAS and disease severity based on the EUGOGO classification were collected at baseline and at all follow-up visits, as available. Disease progression was defined as 1) worsening TED from one category of severity to the other or 2) worsening within the same category as assessed through worsening parameters, such as increased proptosis, worsening diplopia, lagophthalmos, or lid retraction during follow-up visit. Disease flare was defined as recurrence or progression of eye symptoms or signs of TED after previously documented improvement.
Overall and sex-specific TED incidence rates in Olmsted County were calculated per 100,000 persons per year for each age and sex group, by using the number of incident cases as the numerator and population counts from the REP census as the denominator. 19,20 Overall incidence rates were age- and/or sex adjusted to the U.S. total population in 2020. 19 Incident cases were included if those persons were residents of Olmsted County, Minnesota on the index date of diagnosis of TED. To compute CIs for incidence rates, it was assumed that the number of cases followed a Poisson distribution. 21 The point prevalence of TED per 100,000 was determined using the number of prevalent cases in year 2020 as the numerator and the Olmsted County population of 2020 as the denominator. The population of Olmsted County, used for computation of point prevalence, is taken from the Census Bureau (https://data.census.gov/profile/Olmsted_County,_Mi...?g=050XX00US27109#populations-and-peoplethere). The sex proportion of Olmsted County is 50.94% and 49.06% for females and males, respectively, for the year of 2020.
Continuous variables are presented as means ± standard deviation or median (interquartile range [IQR]) based on the normalcy of the distribution. Categorical variables are expressed as numbers and percentages. Factors associated with disease progression were assessed using the Cox proportional hazard model where progression was treated as a time-dependent covariate. Similarly, association of flare with risk factors was analyzed using univariable logistic regression. SAS © (version 9.4) and R (version 9.4) were used for all statistical analysis. All the tests were two-sided, and p value of <0.05 was considered significant.
The study’s protocol was reviewed by the Institutional Review Board at Mayo Clinic (21-007128). Requirement for informed consent was waived. In accordance with the state regulation, only patients who signed Minnesota research authorization were included (none declined the authorization). This study followed the principles of the Declaration of Helsinki and was conducted in accordance with the Health Insurance Portability and Accountability.
Results
Incidence
A total of 83 incident cases were identified between January 1, 2005, and December 31, 2020, of whom majority (n = 75; 90%) were females (Table 1). Of these, 46 patients had follow-up visits. The overall incidence rate was 4.9 cases per 100,000 person years in Olmsted County, MN (Table 2), corresponding to age- and sex-adjusted incidence rate of 5 per 100,000 person years for the U.S. population (Table 3). Incidence rate was higher in females with 8.6 cases per 100,000 person years compared with that in males at 1 case per 100,000 person years. The distribution of peak incidence rates by 5-year age group differed between males and females, in which females had their peak incidence a decade earlier than males (Fig. 1). The peak incidence in females occurred at the ages of 60–64 years (18.3 per 100,000 person years) and 80–84 years (18 per 100,000 person years). Meanwhile, the peak incidence in males was at the age of 70–74 years (5.7 per 100,000 person years).
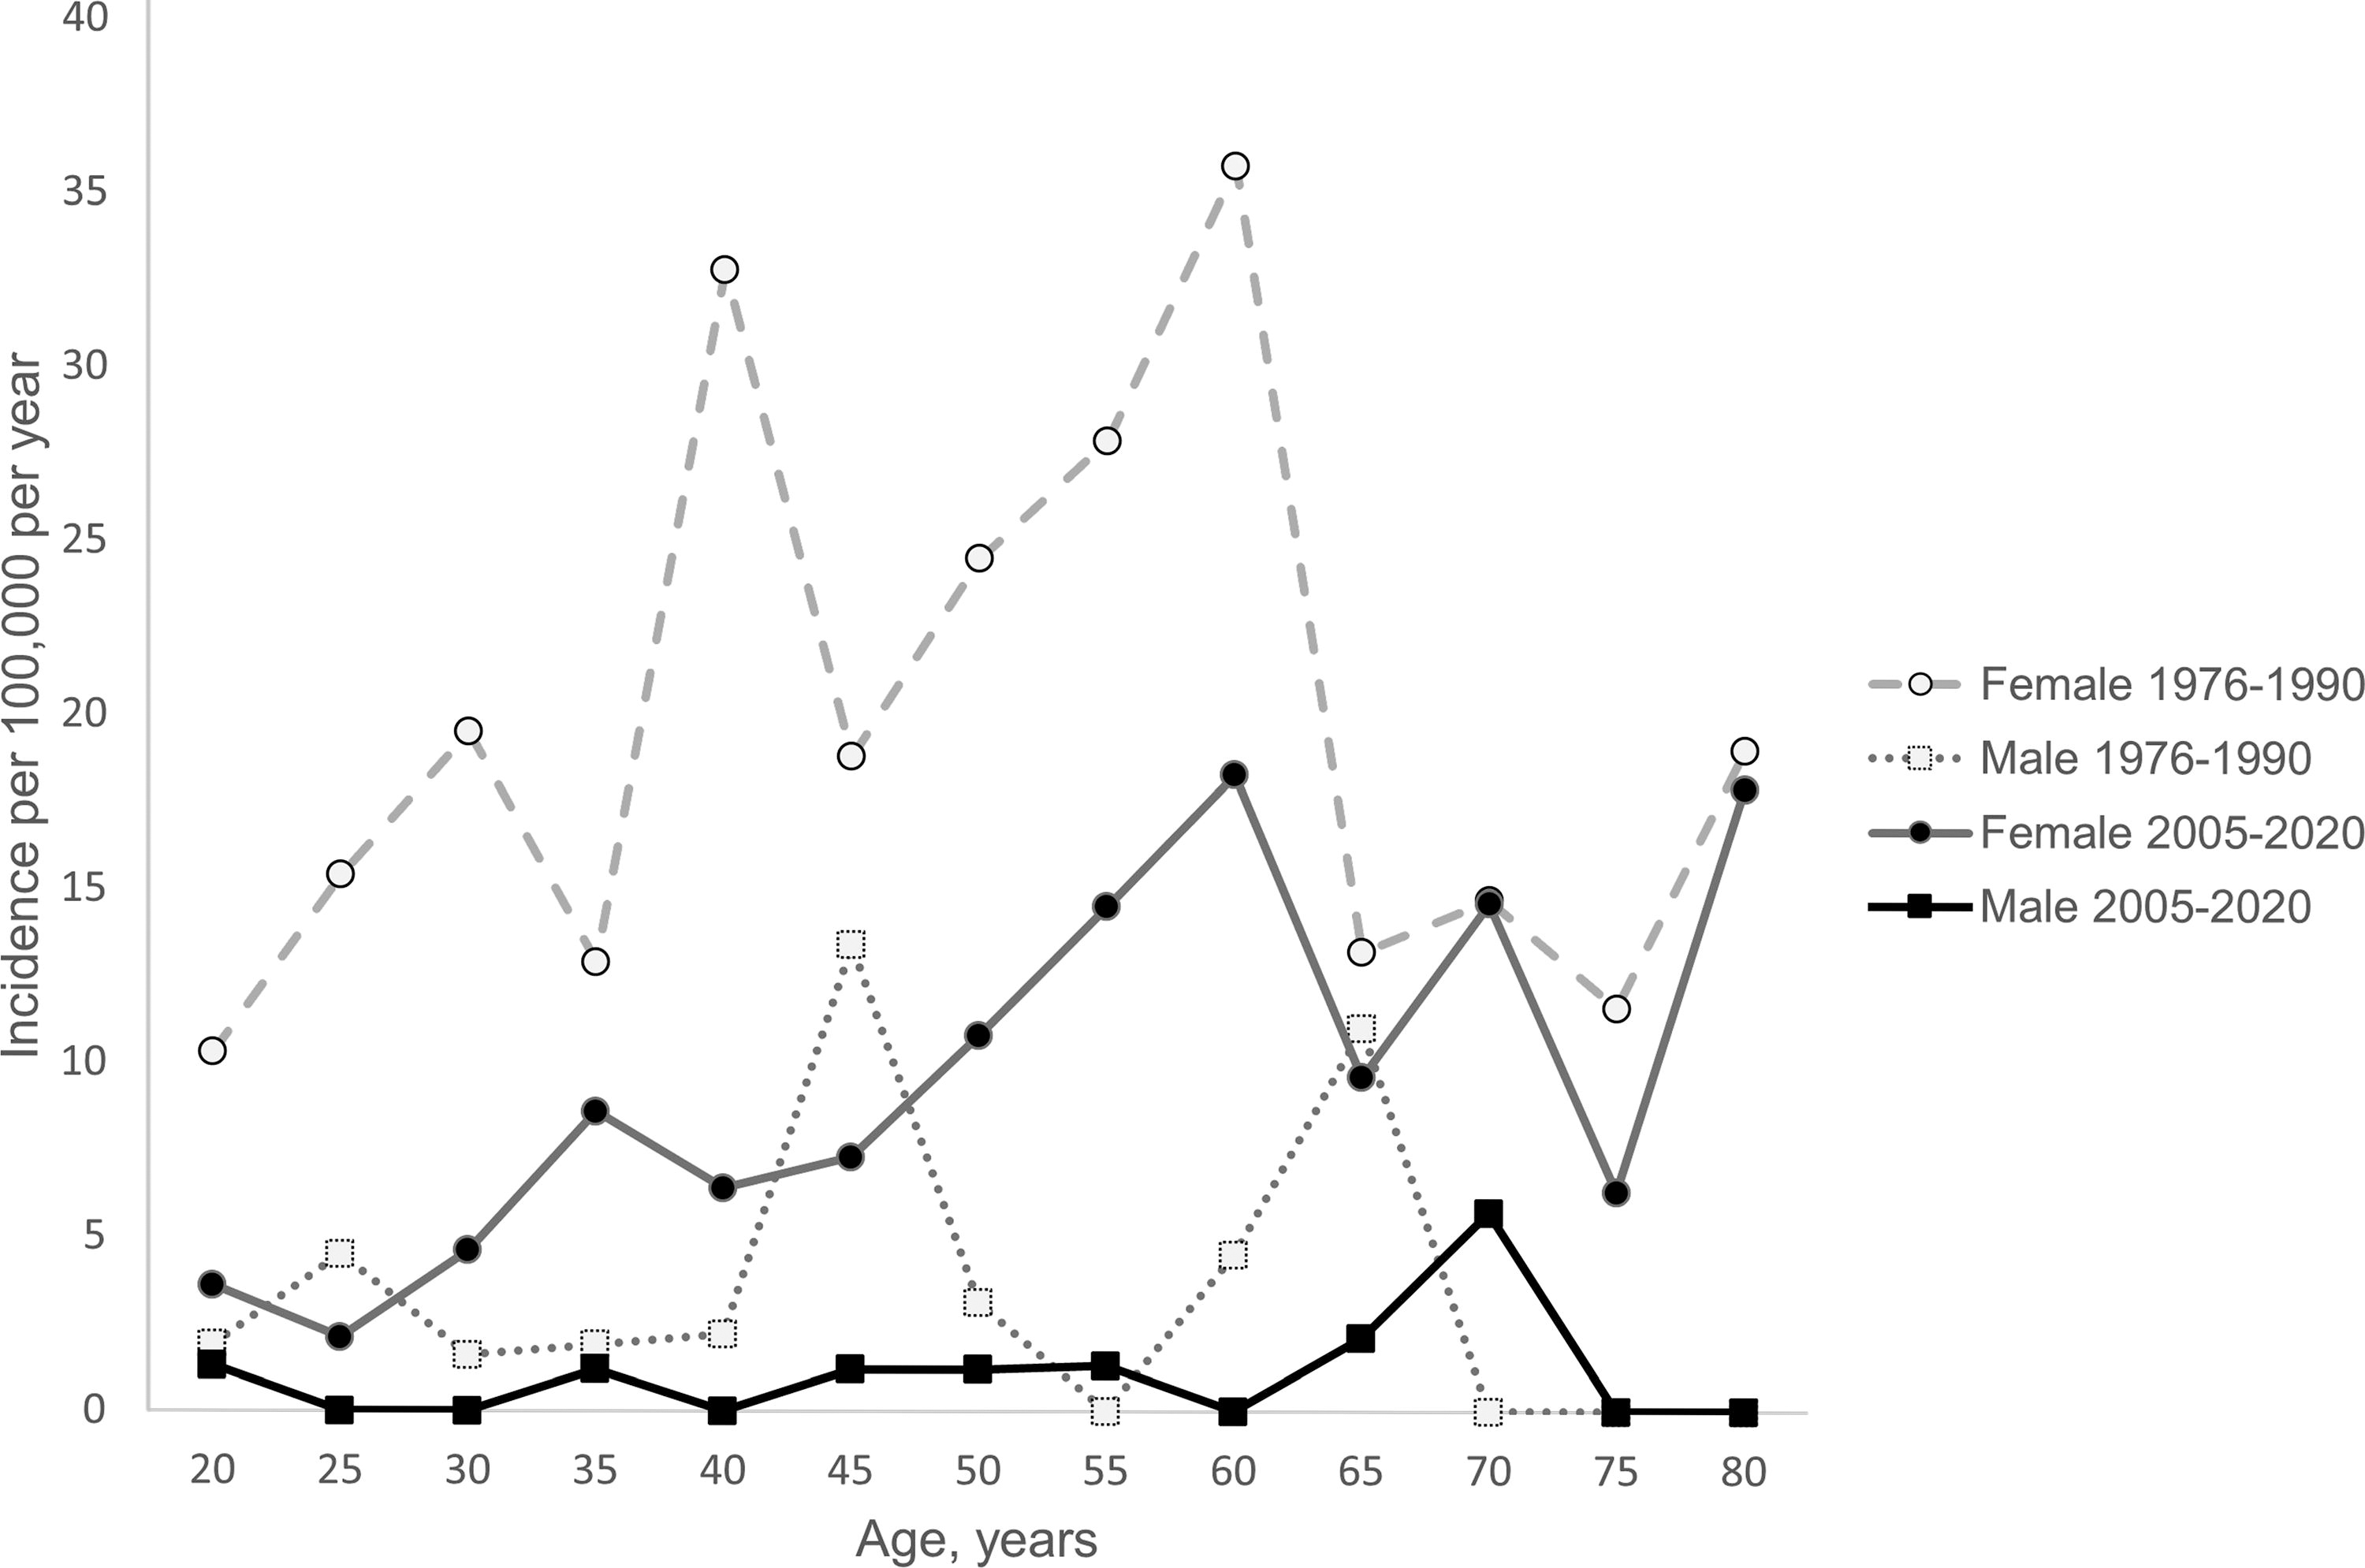
TED incidence by age and sex in Olmsted County from 2005 to 2020 superimposed on data from 1976 to 1990 (Bartley et al., 1995). TED, thyroid eye disease.
Demographic and Baseline Characteristics of TED Incident Cases between 2005 and 2020
RAI, radioactive iodine; SD, standard deviation; TED, thyroid eye disease.
aDifference in numbers reflects missing data.
TED Incidence by Age and Sex in Olmsted County from 2005 to 2020
Adjusted TED Incidence Rates in the United States
Prevalence
By the end of 2020, a total of 115 patients with TED in Olmsted County, MN were identified to calculate TED prevalence. The overall estimated point prevalence was 65 per 100,000 persons. The prevalence was higher in female (114.6 per 100,000 persons) than in male (13.8 per 100,000 persons) (p < 0.001) (Table 4).
TED Prevalence in Olmsted County by the End of 2020
Demographic and baseline characteristics
Of the 83 incident cases, majority (n = 66, 78%) were White, followed by Asian/Pacific Islander, and African American (Table 1). The majority had hyperthyroidism (n = 72, 87%), and of these, many (n = 48, 66%) were treated with RAI (Fig. 2). Furthermore, many patients developed TED within 6 months of the hyperthyroidism diagnosis (median 5 months, IQR 0–29), and only a few (n = 2) had the TED diagnosis preceding that of hyperthyroidism (Fig. 3). Fourteen patients (16.9%) were active smokers at the time of TED diagnosis. The majority of patients had inactive disease defined as CAS <3 (79.5%). The mean CAS was 1.27 (SD 1.5). Disease severity at diagnosis was mostly mild (n = 50, 60%), followed by moderate-to-severe disease (n = 32, 38.6%), and only one patient had sight-threatening disease. The mean excess proptosis was 2.8 mm (SD 2.5). Diplopia was present in 53.4%, while lagophthalmos and lid retraction were reported in 38.5% and 60.2%, respectively.

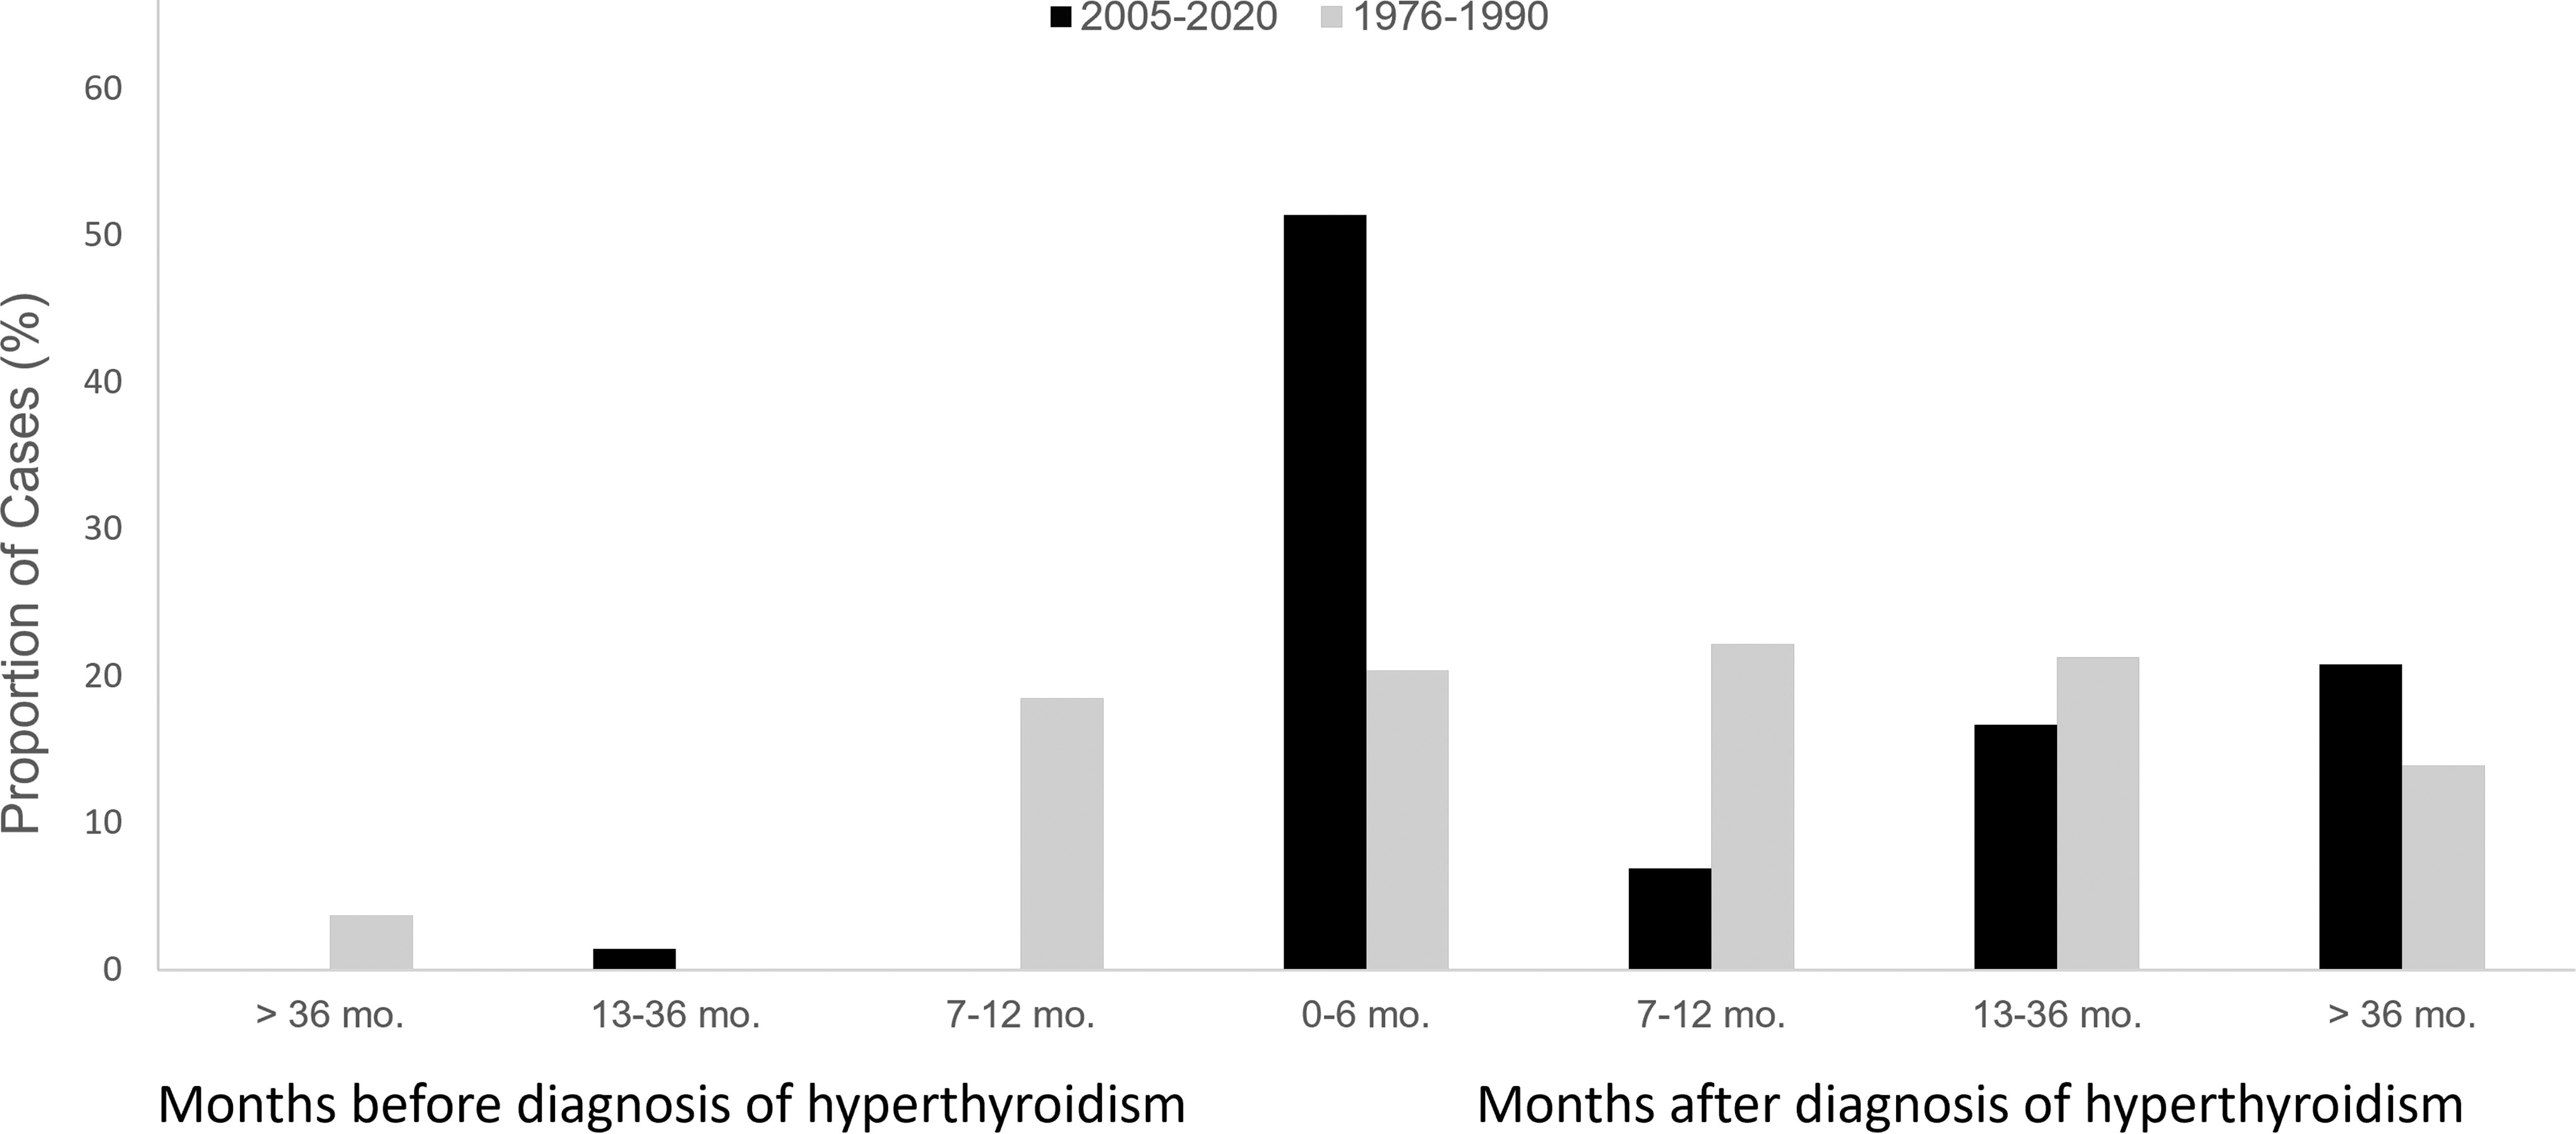
Temporal relationship between diagnosis of TED and diagnosis of hyperthyroidism superimposed on data from 1976 to 1990. 37
Disease course
Over the course of follow-up, we had 45.8% (n = 38) of patients who experienced progression and 38.5% (n = 32) that experienced improvement. Progression was mostly within the same disease severity category (79.5%), while the other 20.5% cases that progressed moved to a higher severity TED category. There were 15 patients who had a flare after documented improvement during follow-up. Of those, 43.3% patients had a flare leading to a change from a milder to a more severe disease category, whereas the remaining 56.7% of patients had a flare within the same disease severity category.
Disease progression was related to worsening proptosis, diplopia, CAS, or visual acuity. Analyses of factors contributing to disease progression (Table 5) showed soft tissue involvement severity (HR 7.7; confidence interval [CI], 2–29.8) and presence of diplopia (hazard ratio [HR] 2.5; CI, 1.2–5.1) were associated with disease progression, while there was a trend toward association between CAS of 2 or higher and disease progression (HR 2.2, CI, 0.95–4.89). In contrast, there was no specific risk factor that was associated with disease flare (Table 6), although there was a trend toward association between presence of diplopia and flare (OR 3.7, CI, 0.9–15.8). Of the 46 patients with follow-up, 9 patients received corticosteroid therapy (IV or oral), 6 received selenium, 13 patients had strabismus surgery, 7 underwent orbital decompressions, 7 had eyelid surgery, and 2 had orbital radiation (Table 7).
Univariate Analysis of Risk Factors for Disease Progression (Cox Proportional Hazard Model)
RAI, radioactive iodine; CAS, clinical activity score; CI, confidence interval.
Univariate Analysis of Risk Factors for Flare (Logistic Model)
CAS, clinical activity score; CI, confidence interval.
TED Treatments Among Incident Cases with Follow-up (n = 46)
Patients may have received more than one treatments.
Discussion
This epidemiological study describes the incidence and prevalence of TED between January 1, 2005, and December 31, 2020, in Olmsted County, Minnesota. We found that the overall incidence was 4.9 cases per 100,000 person years in Olmsted County, MN corresponding to an age and sex adjusted incidence of 5 per 100,000 person years for the U.S. population and the prevalence was 65 per 100,000 persons. The incidence was higher in females with incidence rate of 8.9 cases per 100,000 person years compared with males with incidence rate of 1 case per 100,000 person years. Similarly, females had higher TED prevalence than males. Our study provides updates on the incidence and prevalence of TED over the past two decades.
We noted a decrease in the incidence and prevalence of TED during the study period compared with those between 1976 and 1990 of the same study population in Olmsted County, Minnesota (Fig. 1). Similar to our study, the previous study used the Rochester Epidemiology Project to identify patients with TED in Olmsted County, MN during the study period and reviewed the medical records of each patient. The inclusion criteria in the previous study were also similar. Nevertheless, in the earlier study, the incidence rates were more than twice our incidence rates for females and males, respectively. 18 Although our incidence rates were lower than previously reported in the same population cohort, our overall and sex-specific incidence rates are similar to the more recent studies in Danish and Swedish populations. 15,16 The study from Sweden used a multicenter study registry where patients with hyperthyroidism were prospectively registered. Occurrence of eye symptoms related to hyperthyroidism was recorded based on clinicians’ evaluation. 15 Meanwhile, the Danish study used a nationwide retrospective registry and used International Classification of Disease (ICD) codes and prescriptions for thyroid medications to identify patients with TED. 16 Notably, it is a challenge to identify patients with TED using ICD codes alone due to lack of specificity of the current ICD code for TED as the same code is also used for Graves’ disease. A dedicated TED ICD code would be a major benefit for this field, allowing for a more accurate identification and overall description of this population. As a result, adequate planning can be instituted for improving TED prevention, diagnosis, and treatment.
Among patients with Graves’ disease, it is estimated that 25–40% of patients have TED. 4,22,23 A study done in the United Kingdom, using a retrospective cohort database and review of patients’ electronic medical records, suggested that the incidence of adult-onset Graves’ disease was 24.8 per 100,000 person years. 24 Although the study was done in a different population, it is the best we have for this particular comparison, and based on this data, our finding would approximate 20–30% rate of TED among patients with Graves’ disease, overall consistent with earlier study. 15 In addition, similar to earlier studies, the majority of TED cases in our cohort were mild in severity, 17,23 which may have contributed to the lack of follow-up in half of the patients in our cohort. Moreover, due to the subtlety of the mild form of TED and potential underdiagnosis, that number may be an underestimate. This is also the likely explanation why moderate-to-severe disease accounts for almost 40% of all cases in our cohort, likely an overestimation compared with earlier studies’ findings of 5–6%. 22,25 Disease severity classification was not used in the earlier study in Olmsted County. However, based on the available data (diplopia severity could be assessed from the details in the article), we estimated the proportion of patients with moderate-to-severe TED in the previous study was about 13% and at least one patient (0.8%) had sight-threatening disease with optic neuropathy. 26 Unfortunately, the severity assessment based on excess proptosis, lid retraction, and severity of soft tissue features could not be performed with available data, and therefore, a reliable comparison between the two cohorts on this issue cannot be made. Sight-threatening disease in our cohort was rare, consistent with earlier studies. 22,27
We speculate that the differences in TED incidence and prevalence over time in Olmsted County may be related to a number of factors. First, the decline in RAI use and the rise of antithyroid drugs for long-term treatment of Graves’ disease in the United States 28 have likely diminished one of the most potent factors associated with development or worsening of TED. 29 The use of RAI dropped from 89% in the previous study in Olmsted County to just 66% in our cohort. 26 Furthermore, even if patients with Graves’ disease are treated with RAI, the management of subsequent hypothyroidism is much timelier with increased attention to avoiding biochemical hypothyroidism and initiating levothyroxine therapy earlier. Second, smoking, which has also been associated with increased risk of TED development and progression, 23,30,31 has decreased in prevalence in the United States, compared with a decade ago. 32 Smoking was present in a larger percentage of this TED cohort than in the general Olmsted County population from which the cohort derives (16.9% vs. 8–9% throughout 2013–2019). 33 –35 However, our study revealed only 16.9% of incident cases were active smokers at the time of TED diagnosis, compared with 34.2% in the previous study. 26 Optimization in thyroid laboratory testing and increased awareness of both Hashimoto’s thyroiditis and Graves’ disease have likely led to an increase in earlier detection of both pathologies. Addressing abnormal thyroid tests at an earlier stage has also likely diminished the likelihood of complications associated with thyroid autoimmunity. 36 This may have also contributed to the decrease in the overall TED incidence in recent years. It is also interesting to note that the majority of TED diagnosis in our cohort was made within 6 months of diagnosis of hyperthyroidism, while the previous cohort were mostly diagnosed with TED within 7–12 months of hyperthyroidism diagnosis. 37 This may suggest an improved sensitivity of the clinicians for the identification of TED, once the thyroid autoimmunity has been diagnosed.
Females were at least four times more likely than males to develop TED, similar to earlier studies. Using the same population-based cohort in Olmsted County, MN between 1976 and 1990, Bartley et al. reported the age-adjusted TED incidence rate was 16 cases per 100,000 person years for women and 2.9 cases per 100,000 person years for men. 18 Similar patterns were observed in other studies in different populations in which females dominated the incidence of TED. 16,25 In 2018, using a large U.S. database of ambulatory surgery, a study revealed TED requiring eye surgery had a national prevalence of 0.6/100,000 population with women comprising 73% of the total number. 38 This female-dominated pattern in TED is also consistent with the pattern seen in Graves’ disease. 15,39,40 Peak incidence of TED in our cohort occurred at the age of 60s in females and 70s in males. Difference in peak incidence between males and females was also observed in the earlier study at our institution, in which females developed TED earlier than males. 18 However, cumulatively, overall TED incidence mostly occurred in the age groups 40–65, similar to previous studies, 17,23,25 coinciding with the peak incidence of Graves’. 15 In addition, majority of patients with TED in our cohort were White, consistent with the population distribution in our geographic area. This aspect limits our ability to discuss racial predisposition for TED development and/or severity. We acknowledge that earlier studies suggested that Europeans had higher risk of developing TED compared with Asians, 41 and the clinical presentation tends to be more severe among Hispanics and African Americans. 42
The rate of progression was 45.8%, indicating that most patients were stable. Our regression analysis showed that the severity of soft tissue involvement and presence of diplopia were associated with disease progression. Similar finding regarding diplopia was reported by Qi et al. in their retrospective, multivariate regression analysis study. 43 Their definition of progression was more restrictive, defined as transitioning from inactive to active TED or deterioration from mild to moderate-to-severe TED according to the EUGOGO classification. On the contrary, to our knowledge, there has been no report of association between soft tissue involvement severity and disease progression in earlier studies. Our findings may add to the understanding of risk factors contributing to TED progression and help clinicians determine treatment in a timely manner. Meanwhile, smoking and RAI, which are known to be associated with TED development or progression 29,44 and more severe TED, 30,45,46 were not associated with risk of TED progression or flare in this study, likely due to decreasing number of smokers and patients who received RAI.
Limitations
Our study has several limitations. As expected with a retrospective study that relies on documentation from clinical notes, some data were missing. Due to the relatively small size of the county, we are also limited in our sample size, despite 15-year of study period. This could have certainly impaired our ability to detect risk factors for disease flare and disease progression in our regression analysis. In addition, due to subtlety of mild TED presentation, underdiagnosis and underestimate of incidence rate are possible. Moreover, due to the natural history of the disease in which majority of patients with mild TED improve spontaneously overtime, 23 many patients did not have follow-up for TED, limiting our ability to ascertain their progression, stability, or improvement. The biggest challenge though is the lack of a specific ICD code for this entity, making it impossible to accurately identify all patients affected by this disease. However, this population-based cohort provides better accuracy compared with other methods of epidemiological studies, such as registry based or insurance claim-based studies—for this study, clinical data were collected from patients’ electronic medical records looking at notes in detail and scanning history and physical exam elements for obtaining all the variables of interest, a level of granularity not available to the other studies.
Conclusion
TED incidence and prevalence in Olmsted County, MN remains a societal disease burden although its numerical impact has decreased over the past two decades. The disease continues to take a higher toll in women, and its onset appears to occur earlier in women than in men. Notably, we did see a higher percent of patients with moderate-to-severe TED, where the biological burden of the disease is significant and the need for intervention is also consequently higher. Given the challenges in identifying these cases, we strongly support the development of a specific ICD code for TED. That would allow for a more accurate identification and overall description of this population and with that adequate planning can be instituted for improving TED prevention, diagnosis, and treatment.
Footnotes
Acknowledgments
The authors thank Domnique Sighoko, PhD, Horizon Therapeutics, for her role as the contact person from Horizon Therapeutics who oversaw the timeline and finances for this research project and was the liaison between the sponsor and the Mayo team. The authors also thank Layla Abdul Jabbar, MD, Division of Endocrinology, Diabetes, and Nutrition, Mayo Clinic, Rochester, MN, for extracting part of the incidence data.
Authors’ Contributions
K.N.R.: data collection, writing—original draft, and review and editing; D.H.: data collection and writing—introduction draft; P.T.: statistical analysis; E.A.B.: conceptualization, data collection and interpretation, and writing—review and editing; M.N.S.: conceptualization, writing—review and editing, and supervision.
Authors’ Disclosure Statement
K.N.R., D.H., P.T., and E.A.B. have nothing to disclose. M.N.S.’s institution received grants from Horizon, Immunovant, Sling and Lassen, and consulting fees from Third Rock Ventures, Septerna, Roivant, Tourmaline, OSE Immunotherapeutics, Genentech, and ArgenX.
Funding Information
The funding for this study was provided by