
Abstract
Background:
The increased utilization of computed tomography (CT) has led to a higher detection rate of thyroid incidentalomas. Currently, there are no widely agreed-upon guidelines for managing these incidentalomas. This study aims to investigate the prevalence, follow-up practices, and malignancy rates of thyroid incidentalomas detected by CT.
Methods:
We conducted a comprehensive search of PubMed, Embase, and Cochrane databases to identify relevant studies published before April 12, 2024 (PROSPERO #42024535501). Studies reporting on the prevalence, follow-up, and risk of malignancy (ROM) of thyroid incidentalomas detected by CT were included. Combined outcomes were analyzed using pooled proportion with a random-effects model. The risk of bias was assessed using the Cochrane risk-of-bias tool for randomized trials (RoB 2) and the Newcastle–Ottawa Scale tool. Subgroup analyses were conducted based on characteristics including size of the incidentaloma, CT area, and age of the study population.
Results:
Thirty-eight studies involving 195,959 patients were included in the prevalence analysis, revealing a prevalence of thyroid incidentalomas on CT of 8.3% (confidence interval [CI], 7.4–9.3). The prevalence was higher in neck CT (16.5%, CI, 11.0–22.1) compared with chest CT (6.6%, CI, 5.3–7.9). Multiple incidentalomas were found in 27.0% (CI, 12.9–41.1) of patients. Of the nodules, 46.3% (CI, 32.3–60.3) were ≥1 cm, and 28.6% (CI, 19.9–37.3) were ≥1.5 cm. Thyroid ultrasounds, biopsies, and surgeries were performed in 34.9% (CI, 26.1–43.7), 28.4% (CI, 19.9–36.9), and 8.2% (CI, 2.1–14.4) of cases, respectively. Additionally, 25 studies with 6272 patients reported a ROM of 3.9% (CI, 3.0–4.9) for thyroid incidentalomas detected on CT. A higher ROM was observed in incidentalomas ≥1 cm (11.7%, CI, 3.9–19.4) and ≥1.5 cm (24.9%, CI, 0–52.7) compared with those <1 cm (0.1%, CI, 0–0.8) and <1.5 cm (0%, CI, 0–0.2).
Conclusions:
Most thyroid incidentalomas identified on CT are benign. Implementing a collaborative protocol between radiologists and thyroid specialists to manage high-risk thyroid incidentalomas can ensure appropriate follow-up and optimal patient care.
Introduction
The use of computed tomography (CT) imaging has dramatically increased over the past few decades. 1 This is driven by the advancements in imaging technology and its widespread application in clinical practice. 2 The rise in CT imaging has unintentionally led to an increase in incidental findings, such as thyroid nodules or incidentalomas, often discovered during imaging studies conducted for unrelated medical reasons. Depending on the study population and imaging settings, the reported prevalence of thyroid incidentalomas on CT can vary significantly, ranging from 0.5% to 39%. 3,4
Currently, there are no widely agreed-upon guidelines for the management of thyroid incidentalomas found on CT. The American Thyroid Association recommends evaluating all nodules that are 1 cm or larger. Nodules smaller than 1 cm will only require further evaluation if there are clinical symptoms or associated lymphadenopathy. 5 In contrast, the American College of Radiology (ACR) uses age as an additional risk stratifier and proposes a 1.5 cm threshold for thyroid incidentaloma workup in patients over 35 years old. 6 However, these recommendations were formed based on individual reports of thyroid incidentalomas with mixed quality, which can limit their generalizability. Furthermore, discrepancies between the guidelines of thyroid specialists and radiologists can lead to inconsistent patient care.
The primary aim of this study was to examine the follow-up and risk of malignancy (ROM) of thyroid incidentalomas on CT by performing a systematic review and meta-analysis, thereby testing the validity of current guidelines and informing clinical decision-making. The secondary aim was to explore the prevalence of thyroid incidentalomas on CT to understand the associated disease burden.
Methods
Literature search
This systemic review and meta-analysis was performed according to the outlines of the Preferred Reporting Items for Systematic Reviews and Meta-Analyses. The review was registered prospectively in the PROSPERO database (CRD42024535501). Relevant studies published from inception to April 12, 2024 were identified through searches from PubMed, Ovid Embase, and Cochrane Library. The search strategy was designed and conducted by an experienced librarian, with input from the study’s principal investigator. The detailed search strategy listing all search terms used and how they are combined is shown elsewhere (Supplementary Data S1).
Inclusion and exclusion criteria
Cohort studies or randomized controlled trials providing information on the prevalence, follow-up management, and malignancy rates of incidentalomas found on CT in patients with no prior history of thyroid disease were considered for inclusion. Studies were excluded if they were not published in English or if the results were mixed with other imaging modalities, making it impossible to isolate CT-detected incidentalomas.
Data extraction
Two reviewers extracted the following data using a standard data collection form: first author, publication year, region, sample size, patient demographics, reasons for undergoing CT scans, exclusion of patients with a history of neck radiation, CT body area, CT reconstruction thickness, use of contrast, mean largest diameter of incidentalomas, and methods used to identify incidentalomas. Since all outcomes in this study were binary variables, the number of events of interest and the total number of observed events were extracted from the manuscripts.
Quality assessment
Two reviewers independently assessed the quality of the included studies using two established tools: Version 2 of the Cochrane risk-of-bias tool for randomized trials (RoB 2) for randomized controlled trials, and the Newcastle–Ottawa Scale (NOS) for cohort studies. For randomized controlled trials, the RoB 2 tool evaluates five aspects of bias: bias arising from the randomization process, bias due to deviations from intended interventions, bias due to missing outcome data, bias in the measurement of the outcome, and bias in the selection of the reported result (Supplementary Data S2). For cohort studies, the NOS comprises eight items, each scoring one point, except for the “inter-group comparability” item, which is valued at two points (Supplementary Data S3). However, the “selection of the nonexposed cohort” and “comparability of cohorts on the basis of the design or analysis” items were not scored because all cohort studies included were single-arm studies. The outcome of interest was the malignancy rate of the incidentalomas. Consequently, the following items were not applicable to studies that only reported the prevalence of incidentalomas: “Demonstration that outcome of interest was not present at the start of the study,” “assessment of outcome,” “was follow-up long enough for outcomes to occur,” and “adequacy of follow-up of cohorts.” The maximum possible score for studies reporting malignancy risk was six points. A total score of zero to four, or a follow-up rate of less than 80%, indicated a high risk of bias, while a score of five or six with a follow-up rate of at least 80% signified a low risk of bias. 7
Statistical analysis
All statistical analyses were performed by using Stata version 18.0 (Stata Corp, College Station, TX, USA). For binary outcomes, we calculated the pooled proportion (PP) and reported the 95% confidence interval (CI). The heterogeneity between studies was assessed using the I 2 statistic. 8 The random-effects model (DerSimonian–Laird method) was employed throughout our study because it best handles the inherent variability in studies by assuming effects are distributed, ensuring robust analysis regardless of heterogeneity. To investigate potential sources of heterogeneity, we conducted subgroup and multivariable meta-regression analyses. These analyses considered several factors: the reason for scan (lung cancer screening, COVID-19 screening, trauma, or others), the body area covered by the CT scan (neck, chest, or both), the use of contrast (yes or no), the average age of the study population (≥60 years or <60 years), the risk of bias and the method of identifying incidentalomas. The latter was distinguished between studies where incidentalomas were identified from previous radiology reports and those where all images were reevaluated by radiologists. When studies reported the risk of malignancy, efforts were made to calculate the malignancy rates separately for incidentalomas at least 1 cm, 1.5 cm, and below, unless the results were mixed for all incidentalomas. Sensitivity analysis is used to assess the robustness of the meta-analysis results, and statistical testing using Egger’s or Begg’s method (the number of studies must be ≥8) is used to evaluate whether there is publication bias in the included literature. For results with significant publication bias, the trim-and-fill method is used to assess the impact of publication bias on the results.
Results
Characteristics of the included studies
A flowchart of the study screening process is presented in Figure 1. The initial database search retrieved 916 papers, and an additional 2 were identified through other sources (references from included papers). After removing 180 duplicates, 738 articles were screened by title and abstract. Following this screening, 67 articles were selected for a thorough full-text review, resulting in the exclusion of 18 articles due to ineligibility (Supplementary Table S1). Ultimately, 49 studies 3,4,9 –55 were included for systematic evaluation and meta-analysis.
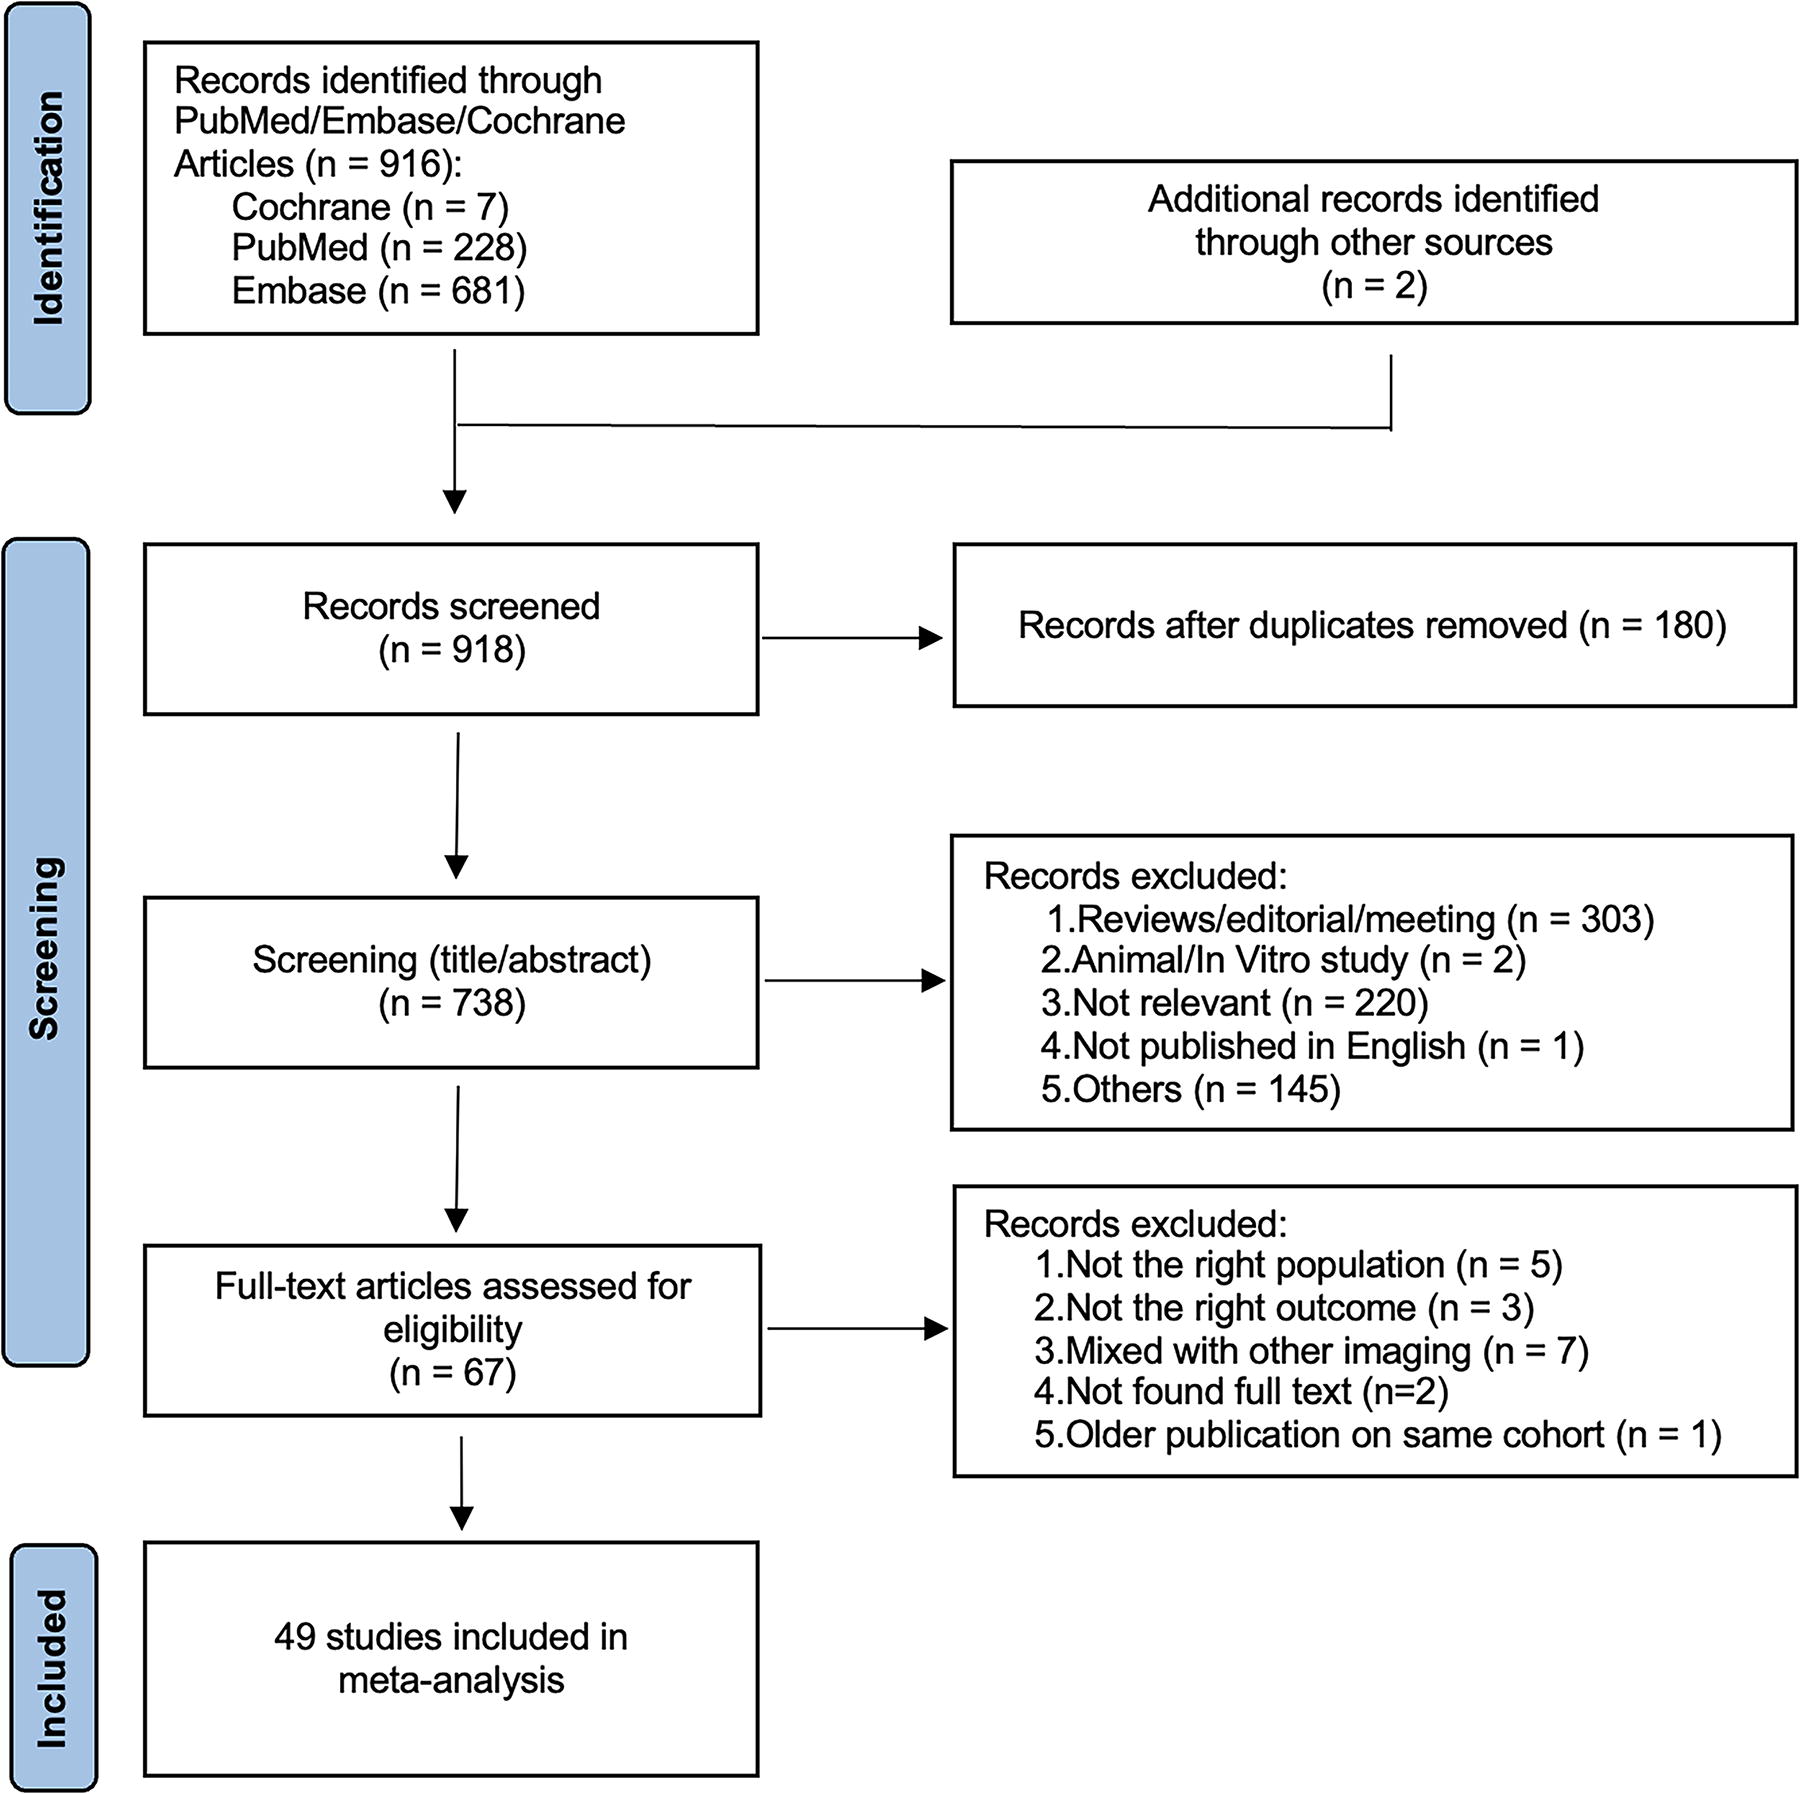
Schema of the literature screening.
Table 1 shows the characteristics of the 49 included studies, encompassing a total of 235,765 patients who underwent CT imaging. Of these, 47 were cohort studies and 2 were randomized controlled trials. The mean age of patients was 56 ± 12 years, and the mean percentage of female patients was 54.9 ± 20.2%. Nine (18.4%) studies excluded patients with a history of neck radiation. The most common indications for CT scans were miscellaneous (40.8%), trauma (16.3%), lung cancer screening (10.2%), and COVID-19 screening (8.2%). Twenty-two (44.9%) studies involved chest CT alone, 13 (26.5%) involved neck CT alone, and the remainder either involved both or did not specify. The reconstruction thickness of CT imaging ranged from 0.75 to 5 mm, and contrast was used in 22 (44.9%) of the studies. The largest mean diameter of the incidentalomas ranged from 0.6 to 3 cm. The majority (59.2%) of the studies identified incidentalomas through text extraction from previous radiology reports, while the remaining 40.8% employed radiologist reevaluation of the original imaging.
Characteristics of the 49 Included Studies
CT, computed tomography; NR, not reported; PCS, prospective cohort study; RCS, retrospective cohort study; RCT, randomized controlled trial; SD, standard deviation.
Quality assessment
Of the two randomized controlled trials included, 10,14 one 10 reported only the prevalence of incidentalomas, while the other 14 also provided follow-up and malignancy rate data. The outcome of the latter was comprehensively documented and considered adequate, leading to its classification as having a low risk of bias (Supplementary Fig. S1). Among the 47 cohort studies included in our review, 3,4,9,11 –13,15 –55 24 studies that reported malignancy data yielded scores ranging from 4 to 6. 11 –13,16 –18,20,22,25,28,30 –32,34,35,40,42,45,47,48,52–55 Of these, 17 were found to have a low risk of bias, 12,13,16 –18,20,25,28,30,31,35,42,45,47,48,54,55 while 7 were associated with a high risk of bias 11,22,32,34,40,52,53 (Supplementary Tables S2 and S3).
Prevalence of thyroid incidentalomas on CT
Thirty-eight studies 3,4,9 –15,18 –21,23,24,26,27,29,32,34 –46,49 –54 reported the prevalence of thyroid incidentalomas based on CT imaging of 195,959 patients. The pooled prevalence of thyroid incidentalomas on CT was 8.3% (CI, 7.4–9.3) (I 2 = 99.3%, p < 0.001) (Fig. 2A). Neither Egger’s test (p = 0.686) nor Begg’s test (p = 0.372) indicated publication bias.
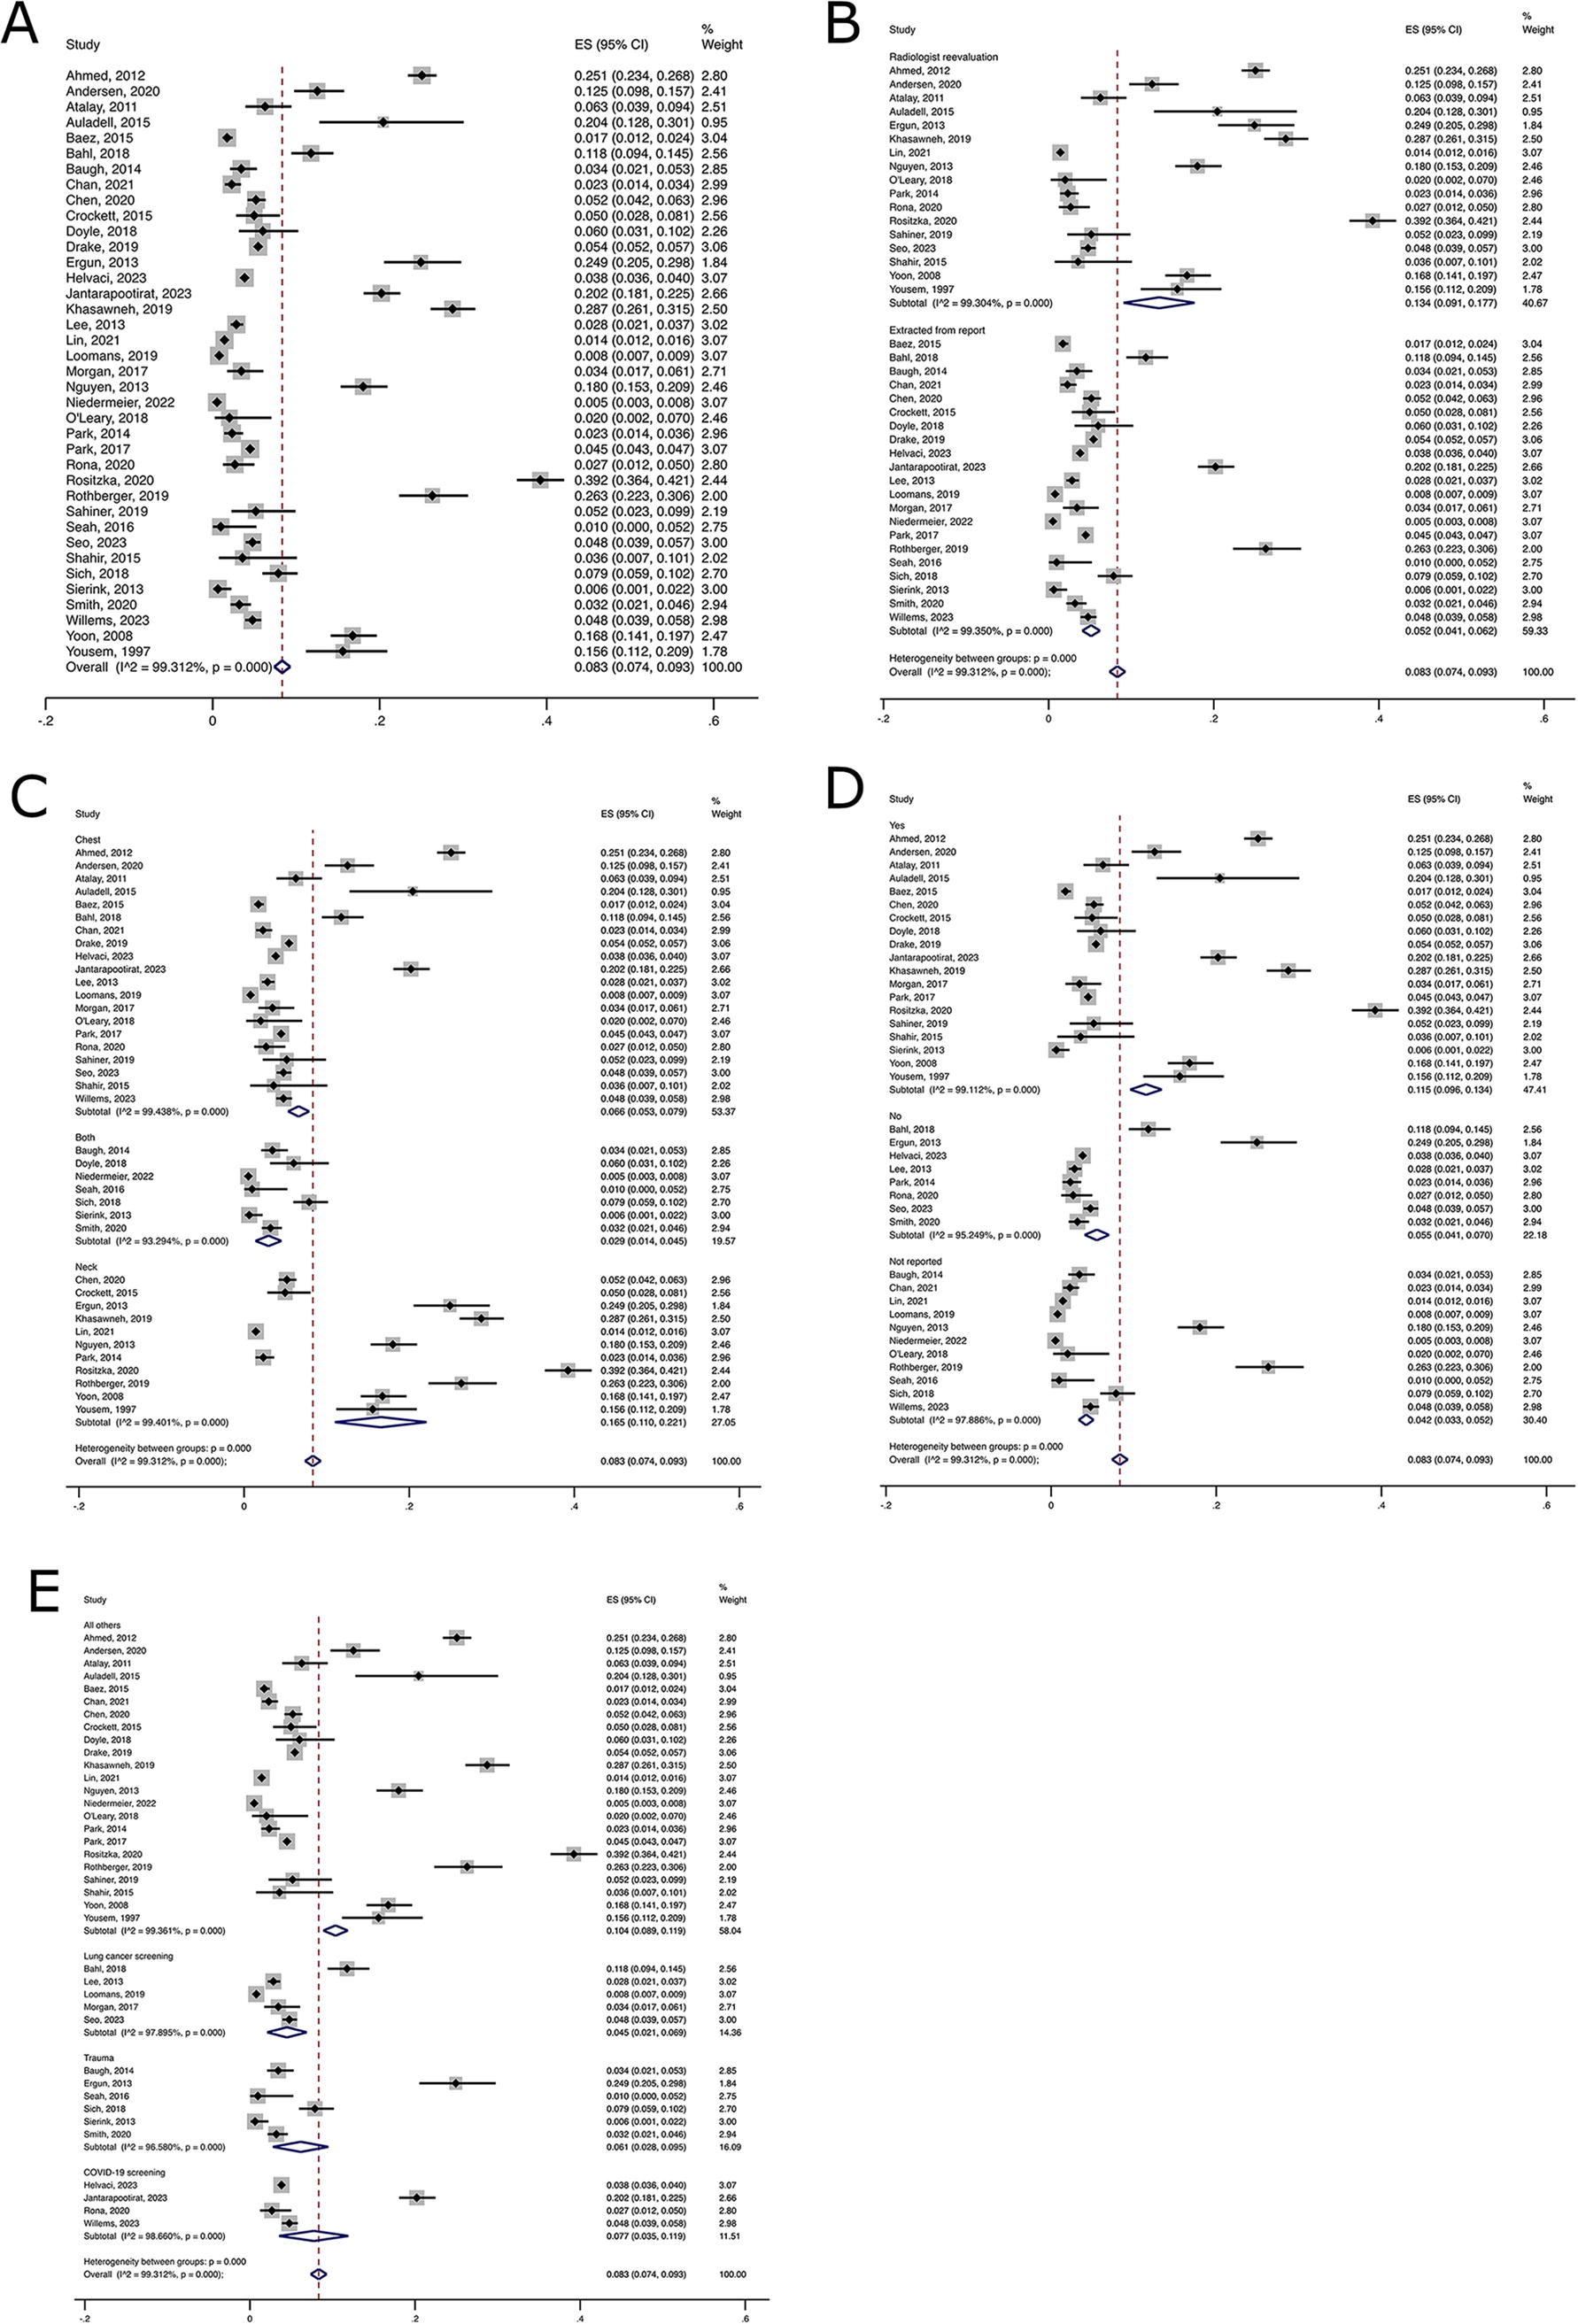
Pooled prevalence of thyroid incidentalomas on CT: overall
Subgroup analysis revealed a higher prevalence of incidentalomas in studies where incidentalomas were identified by radiologist reevaluation (PP 13.4%, CI, 9.1–17.7) compared with studies where incidentalomas were identified from reports (PP 5.2%, CI, 4.1–6.2) (Fig. 2B). The p-value for meta-regression was 0.301. Additionally, a higher prevalence of incidentalomas was observed in neck CTs (PP 16.5%, CI, 11.0–22.1) compared with chest CTs (PP 6.6%, CI, 5.3–7.9) (Fig. 2C). The p-value for meta-regression was 0.028. Incidentalomas were more prevalent in contrast-enhanced CTs (PP 11.5%, CI, 9.6–13.4) compared with noncontrast CTs (PP 5.5%, CI, 4.1–7.0) (Fig. 2D), although the p-value for meta-regression was 0.999. Furthermore, incidentalomas were less common in patients scanned for lung cancer screening (PP 4.5%, CI, 2.1–6.9) compared with those scanned for other reasons (PP 10.4%, CI, 8.9–11.9) (Fig. 2E), with a p-value for meta-regression of 0.687.
A leave-one-out sensitivity analysis was conducted for the pooled prevalence, demonstrating that the combined results were not significantly influenced by any single study (Supplementary Table S4). The funnel plot is shown in Supplementary Figure S2.
Characteristics of thyroid incidentalomas on CT
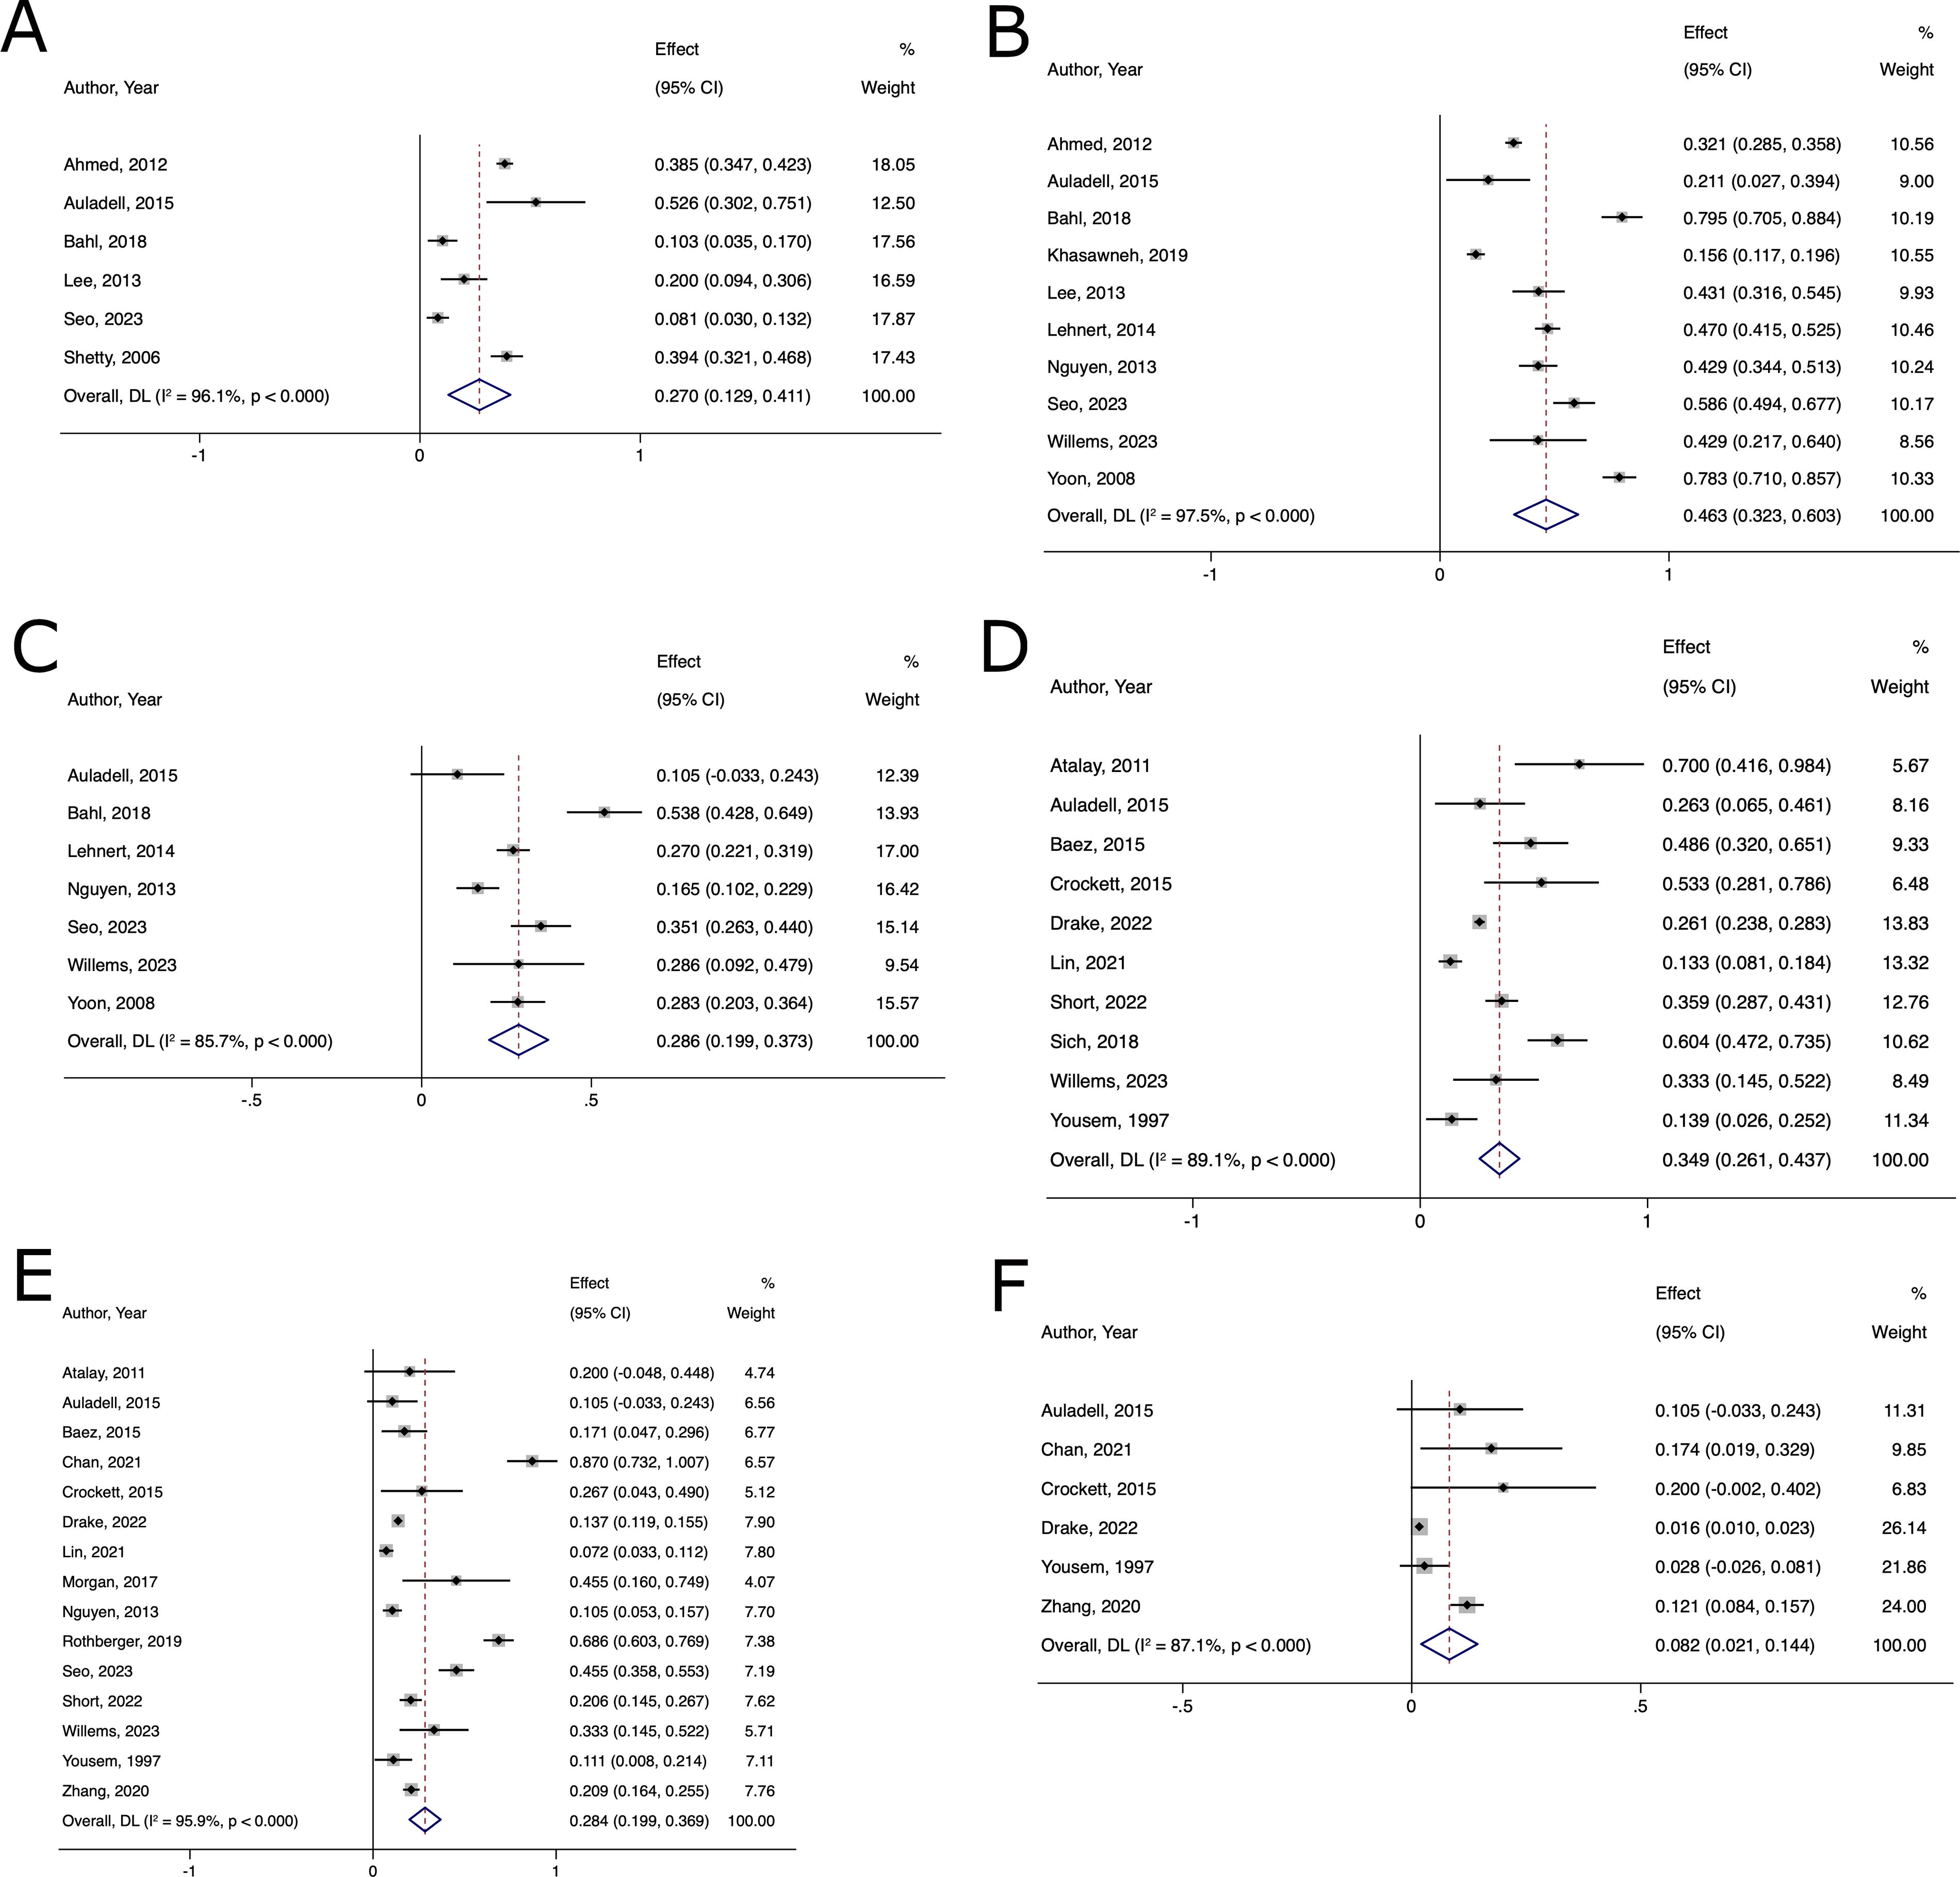
Eleven studies 9,12,14,29,32,33,37,45,47,52,53 reported the imaging characteristics of 1994 patients who had thyroid incidentalomas detected on CT. The percentage of patients with multiple incidentalomas was 27.0% (CI 12.9–41.1) (I 2 = 96.1%, p < 0.001) (Fig. 3A). Additionally, 46.3% (CI 32.3–60.3) of the incidentalomas were 1 cm or larger (I 2 = 97.5%, p < 0.001) (Fig. 3B) and 28.6% (CI 19.9–37.3) of the incidentalomas were at least 1.5 cm (I 2 = 85.7%, p < 0.001) (Fig. 3C). Subgroup analysis did not reveal the effect of reconstruction thickness on the reporting of incidentalomas of 1 cm or larger (Supplementary Fig. S3).
Pooled percentage of having multiple thyroid incidentalomas on CT
Follow-up of thyroid incidentalomas on CT
Sixteen studies 11 –13,18,20,22,34,36,37,42,45,48,49,52,54,55 reported follow-up data for 2683 patients with thyroid incidentalomas detected on CT. The percentage of patients who had a follow-up thyroid ultrasound was 34.9% (CI 26.1–43.7) (I 2 = 89.1%, p < 0.001) (Fig. 3D). The percentage who underwent a follow-up biopsy was 28.4% (CI 19.9–36.9) (I 2 = 95.9%, p < 0.001) (Fig. 3E). The percentage who underwent thyroid surgery was 8.2% (CI 2.1–14.4) (I 2 = 87.1%, p < 0.001) (Fig. 3F).
ROM of thyroid incidentalomas on CT
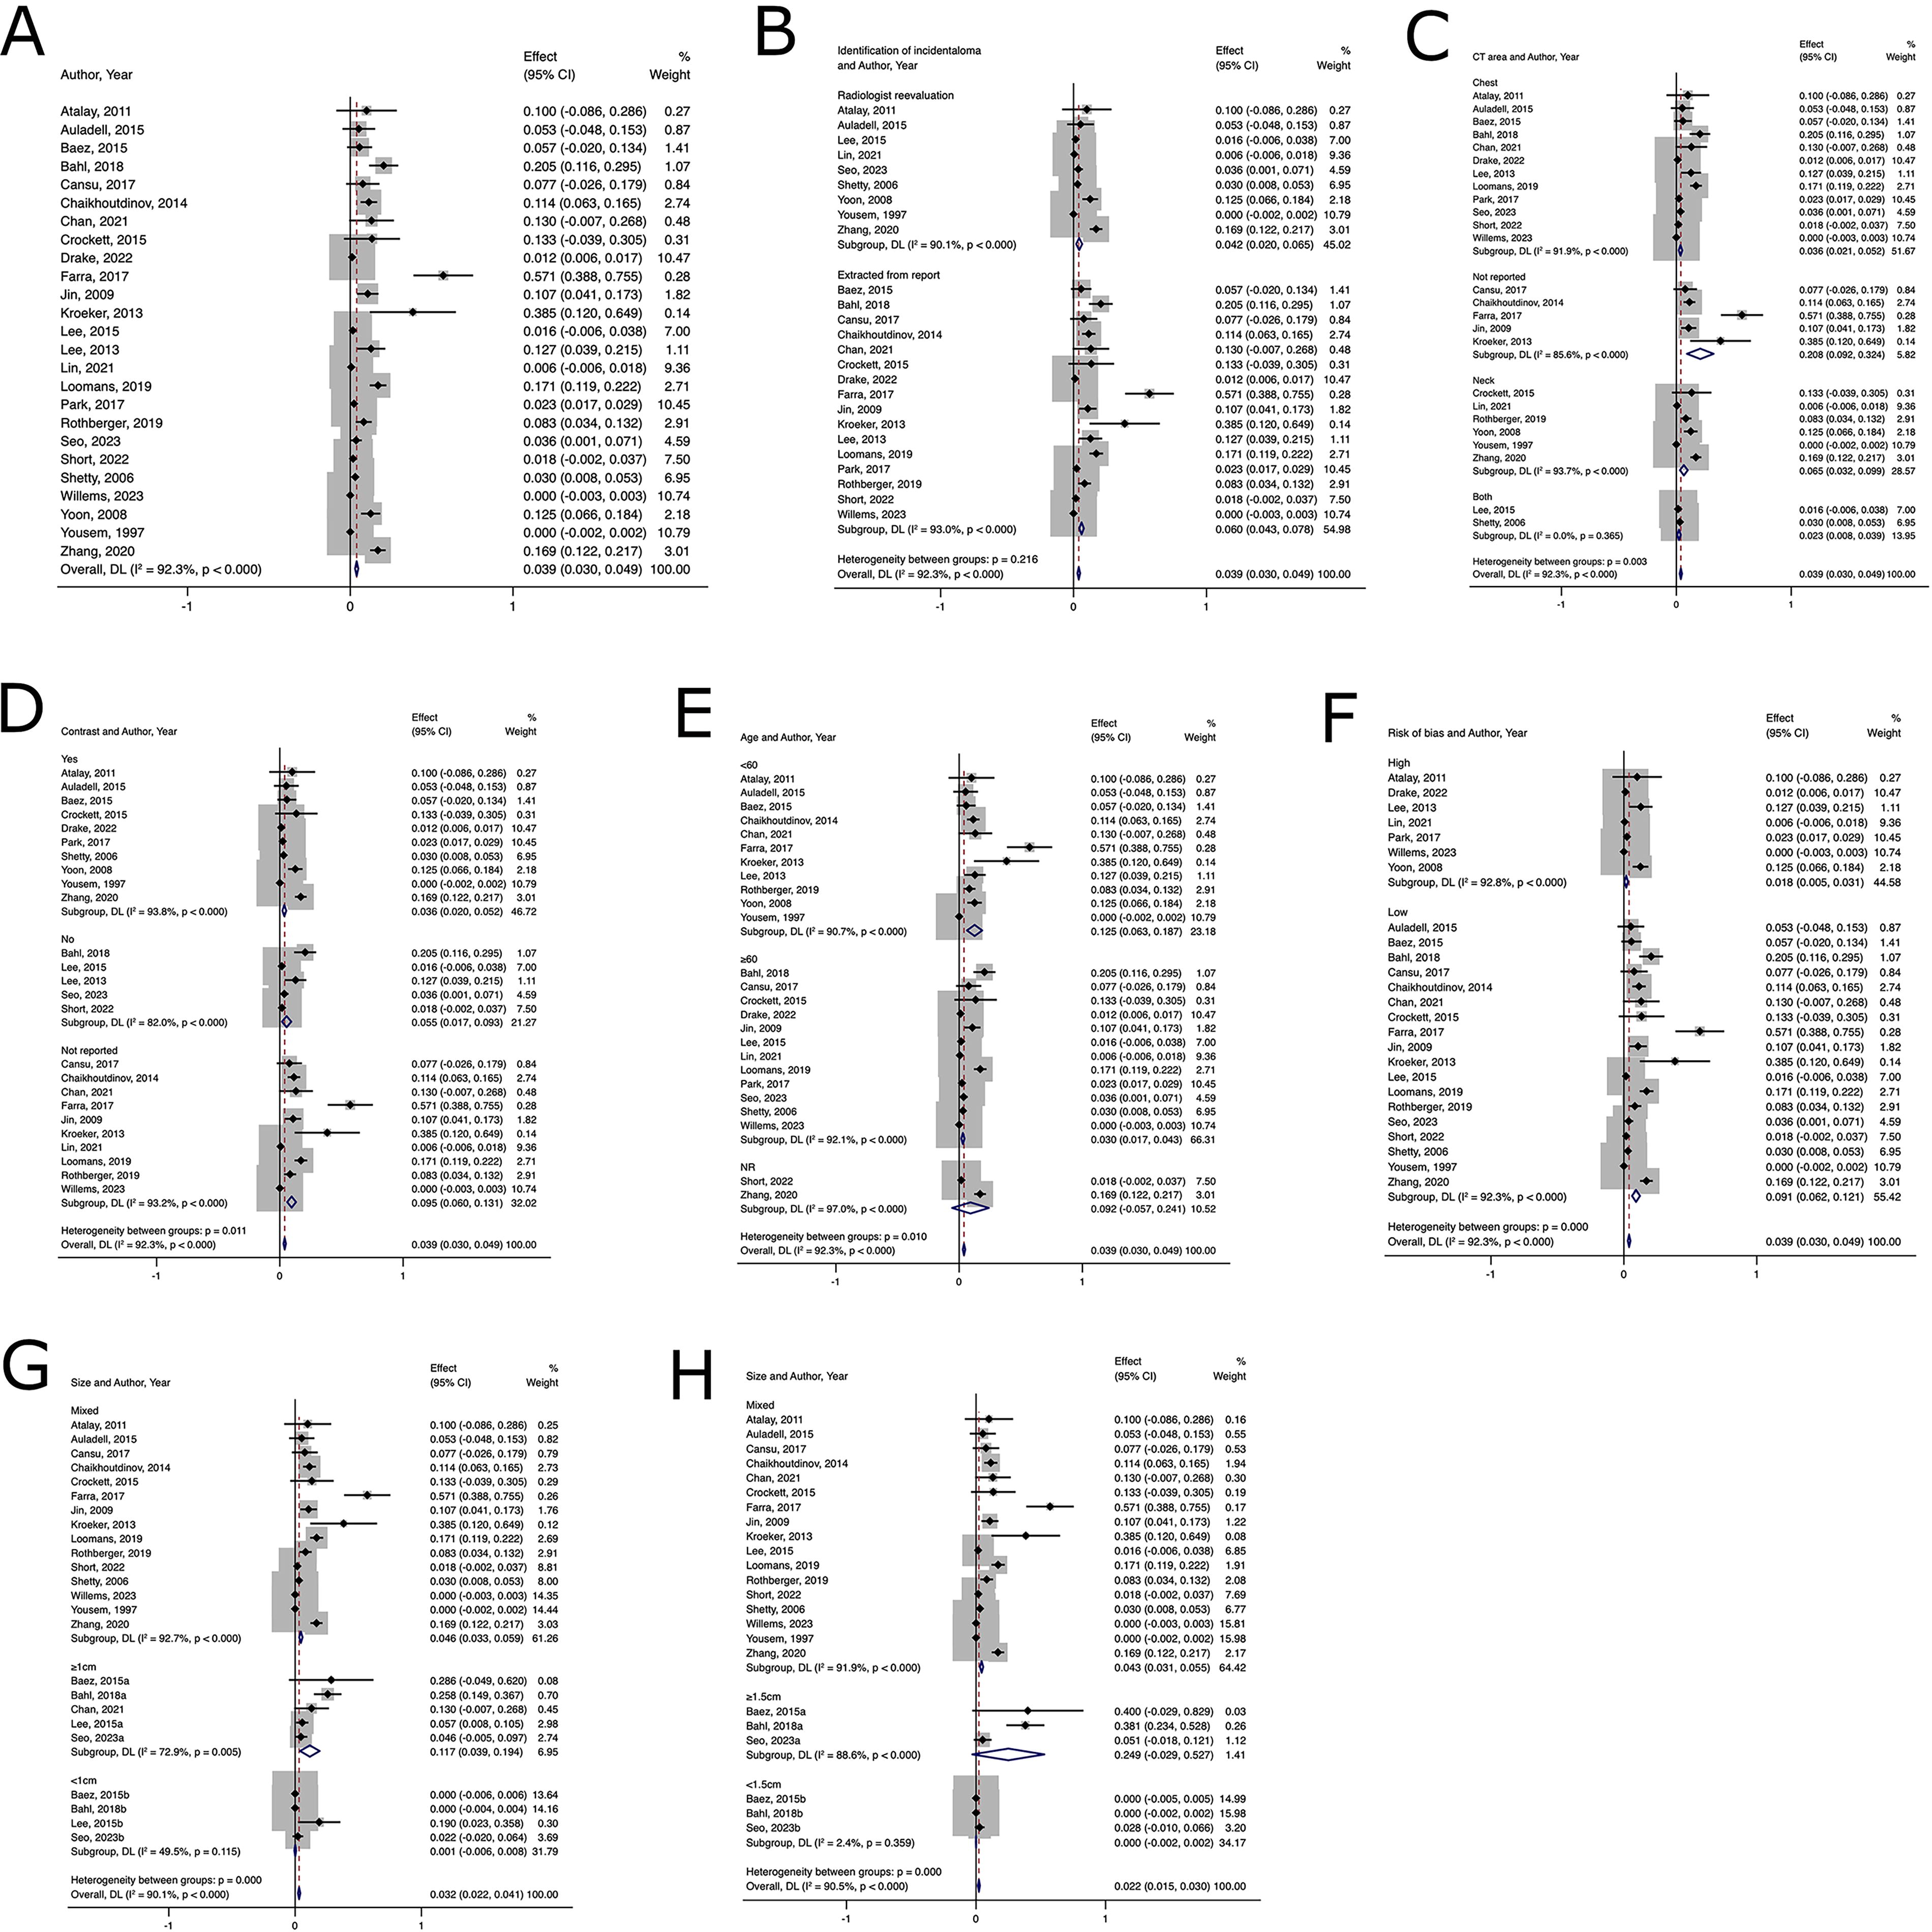
Twenty-five studies 11 –14,16 –18,20,22,25,28,30 –32,34,35,40,42,45,47,48,52 –55 reported the malignancy rates of thyroid incidentalomas detected on CT in 6272 patients. The pooled malignancy rate was 3.9% (CI 3.0–4.9) (I 2 = 92.3%, p < 0.001) (Fig. 4A). Both Egger’s test (p = 0.95) and Begg’s test (p = 0.051) demonstrated no publication bias.
Pooled malignancy rate of thyroid incidentalomas found on CT: overall
Subgroup analysis revealed that the malignancy rate in incidentalomas identified by radiologist reevaluation (PP 4.2%, CI 2.0–6.5) was similar to that in studies where incidentalomas were identified from reports (PP 6.0%, CI 4.3–7.8) (Fig. 4B). The p-value for meta-regression was 0.432. Additionally, the malignancy rate of incidentalomas was comparable in neck CTs (PP 6.5%, CI 3.2–9.9) and chest CTs (PP 3.6%, CI 2.1–5.2) (Fig. 4C), with a p-value for meta-regression of 0.562. Further subgroup analysis showed that the malignancy rate in noncontrast CT (PP 5.5%, CI 1.7–9.3) was similar to that in contrast-enhanced CT (PP 3.6%, CI 2.0–5.2) (Fig. 4D), with a p-value for meta-regression of 0.692. The analysis also revealed that thyroid incidentalomas have a higher malignancy rate in studies where the average age of the population was under 60 years old, with a PP of 12.5% (CI 6.3–18.7), compared with studies with an average age of 60 years or older, which have a PP of 3.0% (CI 1.7–4.3) (Fig. 4E), with a p-value for meta-regression of 0.38. Studies with a low risk of bias show a higher pooled malignancy risk of 9.1% (CI 6.2–12.1) compared with studies with a high risk of bias, which had a pooled malignancy risk of 1.8% (CI 0.5–3.1) (Fig. 4F). The p-value for meta-regression was 0.31.
Five studies 13,14,18,31,45 provided stratified malignancy risk of thyroid incidentalomas on CT by size. Incidentalomas of 1 cm or larger had a malignancy rate of 11.7% (CI 3.9–19.4), compared with 0.1% (CI 0–0.8) for those smaller than 1 cm. Similarly, incidentalomas of at least 1.5 cm had a malignancy rate of 24.9% (CI 0–52.7), compared with 0% (CI 0–0.2) for those less than 1.5 cm.
Additionally, a leave-one-out sensitivity analysis was conducted for the pooled malignancy rate (Supplementary Table S5). The funnel plot is shown in Supplementary Figure S4. Excluding two studies 52,54 resulted in a pooled malignancy rate outside the original CI. After excluding these two studies, the pooled malignancy rate became 6.9% (CI 5.2–8.6) (I 2 = 88.8%, p < 0.001).
Discussion
Our systemic review and meta-analysis provide a comprehensive characterization of the prevalence, follow-up, and malignancy rate of thyroid incidentalomas detected on CT. CT was selected as the imaging modality of interest in this study because it has been shown to detect the highest number of thyroid incidentalomas compared with other imaging modalities. 14,17 We found that the prevalence of thyroid incidentalomas on CT scans is 8.3%, which falls between that of ultrasound (50%) 56 and positron emission tomography scan (2%). 57
Overall CT detection of thyroid incidentalomas can be influenced by patient characteristics (age and scan indication), imaging properties (contrast enhancement), and interpretation methods (radiologist reevaluation). We demonstrated that only 34.9% of thyroid incidentalomas identified on CT were followed up with ultrasound. Further 3.9% were found to be malignant, with a higher malignancy rate observed in incidentalomas of 1 cm or greater and patient age under 60. These data help to better inform physicians about how often a thyroid incidentaloma may be expected to be found on CT imaging and the concomitant expected risk of malignancy.
We found that nodule size and patient age are significant discriminators of malignancy risk. 58,59 The ROM in thyroid incidentalomas measuring at least 1 cm or 1.5 cm increased twofold and sixfold, respectively, compared with the baseline risk of malignancy. In contrast, the ROM of thyroid incidentalomas below both thresholds approached zero, with low-to-moderate heterogeneity. Our findings seem to favor a recommendation for a 1.5 cm threshold for additional evaluation as it may avoid unnecessary workups without risking missing thyroid cancers. This needs to be further validated with future prospective studies. Furthermore, we demonstrated an increased ROM in younger populations, consistent with other reports showing a negative correlation between age and thyroid cancer incidence. 60 Our finding supports the inclusion of age in a potential CT thyroid incidentaloma follow-up guideline criteria, aligning with the ACR guidelines.
One common reason why thyroid incidentalomas smaller than 1 cm underwent workup in many studies included in our review was the presence of suspicious features on CT, such as irregular margins, calcification, and increased Hounsfield units. 13 While some studies have suggested an association between these CT features and malignancy, 61,62 others have found that CT findings only match sonographic findings 53% of the time. 47 This has led the ACR to conclude that CT lacks adequate spatial resolution to display certain helpful sonographic findings, like cystic changes, microcalcifications, and lobulated or irregular margins. 6 Recently, a study utilizing radiomics, which extracts numerous features from medical images, developed a prediction model that achieved a sensitivity of 84% and specificity of 94.1% in predicting the malignancy of thyroid nodules based solely on multiphase CT features. 63 Although this technology is not yet applicable to all thyroid incidentalomas, advancements in CT radiomics will likely provide more information about incidentalomas in the future.
In our study, the percentage of patients who received follow-up ultrasounds was lower than the percentage of incidental thyroid nodules larger than 1 cm. Even with a 1.5 cm cutoff, which results in a lower percentage of incidentalomas requiring further investigation, a significant portion of the studies did not meet this threshold, potentially leaving patients at risk of developing more advanced malignancies. Studies have reported that variability in reporting formats, guideline adherence, and reporting thresholds among radiologists can impact the management decisions of thyroid specialists. 22,33,64 Therefore, a standardized management protocol for thyroid incidentalomas, followed by both radiologists and thyroid specialists, may help promote better patient care. A recent study demonstrated that utilizing a natural language processing algorithm to identify adrenal gland incidentalomas directly from imaging reports supplying detailed guidance for ordering hormonal evaluation and follow-up imaging, improved follow-up and adequate evaluation for adrenal masses exceeding 1 cm in size. 65 This comprehensive approach could inform future strategies for improving the detection and management of thyroid incidentalomas on CT.
This study has several limitations. First, the results showed substantial heterogeneity. The heterogeneity in prevalence can be partially explained by the body area covered by CT as a significant discriminator. We believe the heterogeneity in the ROM might be caused by different definitions of thyroid incidentalomas across various studies, which we could not fully capture. Additionally, the inclusion criteria for thyroid incidentalomas, and thus the patient populations at risk for thyroid cancer, vary. Some studies began their analysis with all patients receiving CT scans. While these studies are less likely to be subject to selection bias, they tend to suffer from incomplete follow-up. Other studies focused on patients who were found to have thyroid incidentalomas. Although these studies have adequate follow-up, the populations are prone to preselection, where the cohort is inherently at a higher risk of malignancy, leading to an overestimation of the risk of malignancy. Second, only one-fifth of the included studies were suitable for analysis of malignancy risk by size, which is particularly evident from the high variance in malignancy risk of thyroid nodules of 1.5 cm or larger. This is due to most studies not providing data to stratify the malignancy rate. Third, the subgroup analysis on age was based on the mean age of the study population rather than a detailed breakdown of malignancy risk by specific age groups. Lastly, our study does not report on prognostic data. Since thyroid cancer is mostly an indolent cancer, we do not have data showing how the management of thyroid incidentalomas is directly related to morbidity and mortality.
Conclusions
Thyroid incidentalomas are not uncommon findings on CT and generally have a relatively low risk of malignancy. However, follow-up is often inadequate. Implementing a protocol that involves close collaboration between radiologists and thyroid specialists may improve the care for patients with thyroid incidentalomas.
Footnotes
Authors’ Contributions
Z.S.: Conceptualization (lead), writing—original draft (lead), writing—review and editing (equal), formal analysis (lead), and methodology (lead). C.W.: Methodology (equal) and writing—review and editing (equal). J.K.: Formal analysis (equal) and writing—review and editing (equal). A.G.: Formal analysis (equal) and writing—review and editing (equal). J.F.: Formal analysis (equal) and writing—review and editing (equal). B.L.: Writing—review and editing (equal). H.C.: Conceptualization (lead) and writing—review and editing (equal).
Author Disclosure Statement
The authors have no financial interests to disclose. All authors have reviewed the final draft of this article and are fully accountable for the content and integrity of this work.
Funding Information
No funding was received for this study.
Supplementary Material
Supplementary Data S1
Supplementary Data S2
Supplementary Data S3
Supplementary Figure S1
Supplementary Figure S2
Supplementary Figure S3
Supplementary Figure S4
Supplementary Table S1
Supplementary Table S2
Supplementary Table S3
Supplementary Table S4
Supplementary Table S5