
Abstract
Background:
Health economic appraisals often rely on the assessment of health utilities using preference-based measures (PBM). The cancer-specific PBM, European Organisation for Research and Treatment of Cancer Quality of Life Utility — Core 10 Dimensions (EORTC QLU-C10D), was developed recently, and now needs to be validated in various clinical populations.
Methods:
In a multicenter, multinational prospective cohort study, we longitudinally collected EORTC QLQ-C30 and EQ-5D-5L data from patients with thyroid cancer. We applied seven country-specific value sets to the QLQ-C30 data to derive country-specific utility values and used the EQ-5D-5L as a comparator PBM. Criterion validity was assessed by correlating index scores and Bland–Altman plots. Construct validity was investigated by correlating domain scores. Known-group comparisons and responsiveness were assessed using external clinical criteria.
Results:
A total of 181 patients with thyroid cancer from nine countries (three continents) provided analyzable data. Patients were included if they had differentiated, medullary, or anaplastic thyroid cancer. Mean utility values of both instruments were generally lower compared to general population norms. No floor or ceiling effects were present for the QLU-C10D. The intra-class correlation for EQ-5D-5L and QLU-C10D index values ranged from 0.761 to 0.901 across the measurement timepoints, supporting criterion validity. Spearman’s correlation coefficients ranged from 0.289 to 0.716 for theoretically corresponding domain pairs. The QLU-C10D detected differences in 9 of 15 known-group comparisons, supporting sensitivity. Clinically important changes were detected by all QLU-C10D country specific value sets, supporting responsiveness. Further, the QLU-C10D had higher statistical efficiency than the EQ-5D-5L in 74.7% of comparisons.
Conclusions:
The QLU-C10D is a valid PBM for health economic evaluations in thyroid cancer studies. We recommend its use to estimate health utilities in economic evaluations of thyroid cancer therapies.
Introduction
Health care system decision-makers endeavor to examine health technology performance to ensure evidence-based practices and improve the overall quality of care. 1 An increasingly important tool in this endeavor is cost-utility analysis (CUA). 2 CUAs provide policymakers with direct comparisons of the clinical benefits and the financial impact of alternative healthcare strategies. 2 This frequently includes the assessment of health-related quality of life (HRQoL). CUAs typically attempt to achieve this using quality-adjusted life years (QALYs) as the outcome measure. QALYs merge the complementary concepts of length and quality of life, the latter captured as health-state utilities with values ranging from 1 (representing full health) to values below 0, where 0 represents being dead). 3 In essence, health state utilities are the quality adjustment metric in QALYs. They are commonly derived by using preference-based measures (PBMs), which capture health states and the preference for certain health states in a given population. 4 Comparing QALYs and costs of different therapeutic options in CUAs can provide guidance for healthcare systems around which treatment strategies to prioritize and to reimburse. 2 Especially in oncology, where treatment strategies are rapidly advancing but treatment costs can be high, a reliable evaluation of their costs and benefits is needed. 5
In this work we focus on the estimation of health state utilities for patients with thyroid cancer. Globally, the annual incidence of thyroid cancer is estimated at 2.83 cases per 100,000 individuals, with mortality of 0.59 per 100,000. 6 However, survival differs significantly depending on the type of thyroid cancer. Notably, patients with papillary or follicular subtypes have a 5-year survival of well over 95%. 7 For patients with medullary thyroid cancer, the 5-year survival lies between 75% and 85%. 8 For the most aggressive variant, anaplastic thyroid cancer, median survival time is less than 6 months. 9,10 While thyroid cancer often carries a favorable prognosis, it is still a malignancy, posing possible loss of life years and the reduction of health-related quality of life (HRQoL). Patients with thyroid cancer report compromised HRQoL, compared to the general population or healthy controls prior to treatment, 11 while receiving treatment, 12 after treatment 13 and once classified as a cancer survivor. 14 In light of this, several new treatment strategies and follow up regimes 15 are currently being developed and tested for the various types of thyroid cancer. 16 These new treatment options and adjunct modalities ought to be evaluated in terms of clinical benefit and affordability.
In order to aid the evaluation of cancer treatments from a health economic perspective, the Multi-Attribute Utility in Cancer Consortium 17,18 and the European Organisation of Research and Treatment of Cancer (EORTC) 19 –27 developed a cancer specific preference-based measure—EORTC QLU-C10D. It relies on the structure and content of the widely used EORTC Quality of life Core Questionnaire, the EORTC QLQ-C30. 28,29 Additionally, country specific value sets 18 –27 are available that enable calculation of health state utilities that respect country-specific preferences for the health states described by the QLU-C10D. Hence, the QLU-C10D provides a scoring algorithm for the EORTC QLQ-C30, allowing the prospective and retrospective calculation of health state utilities from EORTC QLQ-C30 data. Contrary to generic utility instruments such as the EQ-5D, 30,31 the HUI, 32 or the SF6D, 33 the QLU-C10D is specifically designed to estimate health utilities from cancer patients only. As a last step in its development, the QLU-C10D requires psychometric validation in various patient populations and countries.
Quality criteria for health status questionnaires demand the validation of health status instruments before recommending their use in a specific population and setting. 34 The aim of the present study was to assess the construct validity and responsiveness of the QLU-C10D for use in the thyroid cancer patient population following the criteria for valid and ready-to-use health status questionnaires. 34 For the purpose of this study, health utilities estimated by the EQ-5D-5L 31 served as a benchmark, as this instrument is the successor of the most frequently used generic utility instrument, the EQ-5D-3L. 30
Patients and Methods
Patients
Data for this analysis were collected during phase IV of the development and validation of the EORTC thyroid cancer module, the EORTC QLQ-THY34. 35 Patients participating of the phase IV EORTC QLQ-THY34 development study were included in this nested study if they further provided responses to the EQ-5D-5L. The study design is a prospective cohort study. Patients were assessed in a total of 13 centers in 9 countries across three continents. These were collaborating centers in the phase IV module development of the EORTC QLQ-THY34 study. Patients were included if they had a secured diagnosis of thyroid cancer (ICD-10, C73), were 16 years of age and older, provided a written informed consent, and were proficient in the language of the questionnaire. A sampling matrix was deployed to ensure the inclusion of patients with differentiated, medullary, and anaplastic thyroid cancer. Treatment modalities entailed surgery, non-surgical interventions (RAI, tyrosine kinase inhibitors, radiofrequency ablation, radiation therapy), or other local or systemic anti-cancer treatment. No power calculation was performed for this nested study. Detailed eligibly criteria and further information on the enrolment process are described elsewhere. 35
Data collection
Clinical and sociodemographic data were obtained from clinical records. The questionnaires were self-administered by the patients. Data collection took place either via an online assessment tool or via paper-and-pencil assessments. Data were collected at three timepoints: Baseline (t1) defined as up to 4 weeks before start of treatment. Follow-up (t2) at 6 weeks after the first day of treatment and the last visit (t3) 6 months after t2. Clinical information was gathered from medical charts. Patients of collaborating centers who agreed to participate, filled out the EORTC QLQ-C30 and the EQ-5D-5L at each timepoint. The Subjective Change Questionnaire (SSQ) 28 was presented at t2 and t3. Patients with missing questionnaire data at baseline were excluded from the current analyses. The process of data selection is shown in Figure 1. Bias analyses were performed by comparing included and excluded cases with regard to sociodemographic (sex, age) and clinical variables (histology and planned treatment at baseline) as outlined in the sampling plan for the validation of the EORTC QLQ-THY34 (results see Supplementary Table S10). 35

Flow chart patient selection.
Instruments
EORTC QLQ-C30
The EORTC QLQ-C30 is comprised of 30 questions that are collated into 15 scales. Of these, five are functioning scales (physical, role, emotional, social, and cognitive), nine are symptom scales (fatigue, nausea and vomiting, pain, dyspnea, insomnia, appetite loss, constipation, diarrhea, and financial difficulties), and one is a global health status (GHS) scale. The GHS assesses overall self-reported overall health and QoL. The Physical Functioning scale does not have a recall period, all other scales have a recall period of 1 week. Responses are rated on a four-point Likert scale, ranging from ‘not at all’ to ‘very much’, for all questions except for GHS items, which are rated on a scale of 1 to 7, with 1 being ‘very poor’ and 7 being ‘excellent’.
QLU-C10D
The QLU-C10D uses 13 out of the 30 items from the EORTC QLQ-C30, which form ten dimensions: Physical Functioning (PF), represented by the long and short walk items of the QLQ-C30; Role Functioning (RF), represented by the work and daily activities item; Social Functioning (SF), represented by the social and family life items; Emotional Functioning (EF), represented by the depression item; Pain (PA), represented by the pain item; Fatigue (FA), represented by the tired item; Sleep (SL), represented by the trouble sleeping item; Appetite (AP), represented by the lack of appetite item; Nausea (NA), represented by the nausea item; and Bowel Problems (BP) represented by the diarrhea and constipation items. The selection of the 13 items forming these 10 domains is based on previous work by King et al. 17 It is advised that the QLQ-C30 is administered and the QLU-C10D health state utility is calculated from the respective health state classification system.
A single utility index score per patient is calculated from these 13 items as a weighted sum of the component QLQ-C30 items, using a utility scoring algorithm that incorporates the utility weights that were generated in a valuation study to derive the health state preferences of the general population of a particular country. A number of country-specific scoring algorithms are available. 18 –27,36 While a standardized discrete-choice experiment methodology has been used across all countries, and the general form of the algorithm is the same, the actual values of the algorithm’s weights differ between countries. The weighting aspect of the algorithm imposes a disutility (utility decrement) for any loss of function or symptom experience worse than the full health level. All these algorithms yield a maximum value of 1 representing full health, i.e., no problems with any aspects of functioning and no symptom experience. Each step away from full health leads to a lower utility score. The minimum possible value is for the so-called ‘pits’ state, i.e., the health state with the worst level on all domains, which will vary between countries, depending on each country’s worst level utility weights. Values below 0 are possible and are associated with health states that are interpreted as worse than being dead.
EQ-5D-5L
The EQ-5D-5L is a generic health status questionnaire that is frequently used in health economic studies. 37 The questionnaire assesses five aspects of general health: Mobility (MO), Self-Care (SC), Usual Activities (UA), Pain/Discomfort (PD), and Anxiety/Depression (AD). Each item has five response options: ‘no problems’, ‘slight problems’, ‘moderate problems’, ‘severe problems’, and ‘extreme problems’. Additionally, patients assess their overall health through a visual analogue scale (VAS). Valuation studies for the EQ-5D-5L rely on the time-trade-off, or discrete-choice experiments in the general population. 38 National value sets are available for a large range of countries and can be found on the EuroQOL website (https://euroqol.org/information-and-support/resources/value-sets/) The VAS assesses self-rated overall health on a scale ranging from 0 (worst imaginable health) to 100 (best imaginable health).
Subjective significance questionnaire (SSQ)
The SSQ utilized for this study was based on Osoba et al. 1998. 39 It was adapted for the present study to assess patients’ perceived changes in health domains which had been rated as most relevant by patients with thyroid cancer in phases I 40 and III 41 of the development of QLQ-THY34. The SSQ for this study comprised five items: (i) fatigue, (ii) voice, (iii) tingling sensations, (iv) temperature tolerance, and (v) overall QoL. The item wordings were “Since the last time I filled out the questionnaire, my [symptom/QoL] is … compared to the last assessment” and the seven response options were ‘very much worse’, ‘moderately worse’, ‘a little worse’, ‘same’, ‘a little better’, ‘moderately better’, and ‘very much better’.
Statistical analysis
Sample characteristics are presented as absolute numbers, means, standard deviations (SD), and valid percentages. Health state utilities for the QLU-C10D and the EQ-5D-5L were calculated by using the country-specific value set of seven different countries [Australia (AUS), Canada (CAN), Germany (GER), Spain (ESP), Italy (ITA), Japan (JPN), and the United Kingdom (UK)] 18,19,21,22,24,27,42 –48 because patients from most of these countries are included in the current study. We also aimed to validate the Canadian country value set despite not having Canadian cancer patients in the sample. While the method of applying domestic values sets to external data is common practice for some jurisdictions, 49 the use of a Canadian country value set is explicitly requested by the Canadian Drug and Heath Technology Agency. 50 Hence, the validation of the Canadian value set enables a specific use-case for health technology assessments in Canada.
Construct validity
QLU-C10D and EQ-5D-5L general population utility norms 51 –58 were used to put the utilities derived in this study in relation to expected utilities from the general population. Floor and ceiling effects for index scales and domain scores were investigated as valid percentage of patients reaching the lowest/highest possible score. For utility index scores, the highest possible score was 1, and the lowest possible score was that of the ‘pits’ state, the value of which varied between countries, depending on each country’s worst level utility weights. In case more than 15% reached the highest or lowest level it was considered relevant for validity in terms of limiting discriminatory ability of the measure. 34 Spearman correlation coefficient (r) was calculated to analyze convergent and divergent validity of QLU-C10D and EQ-5D-5L domains. Theoretically corresponding domains (PF and MO/UA, RF and UA, SF and UA, PA and PD, EF and AD) were hypothesized to show moderate to strong correlations. Cancer-specific domains were expected to show weak to moderate correlations with all domains of the generic measure. Standard convention was used for interpreting r (<0.50 weak, <0.70 moderate and ≥0.70 strong correlations). 59
As both measures, QLU-C10D and EQ-5D-5L, are designed to measure a similar construct (health-state utilities), we expected an overall high agreement between both index scales. Intra-class correlations (ICC) for index scales were calculated based on pairs of observations. ICC values for absolute agreement ≥0.75 indicate excellent agreement. 60
Bland–Altman plots were generated for visual inspection of agreement between measures separately for country-specific value set. Differences (QLU-C10D utility minus EQ-5D-5L utility) were plotted on the y-axis and means on the x-axis of the scatter plot. Minimal important differences (MID) reported for the EQ-5D index score in an UK oncology population 61 were used as a crude measure to pre-define acceptable levels of systematic measurement difference of ±0.08; other MIDs reported for the EQ-5D-5L range from 0.072 for the Malaysian value set to 0.101 for the Taiwanese value set. 62 Levels of Agreement (LOA) were drawn at ±1.96 × SD of the mean difference.
Sensitivity
The sensitivity of the QLU-C10D was assessed by its ability to discriminate between ‘known groups’, i.e., the QLU-C10D’s ability to detect statistically significant differences in utility values between specific patient subgroups which were expected to differ in health status in clinically important ways. Fiveteen sub-groups were formed; (a) 13 groups based on clinical variables and (b) two based on patient self-reported variables. Namely these are: Clinical variables at baseline: (1) Tumor histology (differentiated vs. medullary, anaplastic, other); (2) Hypoparathyroidism (no vs. yes); (3) Karnofsky clinician-rated performance status (≥90 vs. <90); (4) Lymphatic invasion (no vs. yes); (5) Psychiatric comorbidity (no vs. yes); (6) Status of Disease (no evidence of disease vs. structural disease/incomplete and indeterminant response); (7) Vocal Cord Impairment (no vs. yes); (8) Current hormone withdrawal (no vs. yes); (9) Central and/or lateral neck dissection (no vs. yes); (10) Resection status (R0 vs. R1 and R2); (11) Thyroidectomy (none vs. total); (12) Treatment scheme (monotherapy vs. bi-/multimodal); (13) UICC (I + II vs. III + IV) Patient Self-Reported variables: (1) VAS score (>50 vs. ≤50), and (2) GHS (>50 vs. ≤50);
For these sub-group comparisons, independent t-tests were calculated. As effect size measure Cohen’s d was used, calculated as the mean difference divided by the pooled standard deviation (SD).
Responsiveness
Responsiveness of the QLU-C10D to clinically important changes in health state was calculated for three periods: (i) from t1 to t2, (ii) from t1 to t3, and (iii) from t2 to t3.
External criteria for a change in disease experience (i.e., subjective change of quality of life) were used: (i) Change in VAS score [<10 points change (=stable) vs. ≥10 points deterioration or improvement], 63 (ii) Change in GHS score [<10 points change (=stable) vs. ≥10 points deterioration or improvement], 39 which were previously defined as meaningful group difference. Additionally, we relied on (iii) the QoL item of the SSQ, 39 recoded to “improved”, “stable”, and “deteriorated”. The SSQ category ‘improved’ was assigned for patients that indicated a little-, moderately-, or very much better QoL. Patients that indicated little-, moderately-, or very much worse QoL were categorized as ‘deteriorated’. Patients that reported the same QoL compared to the previous assessment were categorized as ‘stable’.
Ability to detect change was analyzed using paired (within group change) t-tests and ANOVA for difference between group change. The Responsiveness Index (RI) was calculated as effect size for change (=mean change within improvement or deterioration group divided by the SD of change of the stable group). For responsiveness comparisons with the EQ-5D-5L the Difference in Responsiveness Index (DRI) was calculated (RI of QLU-C10D minus RI of EQ-5D-5L).
In case statistically significant differences/changes were detected, relative efficiency (RE) was calculated as quotient of t-values of each instruments’ pair of country-specific value set (t-value QLU-C10D/t-value EQ-5D-5L). 64 RE was calculated to directly compare QLU-C10D efficiency in detecting group differences or change in patients with thyroid cancer with the EQ-5D-5L: 65,66 RE values smaller than 1 indicate higher efficiency of the EQ-5D-5L, and, conversely, RE values higher than 1 indicate higher efficiency of the QLU-C10D. Higher efficiency translates into smaller required sample sizes. To account for multiple testing, p-values were Bonferroni–Holmes corrected in order not to exceed an overall alpha level of 5%. 67
Sensitivity and responsiveness analysis rely on the assumption of clinical important differences and changes. While the sensitivity analysis relies on a-priori defined clinical groups, the responsiveness analysis relies on an estimate of change on the GHS, VAS, and SSQ which were previously deemed clinically meaningful. 39,63
Results
Patient characteristics
A total of 186 patients enrolled in this study completed both the EORTC QLQ-C30 and the EQ-5D-5L at least once at baseline. Data selection and reasons for exclusion are presented in Figure 1. Patients were assessed in a total of 13 centers in 9 countries. In our sample 128 (68.8%) of the respondents were female, and the mean age was 50.98 years (SD 16.4). A total of 145 patients (78.0%) had differentiated thyroid cancer, 20 patients (10.8%) had the medullary form, and 21 patients (11.3%) had anaplastic/other thyroid cancer. Further sociodemographic and clinical characteristics are presented in Table 1.
Baseline (t1) defined as up to 4 weeks before start of treatment. Follow-up (t2) at 6weeks after the first day of treatment and the last visit (t3) 6 months after t2.
Monotherapy categorized if patients received a single anti-cancer treatment; Bi-,multimodal therapy categorised if patients received two-or-more anti-cancer treatments [surgery, non-surgical interventions (RAI, tyrosine kinase inhibitors, radiofrequency ablation, radiation therapy), or other local or systemic anti-cancer treatment].
UICC, Union for International Cancer Control.
Bias analysis, comparing the full sample of the thyroid cancer module EORTC QLQ-THY34 development study with the sub-sample for this analysis, found no significant differences which would indicate selection bias (Supplementary Table S10).
Overall, health states for the patients with thyroid cancer were generally lower than the population norms for both measures and all country-specific value sets. The exception was that at t3, the QLU-C10D utility values for Germany and the UK exceeded the population norms. The smallest differences between population norms and patients with thyroid cancer for the QLU-C10D were found for the Canadian (t3) and the UK (t1) country value sets (Δ0.008), while the largest difference was observed for the Italian value set at t2 (Δ0.086). The lowest difference between population norms and patients with thyroid cancer for the EQ-5D-5L was found for the German country value set at t3 (Δ0.01), whereby the highest difference was observed for the Spanish value set at t1 (Δ0.199). Details in Table 2.
Mean Health State Utility Values
Sample of female participants, 45–54 years.
SD, Standard Deviation; t1, baseline, t2 and t3, subsequent timepoints after Baseline; Country value sets: AUS, Australia, CAN, Canada, GER, Germany, ESP, Spain, ITA, Italy, JPN, Japan, UK, United Kingdom.
Across all country-specific value sets and assessment timepoints, there were no relevant floor or ceiling effects present for the QLU-C10D index scores. Across all country value sets and timepoints, merely one patient (≈0.6% of patients) reached the lowest possible score, while 12.3% was the highest percentage of patients reaching the maximal score for the QLU-C10D (Australian value set at t3). For the EQ-5D-5L index scores, no relevant floor effects were found but ceiling effects were present for all country-specific value sets and most timepoints (Table 3). Details regarding the floor and ceiling effects of the domains of each instrument are provided in the supplementary material (Supplementary Table S1).
Floor Effects (at Pit States) and Ceiling Effects (at 1 = Full Health) QLU-C10D and EQ-5D-5L Index Scales
Ceiling effects were assessed for the highest possible score, i.e., 1 (full health).
Floor effects were assessed for the lowest possible score, i.e., ‘the pits state’ which varied depending on each country’s worst level utility weights. Pits states: (QLU-C10D / EQ-5D-5L): AUS (−0.1 / −0.3), CAN (−0.15 / −0.15), GER (−0.01 / −0.66), ESP (−0.05 / −0.42), ITA (0.03 / −0.57), JPN (−0.22 / −0.03), UK (−0.08 / −0.29).
t1, Baseline, t2 and t3, subsequent assessments after baseline; AUS, Australia, CAN, Canada, GER, Germany, ESP, Spain, ITA, Italy, JPN, Japan, UK, United Kingdom.
ICC were strong between the QLU-C10D and the EQ-5D-5L index scores across all time points (ICC ranges from 0.761 to 0.901; all ICC are reported in Supplemental Material, Supplementary Table S9). On domain level, moderate to strong Spearman correlations were observed for theoretically corresponding domains. The domain pair Pain—Pain/Discomfort showed the highest correlation (Rho 0.601 for all country-specific value sets). Weak to moderate correlations were observed for theoretically distant domain pairs. The QLU-C10D domain Bowel Problems had the lowest correlation with each of the EQ-5D-5L domains (Table 4).
Summary of Correlations QLU-C10D and EQ-5D-5L at Index and Domain Level, for Baseline, t2, and t3
Minimal correlations across the three measurement timepoints.
Maximal correlations across the three measurement timepoints all correlations >0.196 are statistically significant with p ≤ 0.005.
ICC, Intra Class Correlations; t1, Baseline, t2 and t3, subsequent timepoints after Baseline; QLU-C10D and EQ-5D-5L Country value sets: AUS, Australia, CAN, Canada, GER, Germany, ESP, Spain, ITA, Italy, JAP, Japan, UK, United Kingdom.
Detailed correlations are reported in the Supplementary Data S1.
Further, investigating the agreement between the QLU-C10D and EQ-5D-5L utility values, Bland-Altman plots display the difference of utility values plotted against the mean of the utility values. The mean difference of utility values ranges from −0.015 for the Italian value set to −0.186 for the Australian value set. The mean of QLU-C10D utilities was always lower compared to the utilities derived by the EQ-5D-5L. Mean differences for the Australian (−0.186) and the UK (−0.139) exceeded the pre-defined threshold (MID) of acceptable systematic measurement difference. For all country-specific value sets, in the upper measurement continuum of the instruments (above 0.8), the discrepancy between the measures appears to become smaller, indicating proportional bias. Figure 2 (A) displays the range of the level of agreement across the various country-specific value sets.
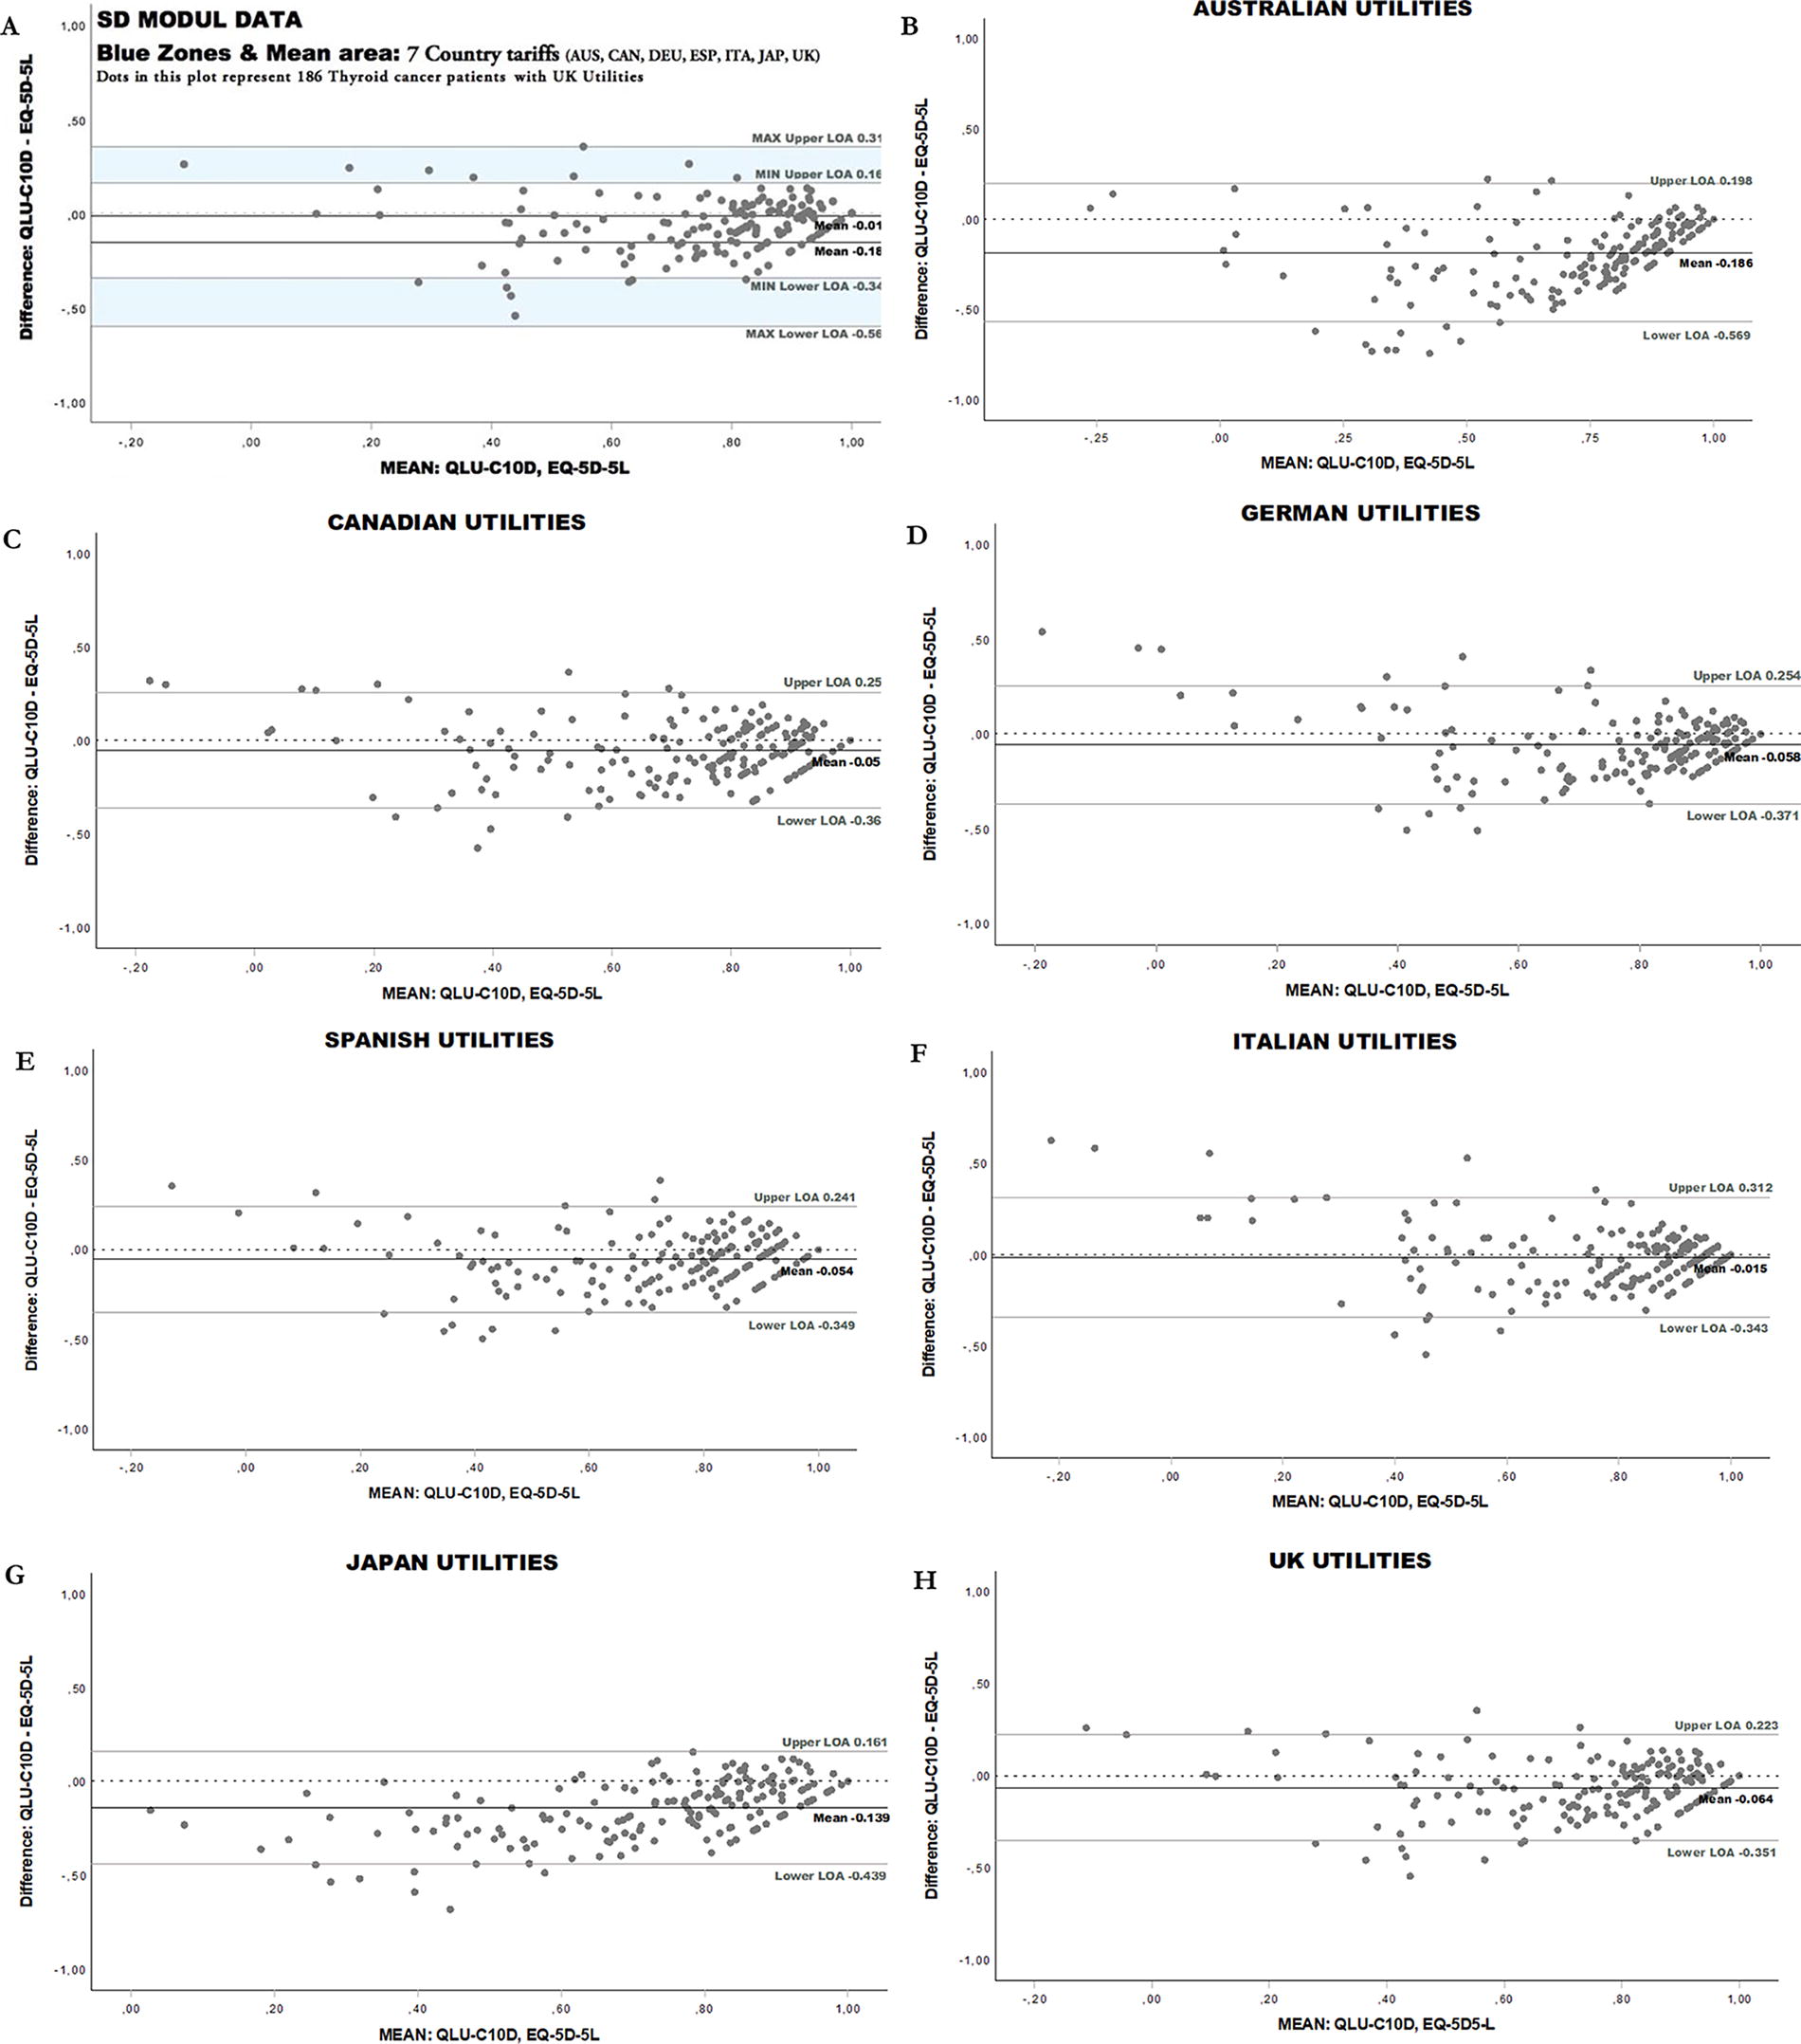
Bland–Altman Plots-QLU-C10D and EQ-5D-5L country-specific value sets at baseline. Figure 2A shows an overview of minimal and maximal level of agreement above and below the mean difference area of all country-specific value sets. The mean difference area of all country-specific value sets is plotted along with the zero-difference line, indicating that all mean differences are below, and hence QLU-C10D mean utilities are lower than EQ-5D-5L in all comparisons. Dotted line: y-axis = 0.00 (indicating no difference between both measures) LOA = Level of Agreement.
Known-group comparisons showed that 9 of 15 hypothesized known-group variables yielded statistically significant health state differences. For hormone withdrawal, neck dissection status, resection status, thyroidectomy status, treatment scheme, and UICC none of the instruments detected significant differences.
In total 54 RE indices were calculated with t-values of group differences of histology results (RE >1.17), hypoparathyroidism status (RE >0.93), Karnofsky groups (RE >0.87), lymphatic invasion (RE >1.13), psychological disorders (RE >0.97), disease status (RE >0.98), vocal cord impairment (RE >0.75), VAS score (RE >1.15) and GHS score (RE >1.23). Thirty-nine of these (=72.2%) favored the QLU-C10D, i.e., this measure showed higher efficiency in detecting group differences in most comparisons. Groups based on vocal cord impairment and Karnofsky performance state, as well as the Japanese and Canadian country value set, frequently favored the EQ-5D-5L (see Fig. 3A). Differences of known group comparisons showed frequently large divergence for Australian and Japanese country value set pairs, while Canadian, German and Italian pairs showed small divergence. Detailed results are presented in the Supplementary Table S2.

Head-to-Head Comparison of the Relative Efficiency (RE).
Responsiveness for the total sample over three time periods yielded no significant results. Difference in change between VAS groups, GHS groups and QoL groups yielded significant results at all timepoints with all country-specific value sets. RE favored QLU-C10D in 46 of 56 cases (82.1%). RE indices for responsiveness to HRQoL improvement favored the EQ-5D-5L for VAS between t1 and t2 and t2 and t3, and at QoL groups between t2 and t3. Responsiveness for GHS improvement favored QLU-C10D at all three timepoints. RE favored QLU-C10D in 25 of 49 comparisons (51.0%) at HRQoL improvement. Decreasing HRQoL groups yielded no significant results at VAS between t2 and t3, and at GHS between t1 and t3. RE indices for decreasing HRQoL favored the QLU-C10D in all cases (35 of 35), i.e., VAS score (t1 and t2, t1 and t3), GHS score (t1 and t2, t2 and t3), and QoL. Together, in 106 of 140 (75.7%) responsiveness comparisons RE favored the QLU-C10D. AUS and GER yielded frequently highest RE, while JAP and CAN often showed the smallest RE. Effect size differences (DRI) ranged between 0.036 and 0.519 at the HRQoL decrease groups, and between 0.005 and 0.336 at the improved groups. Large differences were frequently observed for the QLU-C10D-EQ-5D-5L pairs for the value sets AUS and ITA, while smaller DRI occurred for the JPN value set.
Discussion
We performed a validation of the QLU-C10D according to the validity criteria for health status questionnaires,
34
whereby the psychometric approach deployed was in accordance with previous publications by the
From our results we conclude that the QLU-C10D is a suitable measure to estimate health state utilities in patients with thyroid cancer. The derived utility values are commonly lower compared to the utility values of the general population, which is in accordance with widely reported HRQoL data of this cancer population. 11 –14 The only exception was the utility values for Germany and the UK at the last timepoint, which exceeded those of the general population, echoing a similar finding previously reported by Thiagarajan et al. 75 when comparing HRQoL data of a thyroid cancer population to the German general population.
The QLU-C10D did not show any floor effects (at the pits state values) or ceiling effects (at the full health value of 1), thus the scale structure in the upper and lower end of the measurement continuum appears sufficient. The high correlation of the QLU-C10D and the EQ-5D-5L index scores suggest good criterion validity of the measure. Investigating the correlations at the domain level, the pattern suggests good construct validity of the QLU-C10D. Theoretically corresponding domain pairs, such as ‘Physical Functioning-Mobility’, ‘Role Functioning-Usual Activities’, ‘Social Functioning-Usual Activities’, ‘Emotional Functioning-Anxiety/Depression’, and ‘Pain-Pain/Discomfort’ showed moderate to high correlations. Conversely, theoretically distant domain pairs showed lower correlation coefficients. Still, the only theoretically corresponding domain pair that exceeded the threshold for high correlation was the Pain-Pain/Discomfort pair. The lower-than-expected correlation of the domain pair ‘Emotional Functioning-Anxiety/Depression may be explained by the higher prevalence of anxiety (included in the EQ-5D-5L) compared to depression 76 (included in both the EQ-5D-5L and the QLU-C10D) in patients with thyroid cancer. Despite this less-than-ideal psychometric finding, the content validity (as prerequisite of construct validity) of the QLU-C10D was recently judged to be more relevant to patients with cancer in comparison to generic PBMs. 77
Consistent with previous reports, 68,70 the QLU-C10D consistently estimated lower utility values compared to the EuroQOL measurement system. This may be because the QLU-C10D has more dimensions and hence more utility decrements than the EQ-5D-5L, but other factors such as differing valuation methods may also have been at play. Whatever the reason, the systematic difference must be taken into consideration when performing CUAs, and different PBMs were relied upon to assess treatment strategies. In such cases, methods to map, crosswalk, or link utility scores could possibly be applied. 78 Still the presence of systematic differences across the measurement continuum limits the comparability of EQ-5D and QLU-C10D scores, such that their scores are not interchangeable.
Most important for the psychometric validation of the instrument, the QLU-C10D was able to detect differences between clinical groups and health state changes over time in accordance with clinical data and expectations. In doing so, the QLU-C10D was more efficient compared to the EQ-5D-5L in most cases. As reported previously, 74 the QLU-C10D appears to capture deterioration of health states more effectively (all country-specific value sets showed higher REs for the QLU-C10D in the “deterioration” group) than for improving of health states (some country-specific value sets showed favorable REs for the EQ-5D-5L) in comparison to the EQ-5D-5L. Previous reports also indicate a limited responsiveness of the EQ-5D-5L in papillary thyroid cancer. 79
To date, the QLU-C10D’s psychometric properties have been studied in diverse patient groups and for various country-specific value sets. Investigated cancer entities include gastric cancer, 73 myelodysplastic syndrome, 68 metastatic melanoma, 80 Barrett’s and esophagus cancer 71 undergoing esophagostomy, 81 breast cancer, 82 neuroendocrine tumors, 83 and patients treated with Nivolumab. 74 In most cases, comparisons of the QLU-C10D were made against the EuroQOL measurement system, 68,71,73,74,80,81,83 with additional studies using the SF-6D 71 and the PROMIS preference score 82 as comparator measures. Moreover, many country-specific value sets (Australia, Austria, Canada, France, Germany, Italy, the Netherlands, Poland, UK, and USA) were employed for these psychometric evaluations. 68,71,73,74,80 –83 A summary of these findings stipulates that the QLU-C10D is able to detect differences in health state utilities across various clinical known groups such as therapeutic groups 73 and treatment modalities, 82 ECOG status, age, and comorbidities, 68 UICC stages, 82 and for patients with or without disease progression. 83 Furthermore, the QLU-C10D showed a good efficiency in detecting these differences 68,74 and health state changes over time. 74,81
The discussion regarding the use of generic and disease specific PBMs is not new. 84,85 While the advantage of generic PBMs lies in their applicability across diseases, the potential of disease specific instruments (such as the cancer-specific PBM, QLU-C10D) must not be disregarded. Further, QLU-C10D domains capture aspects of health which are highly relevant to cancer patients, 17 thus being able to account for health state changes relevant to both patients and their managing clinicians. Moreover, the measure appears to have satisfactory measurement properties specifically demonstrated here for patients with thyroid cancer. Lastly, this current validation-relying on the 5-level version of the EQ-5D-has shown, that the QLU-C10D detects known-groups and health state changes more efficiently than the generic measurement system despite having more answer categories than the QLU-C10D. This suggests that the measurement precision of the QLU-C10D may arise from a superior content validity 77 of this instrument for the cancer patient population.
We therefore argue that the QLU-C10D may be a suitable supplement, or in selected cases (within-disease assessments, clear contraindication of generic PBMs, scoping assessments of health state utilities in phase II trials) a substitute, for other generic PBMs. Deploying an instrument (if used as primary outcome) with enhanced efficiency in detecting health state differences/changes has the advantage of reducing the required sample size. 66 The use of a validated instruments in cancer clinical trials may ultimately influence the accuracy of study outcomes and thus impact clinical guidelines and the provision of certain medicines in daily clinical practice. Currently, the QLU-C10D is used as a measure of cost-effectiveness in various clinical cancer trials. The trials currently concern patient with skin-cancer (NCT06163820), older cancer patients (NCT05797727), or patients with brain metastasis (NCT06163820). Following, this validation of the QLU-C10D in patients with thyroid cancer, we suggest that this instrument may be used in future cancer clinical trials in patients with thyroid cancer.
Limitations
In this analysis we mainly rely on the assessments of European patients with thyroid cancer, only 20 patients included in this study were from non-European countries (Brazil and Japan). Further, while this study thoroughly investigated the psychometric properties of the QLU-C10D according to well-established criteria, QALYs were not calculated and a CUA was not performed. Estimating QALYs with the QLU-C10D and comparing them to the QALYs estimated by other PBMs has been done previously, 74,80,86,87 and informs the health economic field regarding the ultimate effect of using different PBMs when estimating utility values.
Conclusion
The QLU-C10D is a valid and fit-for-purpose PBM for health economic evaluations in patients with thyroid cancer. The instrument displayed good psychometric properties and was more efficient in detecting health state differences and changes than the EQ-5D-5L in over 75% of comparisons. Hence, the QLU-C10D may help to evaluate novel therapeutic strategies and adjunct technologies to reduce treatment-related morbidities in patients with thyroid cancer in terms of their cost-utility.
Footnotes
Authors’ Contributions
Conceptualisation: E.M.G., M.T.K., R.N., S.Se., M.J.P. Acquisition of data: S.Si., G.I., G.P.S., J.I.A., O.H., I.I., G.F., D.F., J.I., N.K., L.D.L., M.P., R.R.G. Anlysis and interpretation of data: S.Se., M.J.P., E.M.G., M.T.K., S.Si. Drafting of the article: M.J.P., S.Se., E.M.G.. Critical revision of the article: S.Si., G.I., G.P.S., J.I.A., O.H., I.I., G.F., D.F., J.I., N.K., L.D.L., M.P., R.R.G., M.T.K., R.N. Statistical analysis: S.Se. Provision of study materials or patients: S.Si., G.I., G.P.S., J.I.A., O.H., I.I., G.F., D.F., J.I., N.K., L.D.L., M.P., R.R.G. Obtaining funding: E.M.G. Administrative, technical, or logistic support: M.T.K., R.N., S.Si. Supervision: E.M.G., S.Sl. All authors have read and approved the article.
Author Disclosure Statement
The authors have no conflict of interest to declare.
Funding Information
This work was supported by an EORTC grant (#12/2016). The EORTC Quality of Life Group business model involves charges for commercial companies using EORTC instruments. Academic use of EORTC instruments is free of charge.
Supplementary Material
Supplementary Data S1
Supplementary Table S1
Supplementary Table S2
Supplementary Table S3
Supplementary Table S4
Supplementary Table S5
Supplementary Table S6
Supplementary Table S7
Supplementary Table S8
Supplementary Table S9
Supplementary Table S10