




Abstract
Background:
The incidence of asymptomatic thyroid nodules has risen enormously, with > 90% being benign. Despite limited long-term data, significant nodule growth (SNG) is common. Guidelines recommend cytology reevaluation if SNG occurs. Our study aimed to identify the rate and factors associated with SNG, compare diameter and volume-based assessments, and examine the association between SNG and malignancy risk over the long term (10 years).
Methods:
The retrospective cohort study, conducted at Ankara University, School of Medicine, Department of Endocrinology and Metabolism, included 732 nodules from 376 euthyroid patients, all monitored over a 10-year period by the same experienced sonographer, with evaluations at baseline, 5th and 10th years. The nodules were cytologically benign and/or sonographically in the low-to-intermediate risk category. Size changes at the 5th and 10th years were considered significant if there was a 20% or 2 mm increment in two diameters according to diameter-based criterion (DBC) or 50% increment in volume-based criterion (VBC) designed by the ellipsoid formula. Generalized linear mixed-effects models were used to account for the clustered data structure and analyze factors affecting nodule growth. Nodule growth was the dependent variable, while sex, age at diagnosis, initial TSH level, total nodule count, nodule volume, echogenicity, and localization were independent variables.
Results:
At the 5th and 10th years, SNG frequencies were higher when calculated using VBC [27.7% (n = 203) and 44% (n = 321), respectively] compared with DBC [19.1% (n = 140) and 35% (n = 256), respectively], with the differences being statistically significant (McNemar test, p < 0.01). Factors associated with SNG included being younger than 45 years of age (VBC OR = 1.704, CI = 1.227–2.366, p = 0.002; DBC OR = 1.913, CI = 1.379–2.656, p < 0.001), having higher number of nodules (VBC: OR = 1.171, CI = 1.061–1.291, p = 0.002; DBC: OR = 1.147, CI = 1.040–1.265, p = 0.006), and having smaller nodule volume (VBC: OR = 0.870, CI = 0.806–0.940, p < 0.001; DBC: OR = 0.912, CI = 0.850–0.978, p = 0.010). Thyroid cancer was diagnosed in four original nodules (0.5%), whereas the malignancy rate in biopsies performed was 1.4% (n = 4).
Conclusions:
In long-term follow-ups of sonographically and/or cytologically benign thyroid nodules, SNG is not rare. Growth is more likely in younger patients, those with higher number of nodules and smaller nodules. In the follow-up of nodule size, VBCs yield augmented results compared with DBCs. However, malignancy is quite rare in growing nodules. Therefore, adopting flexible long-term follow-up protocols appears to be practical for benign nodular thyroid disease.
Introduction
The frequency of asymptomatic thyroid nodules has increased with the widespread use of thyroid ultrasound (US). 1,2 More than 90% of these nodules are cytologically benign or sonographically nonsuspicious. 3,4 Using TIRADS classifications, the risk is determined based on sonographic features, and the indication for fine needle aspiration biopsy (FNAB) is established. 5,6 However, due to insufficient data on the natural course of cytologically proven benign or sonographically nonsuspicious nodules, there is no consensus on follow-up. The American Thyroid Association (ATA) suggests that benign nodules >1 cm in diameter should undergo a follow-up sonographic assessment within 1–2 years after the initial evaluation. If the size remains stable, further analysis could be considered every 2–3 years thereafter. 6 The more recent European Thyroid Association (ETA) guideline has extended the follow-up period for these nodules to 3–5 years. 5 When significant growth appears during follow-up, both the ATA and the ETA suggest repeating FNAB, or continuing observation with repeated ultrasound (US), followed by re-biopsy if nodule growth persists. 5,6 However, with increasing evidence that nodule growth is not a reliable predictor of malignancy, there are publications suggesting that even less intensive follow-up protocols could be established. 7,8 The most comprehensive data on the natural course of benign nodules is based on Durante et al.’s 5-year prospective study, where authors demonstrated that 15.4% of asymptomatic, sonographically or cytologically benign thyroid nodules exhibited a significant nodule growth (SNG) during 5 years of follow-up, and thyroid cancer was very rare. To our knowledge, longer-term prospective or retrospective follow-up data are still quite limited in the literature, with only a single retrospective 10-year follow-up study available. 9
Our study aimed to retrospectively determine the natural course of cytologically benign and/or sonographically non-suspicious nodules during longer-term follow-up. We also studied the factors associated with nodule growth, tried to identify the differences between the diameter- and volume-based assessments of nodule growth, and examined the relationship between nodule growth and the risk of malignancy.
Methods
Study population and inclusion criteria
In this single-center retrospective cohort study, conducted at the Department of Endocrinology and Metabolism, Ankara University School of Medicine, Ankara, Turkey, we included euthyroid patients >16 years who underwent thyroid US and biochemical evaluations. The US risk assessment was based on the European Thyroid Imaging and Reporting Data System (EU-TIRADS). US findings categorized as low to intermediate risk were defined as EU-TIRADS II, III, and IV. For evaluations performed before the publication of EU-TIRADS risk stratification in August 2017, decisions were based on the clinical and sonographic risk assessments of three operators (M.F.E., S.G., and R.E.), each with over 20 years of experience in thyroid US. The absence of classical risk factors in the medical history, along with the lack of classical suspicious ultrasonographic criteria—such as microcalcifications, hypoechoic appearance, and irregular borders, which were described before 2017—were the usual exclusion criteria for malignancy.
Inclusion criteria were defined as follows: having nodules classified as low to intermediate risk on US, either with an initial benign cytology result or where biopsy was not indicated, having undergone thyroid US and thyroid function tests at baseline (T0), and in the 5th (T5) and 10th (T10) years at our institution; being followed by the same sonographer for 10 years. For T5 and T10 assessments, the evaluations were required to be conducted within a specific time window: T5 was within 5 years ±3 months and T10 within 10 years ±3 months. Only patients who had all of their T0, T5, and T10 assessments performed at our institution were included in the study.
In the EU-TIRADS classification for heterogeneous nodules (characterized by variable echogenicity, such as the presence of hypoechoic and isoechoic areas), the presence of any hypoechoic tissue classified the nodule as intermediate risk (EU-TIRADS-4). Our study includes patients who underwent their first US evaluations between 2004 and 2013, with a subsequent 5-year and 10-year evaluation conducted at the same tertiary center. The final US evaluations of the patients were performed between 2014 and 2023. Data were collected from electronic and manual medical records. Due to retrospective design of the study, informed consent was not obtained from the patients. The study was approved by the Ethics Committee of Ankara University (Project number: 2021/235) and performed according to the ethical standards of the Declaration of Helsinki as revised in 2013.
Early morning TSH, free T4 levels, anti-thyroid peroxidase antibodies (TPO Ab) and anti-thyroglobulin antibodies (Tg Ab) were measured at T0, T5, and T10 for all included patients. Serum-free T4 (FT4, Beckman Coulter 33880, reference range 7.00–15.96 pmol/L), serum TSH (Beckman Coulter B63284–Access TSH 3rd IS, reference range 0.38–5.33 μIU/ml), TPO Ab (Beckman Coulter A12985–reference range 0–34 IU/ml), and Tg Ab (Beckman Coulter A32898 –reference range 0–4 IU/ml) were measured.
Exclusion criteria were defined as follows: thyroid dysfunction (out-of-reference values at any of T0, T5, or T10), thyroid autoantibody positivity (a value above the upper limit of the reference range at any of T0, T5, or T10), sonographic evidence of chronic autoimmune thyroiditis (it was determined by the classical definition of a hypoechoic, heterogenous pattern of the thyroid parenchyma 10 ) history of surgical or nonsurgical thyroid interventions (thermal or ethanol ablation), using levothyroxine or anti-thyroid drugs currently or in the past medical history, presence of more than five or confluent nodules that are difficult to interpret sonographically, nodules <4 mm and >40 mm in longest diameter, and nodules with radiological or clinical signs of compression.
The participant flow diagram is presented in Figure 1.
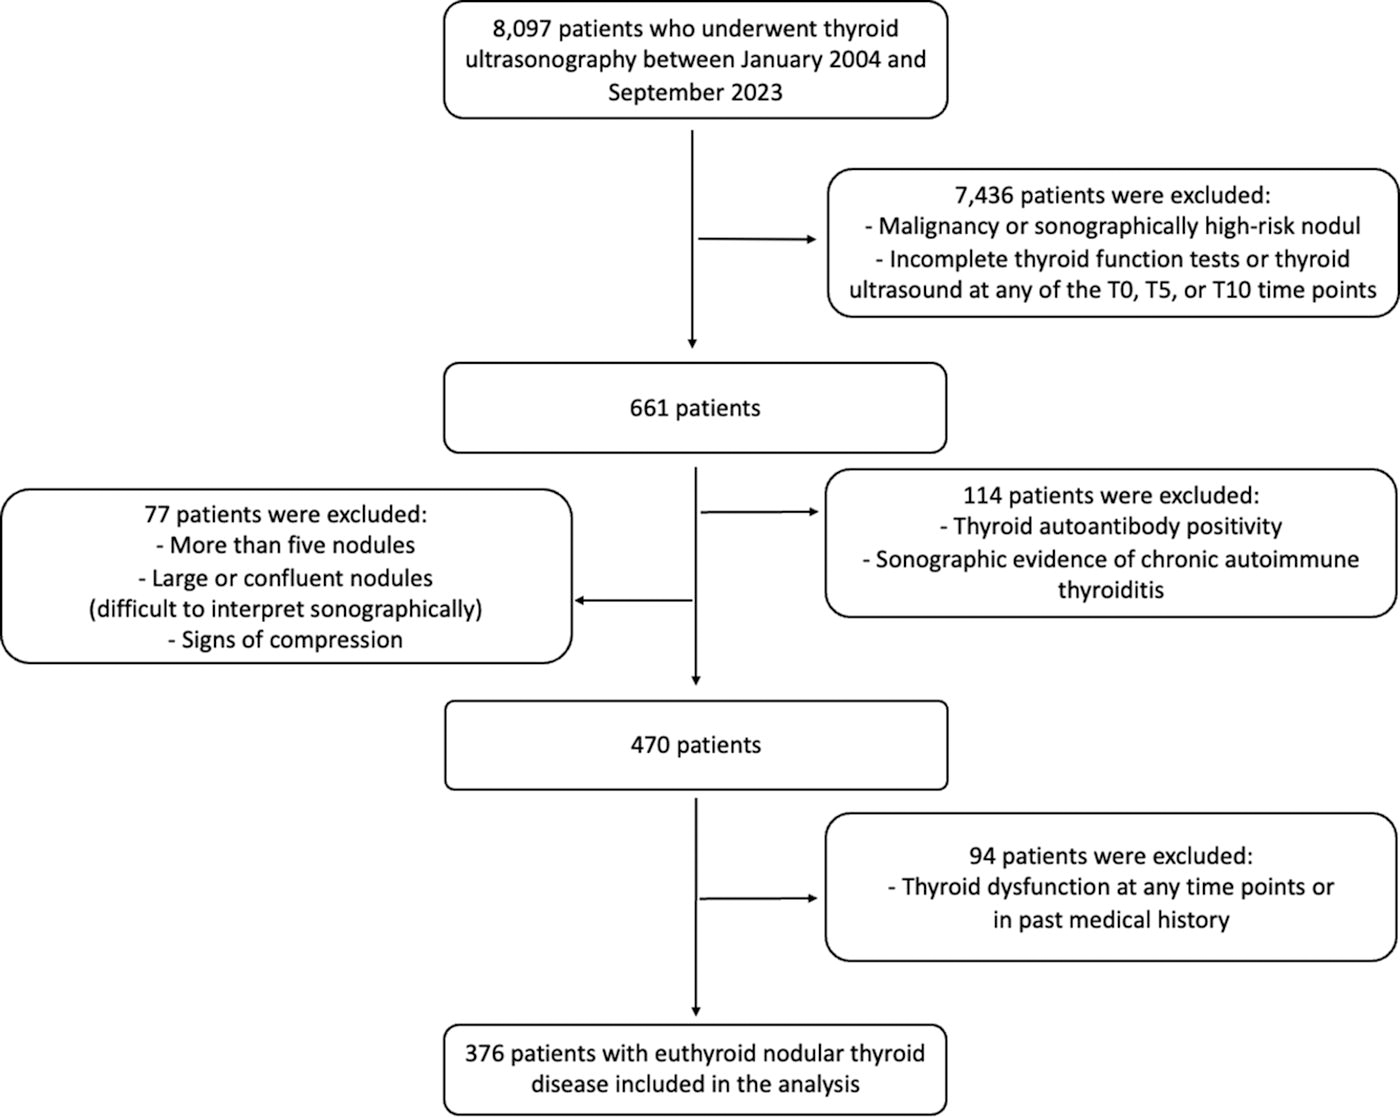
The participant flow diagram. T0: baseline, T5: 5th year, or T10: 10th year.
Protocol
The demographic characteristics of the patients, serum TSH levels, number of nodules, nodule volumes, nodule echogenicity [isoechoic, hypoechoic, hyperechoic, heterogeneous (iso-hypo)], nodule localizations (axial: right lobe, left lobe, isthmus, longitudinal: upper third, middle third, lower third), and nodule compositions [solid, mixed (solid dominant/cystic dominant)] were recorded. The sizes of the nodules at T0, T5, and T10 were recorded. Biopsy or re-biopsies performed during the follow-up period and their results were recorded.
Thyroid US was performed in all cases with either one of the machines below: General Electric® Logiq S5 Expert machine equipped with 4.5–13 MHz linear transducer and ESAOTE MyLab Twice machine equipped with 3–13 MHz linear transducer.
SNG or shrinkage was evaluated separately according to two different criteria. 5,6 First, an increase or decrease of >50% in nodule volume according to the ellipsoid formula [i.e., length (a), width (b), and height (c) of the nodules were measured, and the volume of each nodule was calculated using the ellipsoid formula (V = a * b * c * π/6)], 11 designated as volume-based criterion (VBC). Second, an increase or decrease of ≥20% in at least two nodule diameters and a minimum increment or decrement of 2 mm was designated as diameter-based criterion (DBC). According to VBC, SNG/shrinkage was defined as at least a 50% increase/decrease in volume, while changes of <50% in volume were considered stable. According to DBC, an increase/decrease of ≥20% in at least two nodule diameters and a minimum increase/decrease of 2 mm was considered significant growth/shrinkage. Changes that did not meet these criteria were considered stable. The same definition of significant nodule size change was used at both T5 and T10. In the 10-year analyses, T0 and T10 were compared based on this change criterion, while in the analysis where the first and second 5-year periods were evaluated separately, T0-T5 and T5-T10 were compared.
For categorical analyses, nodule volume will be classified as smaller or greater than/equal to the median nodule volume, and the largest nodule diameter will be classified as smaller or greater than/equal to 10 mm for analysis.
Statistical analysis
Statistical analysis was performed using SPSS version 22.0 (SPSS Inc., Chicago, IL, USA). Data are given as mean ± standard deviation or median (minimum–maximum) for continuous variables according to normality of distribution, and as frequency (percentage) for categorical variables. Normality assumption was tested by the Kolmogorov–Smirnov test with Lilliefors Significance Correction. Normally distributed variables were analyzed with the independent samples t-test. Non-normally distributed variables were analyzed with the Mann–Whitney U test. Because of multiple measurements from the same patient, to account for the clustered structure of the data, generalized linear mixed-effects models were used to analyze factors that affected nodule growth. The variables at p < 0.25 in univariate analysis were included in the generalized linear regression. Presence of nodule growth was the dependent variable. Sex, age at diagnosis, initial (T0) TSH level, total number of nodules, nodule volume, nodule echogenicity, and nodule localization were independent variables in the generalized linear mixed-effects model to detect their effects on nodule growth. The Bonferroni correction was applied to control Type I error rate. A p value below 0.05 was considered statistically significant.
Results
Baseline sample characteristics
A total of 732 nodules from 376 patients were included in the study. The mean age of the patients was 49 ± 12.3 years, with 83% being female. At the baseline, solitary nodules were present in 30% (n = 112) of cases: 43% (n = 314) of nodules were isoechoic, 24% (n = 174) were hypoechoic, 26% (n = 192) were heterogeneous (iso-hypoechoic), and 7% (n = 52) were hyperechoic; 13% (n = 94) of nodules were located in the upper third, 51% (n = 376) in the middle third, and 36% (n = 263) in the lower third of the lobes.
The median nodule volume was 0.41 (min-max = 0.03–28.24) mL. The median largest nodule diameter was 11 (min-max= 4–40) mm; 38.1% (n = 279) of the nodules had a maximum diameter <1 cm. The median TSH and free T4 were 1.45 (0.46–5.22) μIU/mL and 12.44 (9,19–15.79) pmol/L, respectively; 42% of nodules (n = 304) were solid. Of the nodules, 10.4% (n = 76) were classified as EU-TIRADS 2, 39.6% (n = 290) as EU-TIRADS 3, and 50% (n = 366) as EU-TIRADS 4. The median largest nodule diameters were 10 mm (5–40 mm) for EU-TIRADS 2, 12 mm (4–40 mm) for EU-TIRADS 3, and 11 mm (4–40 mm) for EU-TIRADS 4 nodules; 207 (28.2%) nodules corresponding to 176 patients were classified as benign based on cytological findings. In the remaining 525 nodules, the exclusion of malignancy was based on the absence of suspicious US features, lack of indication for FNAB according to EU-TIRADS criteria or the decision of an experienced operator before 2017. Of the 207 nodules with initial FNAB, 40.1% (n = 83) were classified as EU-TIRADS-3 and 59.9% (n = 124) as EU-TIRADS-4. Of the 525 nodules without initial FNAB, 14.3% (n = 75) were classified as EU-TIRADS 2, 39.6% (n = 208) as EU-TIRADS 3, and 59.9% (n = 124) as EU-TIRADS 4. No difference was observed between the groups with and without FNAB in terms of the distribution of EU-TIRADS-3 and EU-TIRADS-4 nodules (p = 0.142). The median largest nodule diameter of nodules with initial FNAB was 20 mm (15–40), while of nodules without FNAB, it was 9 mm (4–40) (p < 0.001).
According to VBC, the baseline median largest nodule diameter of nodules that grew at T10 was 10 mm (range: 4–40 mm) and the median volume was 0.26 mL (range: 0.03–21.65 mL). The baseline median largest nodule diameter of nodules that shrank at T10 was 13 mm (range: 5–40 mm) and the median volume was 0.67 mL (range: 0.04–27.61 mL). The baseline median largest nodule diameter of stable nodules at T10 was 12 mm (range: 4–40 mm) and the median volume was 0.51 mL (range: 0.03–28.24 mL).
Nodule growth frequencies and associated factors
Frequency of SNG in patients aged ≤45 years is higher than in those >45 years of age (p < 0.001). The nodules with a volume >0.41 mL have a higher frequency of SNG than larger ones (p < 0.001). The frequency of SNG is higher in nodules with a maximum diameter of <10 mm compared with those with a maximum diameter of ≥10 mm (p < 0.001). Nodules without an initial FNAB have a higher frequency of SNG compared with those with an FNAB (p < 0.001). There is no difference in the frequency of SNG according to sex, echogenicity, structure, localization of the nodule or EU-TIRADS classification (p > 0.05) (Table 1).
Frequency of Significant Nodule Growth in 732 Nodules from 376 Patients During 10 Years Follow-Up According to Clinical and Sonographic Criteria
SNG, significant nodule growth; VBC, volume-based criterion; DBC, diameter-based criterion.
According to VBC, the frequency of SNG, for all nodules, at T5 was 27.7% (n = 203) and 43.9% (n = 321) at T10 (Fig. 2). However, by using DBC, the frequency at T5 and T10 was 19.1% (n = 140) and 35% (n = 256), respectively. According to VBC, in nodules <1 cm, the frequency of SNG at T5 and T10 was 37.3% (n = 104) and 54.1% (n = 151), respectively, while in nodules ≥1 cm, it was 21.9% (n = 99) and 37.7% (n = 171), respectively. According to DBC, in nodules <1 cm, the frequency of SNG at T5 and T10 was 22.6% (n = 63) and 38.7% (n = 108), respectively, while in nodules ≥1 cm, it was 17% (n = 77) and 32.7% (n = 148), respectively. In both time intervals, the frequency of SNG for nodules <1 cm was significantly higher than nodules ≥1 cm according to VBC (p < 0.001 for T5 and T10), while it showed a trend of being higher according to DBC (p 0.06 for T5 and p 0.09 for T10).For both T5 and T10, the SNG frequencies calculated using VBC were significantly higher compared with those calculated using DBC (McNemar test, p < 0.01).

Distribution of volume changes in thyroid nodules during 5 and 10 years of follow-up with regard to volume-based criterion (VBC). Definitions. Growing: At least a 50% increase in volume. Stable: No change in volume or a change of <50%. Shrinking: At least a 50% decrease in volume.
Figure 3 shows that the growth pattern in the second 5 years was significantly different from the first 5 years (McNemar–Bowker test, p = 0.027). It was observed that 44% (n = 90) of nodules that grew in the first 5 years continued to grow in the second 5 years. Additionally, it was observed that 19% of initially stable nodules and 19% of shrinking nodules in the first 5 years grew in the second 5 years of follow-up.

Thyroid nodule volume changes in the timeline diagram.
Factors associated with for nodule growth by using both calculation criteria were studied and given in the Table 2. Age ≤45, smaller nodule volume, smaller largest nodule diameter, and a higher total number of nodules were identified as factors associated with SNG (Table 2).
Univariate Analysis for Factors Associated with the Nodule Growth over a 10-Year Follow-Up
VBC, volume-based criterion; DBC, diameter-based criterion; OR, odds ratio; CI, confidence interval; TSH, thyrotropin; T0, 0th year.
The generalized linear mixed-effects models analyses revealed that, independent of initial TSH levels, being ≤45, having a higher total number of nodules, and lower nodule volume are significant factors associated with nodule growth >10 years of follow-up (Table 3).
Generalized Linear Mixed-Effects Models Analysis for Associated Factors with the Nodule Growth over a 10-Year Follow-Up
VBC, volume-based Criterion; DBC, diameter-based Criterion; OR, odds ratio; CI, confidence interval.
Diagnosis of thyroid cancer during follow-up
During follow-up, biopsies were performed on 287 nodules, 283 of which resulted as Bethesda II. Of the 283 nodules, 102 had an initial benign FNAB result. Among these 102 nodules, 2 underwent biopsy due to the appearance of suspicious US findings, 23 due to growth, and the remaining 77 underwent biopsy because the clinician wanted to rule out the probable false-negative results of the initial biopsy and confirm a second benign biopsy during follow-up. Of the 181 nodules without an initial FNAB, 4 underwent biopsy due to suspicious US findings, 82 due to growth, and the remaining 95 were biopsied because the clinician preferred to perform FNAB due to millimetric changes in size, despite no significant growth.
Thyroid cancer was diagnosed in four (0.5%) original nodules. Two nodules with Bethesda II initial cytology, which were re-biopsied, had a final cytopathological diagnosis consistent with Bethesda VI (i.e., PTC). Out of growing nodules; one was reported as Bethesda IV, and the thyroidectomy resulted as follicular subtype of PTC. Out of the nodules with the appearance of suspicious US features, one was reported as Bethesda V and thyroidectomy resulted as classical subtype of PTC. In one patient, a recently developed millimetric, EU-TIRADS 5 pattern was observed at the T5, and by the T10, it resulted in a diagnosis consistent with PTC, leading to surgical intervention. During the 10-year follow-up, total thyroidectomy was performed on ten patients due to recently developing compressive symptoms or developing multinodularity which made the follow-up difficult. In two of these cases, incidental micro PTCs (3 and 4 mm) was detected at thyroidectomy in ultrasonographically nonvisualized nodules.
Discussion
As far as we know, this is the largest study in the literature showing the 10-year natural course of benign thyroid nodules. Additionally, this is the largest study comparing volume-based and diameter-based evaluations in terms of growth criteria. Despite the retrospective design, the fact that each patient was followed by the same experienced sonographer for 10 years distinguishes our study from others, given that US is a highly operator-dependent technique.
In a 5-year prospective multicenter study conducted by Durante et al., SNG was observed in 15.3% of the nodules. 12 Another study from Italy, which included 677 nodules, reported 11.1% SNG in a 10-year follow-up. 9 In a smaller previous study using different criteria (i.e., >30% nodule volume increase), we reported a 24.1% SNG rate over a mean follow-up period of 40 months. 13 In the current study, SNG was detected in 27.7% and 43.9% of nodules over 5 and 10 years, respectively, according to VBC. By using DBC, SNG was observed in 19.1% and 35% of nodules over 5 and 10 years, respectively. Our higher frequency of growth can be due to the longer follow-up term of the study (i.e., 10 years) compared with shorter-term studies and iodine nutrition of our nation. Türkiye, formerly a severe to moderately iodine deficient country, became a borderline iodine sufficient region in 2007, 14,15 after the implementation of mandatory salt iodization initiated in 2000. Another important point is that the frequency of nodule growth was found significantly higher in VBC compared with DBC (i.e., 43.9% vs.35%). Moreover, the frequency of SNG detected by diameter-based analysis was more consistent with the literature when compared with volume-based assessment. Our results suggest that using volume-based assessment for comparing changes may lead to higher results, with regard to SNG, especially for nodules <1 cm in length. Brauer et al.’s study investigating interobserver variability in the determination of thyroid nodule sizes showed 21% for the diameter and up to 49% in volume. 16 Supporting this a Korean study that reported that the interobserver variation in volume was greater in smaller nodules (i.e., ≤2 cm) compared with larger ones. 17 In recent years, with the increase in active surveillance (AS) studies, DBCs and VBCs gained importance in the natural course of papillary thyroid cancers. 18 In a recent study published by Chung et al., authors tested the interobserver reproducibility in DBCs and VBCs during the follow-up of papillary microcarcinomas and recommended using 71.8% instead of 50% for volume and 23.7% instead of 20% for diameter. 19 In two of the most recent large studies, including those by Kim et al. and Tuttle et al., which investigate the volume kinetics of AS for thyroid cancer, this criterion has been accepted. 20,21 Although ours were benign nodules, we suggest to use diameter-based monitoring in the follow-up of thyroid nodule growth in general, especially for smaller nodules (<1 cm). In our study, the more frequent occurrence of SNG in smaller nodules when using a 50% cutoff may be due to the need for a higher cutoff in smaller nodules for better interobserver reproducibility.
We compiled several key articles examining the natural course of benign nodules in Table 4. 9,12,13,22 –28
Results of Previous Major Studies on the Natural Course of Benign Nodular Thyroid Disease
N/A, non-available.
In a prospective multicenter study conducted by Durante et al., male sex, multinodularity, and dominant nodule volume >0.2 mL were linked to nodule growth. However, individuals aged ≥60 years were associated with a reduced risk of growth. In a separate subgroup analysis focusing on women, the researchers identified positive correlations between nodule growth and multinodularity, larger nodule volumes, and nulliparity. They also reported that the patients with multinodular disease, the largest nodule diameter exceeding 7.5 mm, and those aged ≤45 had the highest risk of nodule enlargement during follow-up. 12 Xiang et al. recently conducted a similar prospective study, categorizing nodules as stagnant, slow, or fast-growing. They observed that fast growth was more prevalent among younger patients and nodules >2 cm. Their findings indicated no significant differences between sex or TSH levels among the three groups. 25 Correspondingly, we also demonstrated that younger age (especially ≤45 years) and multinodularity are associated with nodule growth. Furthermore, factors such as sex, structure, echogenicity, and nodule localization were not found to be associated with SNG in our study. In contrast to the aforementioned studies, we identified low nodule volume as a factor associated with nodule growth. This may be due to a selection bias since Xiang et al. included only ≥1 cm nodules, with a median nodule volume of 1.0 (0.5–3.3) mL. More than one third of nodules in our study were <1 cm, with an average nodule volume of 0.12 (0.03–0.89) mL. Although our study may not be as comprehensive as the previously mentioned studies in terms of larger nodules (≥1 cm), it may provide more detailed insights into the natural course of subcentimeter nodules. We also believe that it is difficult to rule out the influence of the fact that even small changes in the size of subcentimeter nodules can lead to proportionally larger differences, thereby increasing the likelihood of statistical significance in this group.
O’Connell et al. have shown that malignant nodules grew significantly more than benign ones (OR = 2.49). 29 Kuma Hospital’s data have shown that benign nodules, presenting SNG during follow-up have a very low risk of malignancy, although those identified as follicular neoplasia had a higher risk of malignancy. 30 However, data linking nodule growth and risk of malignancy are contradictory and the assumption that the risk of malignancy increases in growing nodules has not been sufficiently tested. In the limited number of studies examining the long-term natural course of benign nodules, SNG occurred at 15.4–61.2%, 12,13,23 although risk of malignancy in these nodules remained quite low during follow-up. Durante et al. showed patients with initially benign nodules had a mere 0.3% incidence of cancer rate over a 5-year follow-up period. 12 Similarly, we in a relatively old study, found a malignancy rate of 1.2% in re-biopsies performed to initially benign nodules due to SNG after a mean follow-up of 40 months. 13 In the review by Chou R et al., which examined ultrasound follow-up studies of cytologically benign thyroid nodules with very low to intermediate suspicion ultrasound patterns, ≥50% nodule growth was observed in 35% of cases during follow-up >4 years, while the malignancy rate was 0.4%. 31 A meta-analysis evaluating thyroid nodules in 2743 patients similarly concluded that SNG during follow-up was not a successful parameter in distinguishing thyroid cancer. 7 Grani et al. detected no malignancy during the 5-year prospective follow-up of 432 asymptomatic, radiologically or cytologically benign nodules in 232 patients. US-derived risk categories for low-intermediate risk nodules tended to stay relatively consistent and changes necessitating biopsy were quite rare. More relaxed protocols for initially benign nodules were suggested. 8 Our malignancy rate in the current study was also quite rare (0.5%) during the 10-year follow-up of initially benign nodules. In contrast, Kwak et al. showed that in initially cytologically benign nodules with suspicious US findings, the risk of malignancy reaches 56.6% in re-biopsies. 32 It is important to integrate US features with cytological data, rather than relying on nodule growth for repeating biopsy. 33 –35
In contrast to the limited prospective studies, in our 10 years retrospective follow-up study, we observed that the growth patterns of some nodules differed between the first 5 years and the subsequent 5 years. Some nodules that remained stable or shrank during the first 5 years exhibited growth in the second 5 years. We have not been able to definitively identify the reason for this. Growing nodules were mostly <1 cm; intraobserver differences, especially in volume-based assessment, could be kept responsible for some of these nodules. Latest nationwide iodine surveys showing that Türkiye was a borderline iodine-deficient area took place in 2005. We have no recent monitoring data like most of the European countries, 36 which could mean iodine status may have worsened during the last decade, theoretically increasing the nodule size. Additionally, increased pollution and exposure to endocrine disruptors in recent years can also be considered possible explanations. 37,38 Limitations of this study include the retrospective design. Also, we have no data on smoking, obesity, type 2 diabetes, indications for the initial neck US and family history which might influence nodule growth. 39 –41 Additionally, since our study does not involve a prospective design with annual ultrasonographic follow-ups over the 10-year period, it was not possible to perform a continuous analysis of the 10-year data to identify different growth patterns (stagnant, slow, or fast-growing). 25 Furthermore, small changes in the size of nodules <1 cm can lead to larger differences in volume. Given the lack of a different cutoff for these small nodules in the guidelines, we considered a 50% change in volume as significant for these nodules in our study, which can be regarded as another limitation.
In the long-term follow-up of sonographic and/or cytological benign nodules, growth is commonly observed, especially in individuals under the age of 45 years, with low nodule volume, and in glands with high nodule count. For following up nodule size, diameter-based criterions are superior to volume, since VBC tends to produce exaggerated results. However, nodule growth very rarely indicates malignancy. Therefore, in benign nodular thyroid disease, it appears that there are more flexible long-term follow-up protocols. The current ETA guidelines recommended that nodules classified as EU-TIRADS 2 (5–10 mm) and EU-TIRADS 3 (<10 mm) require no further evaluation, while larger nodules (EU-TIRADS 2 >10 mm; EU-TIRADS 3 10–20 mm) and those classified as EU-TIRADS 3 (>20 mm) or EU-TIRADS 4 (>15 mm) with Bethesda II cytology should be re-evaluated every 3–5 years. 5 Our findings support the recommendations in the current ETA guidelines, which suggest that ultrasound follow-ups for sonographically low to intermediate risk and cytologically benign thyroid nodules can be performed every 3–5 years.
Footnotes
Authors’ Contributions
All the authors of the article fulfill the criteria for authorship, reviewed the final article and agree to be accountable for all aspects of the work. M.F.E. collected clinical data, methodology, conceived and supervised the project, writing of original draft, reviewing, and editing the article. A.B.B. contributed to conceptualization, methodology, investigation, data curation, statistical analysis, visualization, writing of original draft, and editing the article. A.H.E. did the statistical analysis and data interpretation. S.G. and R.E. collected clinical data and supervised the project.
Data Availability
Some or all datasets generated during and/or analyzed during the current study are not publicly available but are available from the corresponding author on reasonable request.
Author Disclosure Statement
None of the authors have any potential conflicts of interest associated with this research.
Funding Information
This research did not receive any grands from funding agencies in the public, commercial, or not-for-profit sectors.