
Abstract
Background:
Thyroid nodules are challenging to accurately characterize on ultrasound (US), though the emergence of risk stratification systems and more recently artificial intelligence (AI) algorithms has improved nodule classification. The purpose of this study was to evaluate the performance of a recent Food and Drug Administration (FDA)-cleared AI tool for detection of malignancy in thyroid nodules on US.
Methods:
One year of consecutive thyroid US with ≥1 nodule from Duke University Hospital and its affiliate community hospital (649 nodules from 347 patients) were retrospectively evaluated. Included nodules had ground truth diagnoses by surgical pathology, fine needle aspiration (FNA), or three-year follow-up US showing stability. An FDA-cleared AI tool (Koios DS Thyroid) analyzed each nodule to generate (i) American College of Radiology Thyroid Imaging Reporting and Data System (ACR TI-RADS) descriptors, scores, and follow-up recommendations and (ii) an AI-adapter score to further adjust risk assessments and recommendations. Four groups were then compared: (i) Koios with AI-adapter, (ii) Koios without AI-adapter, (iii) clinical radiology report, and (iv) radiology report combined with AI-adapter. Performance of the final recommendations (FNA or no FNA) was determined based on ground truth, and comparison between the four groups was made using sensitivity, specificity, and receiver-operating-curve analysis.
Results:
Of 649 nodules, 32 were malignant and 617 were benign. Performance of Koios with AI-adapter enabled was similar to radiologists (area under the curve [AUC] 0.70 for both, [CI 0.60–0.81] and [0.60–0.79], respectively). Koios with AI-adapter had improved specificity compared to radiologists (0.63 [CI: 0.59–0.67] versus 0.43 [CI: 0.38–0.48]) but decreased sensitivity (0.69 [CI: 0.50–0.83) versus 0.81 [CI: 0.61, 0.92]). Highest performance was seen when the radiology interpretation was combined with the AI-adapter (AUC 0.76, [CI: 0.67–0.85]). Combined with the AI-adapter, radiologist specificity improved from 0.43 ([CI: 0.38–0.48]) to 0.53 ([CI: 0.49–0.58]) (McNemar’s test p < 0.001), resulting in 17% fewer FNA recommendations, with unchanged sensitivity (0.81, p = 1).
Conclusion:
Koios DS demonstrated standalone performance similar to radiologists, though with lower sensitivity and higher specificity. Performance was best when radiologist interpretations were combined with the AI-adapter component, with improved specificity and reduced unnecessary FNA recommendations.
Introduction
Thyroid nodules are common in adults and are frequently identified as incidental findings on imaging studies, discovered as palpable abnormalities on physical exam, or found during clinical evaluation for other thyroid abnormalities. While their prevalence is high (19–68%), the vast majority of thyroid nodules are benign. 1 –3 Consequently, noninvasive characterization of thyroid nodules is critical to differentiate malignant nodules from their much more common benign counterparts. Ultrasound (US) is the primary imaging modality used for characterization, however differentiating between malignant and benign nodules on US remains challenging, as there is significant overlap between the appearance of benign and malignant nodules. 4 Overall specificity of US for identification of malignant thyroid nodules is low, which leads to a large number of unnecessary follow-up imaging, biopsies, and surgical procedures. 5,6
To help mitigate the challenges of low specificity and poor inter-observer agreement in thyroid US, societies around the world have created risk stratification systems (RSSs) to more algorithmically evaluate nodules on US. In the United States, the American College of Radiology Thyroid Imaging Reporting and Data System (ACR TI-RADS) is commonly used. 7,8 The ACR TI-RADS and other societal TI-RADS have been shown to improve specificity of nodule characterization with resultant decrease in the number of unnecessary fine needle aspirations (FNAs), however these RSSs are far from perfect and there is still room for improvement in thyroid nodule characterization. 9 –12
While thyroid RSSs have emerged over the past several years, there has been a concurrent rise in applications of artificial intelligence (AI) to improve thyroid nodule classification. Numerous AI algorithms have been shown to perform similar to or even better than clinical radiologists. 13 –15 As a result, several AI tools for thyroid nodule analysis have received Food and Drug Administration (FDA) clearance, including S-Detect 2 (Samsung Healthcare) and AmCAD-UT (AmCAD Biomed), both of which have been clinically evaluated and validated in multiple prior publications. 16 –20 Koios DS (Koios Medical) is one of the newest FDA-cleared AI tools. An initial study of Koios DS performed in collaboration with Koios Medical demonstrated promising results, with improved sensitivity and specificity for detection of malignancy, 21 and one of the first external validation studies also showed performance improvement across multiple readers using Koios. 22 However, additional evaluation with larger and more varied cohorts is still needed to fully assess the algorithm’s performance.
The purpose of this study was to use an independent dataset to evaluate the diagnostic performance of Koios DS for detection of malignancy in thyroid nodules on US. Specifically, we aimed to assess the performance of two core components of the software: the Koios nodule descriptor tool (which calculates risk using ACR TI-RADS criteria), and the more advanced AI adapter tool (which further adjusts risk beyond the TI-RADS features). We compared combinations of those components to clinical radiologist interpretations and also evaluated performance when the clinical radiologist interpretations were combined with the AI adapter score.
Materials and Methods
Study population
This retrospective study was institutional review board (IRB)-approved (Duke University IRB # 00081895, including waiver of informed consent) and Health Insurance Portability and Accountability Act compliant. The initial population included all consecutive adult (18 years or older) patients undergoing thyroid US over the course of 1 year (November 2018 to October 2019) at our tertiary academic medical center as well as our affiliated community hospital. Patients were included if they had definitive thyroid nodule characterization, including either surgical pathology results, FNA cytopathology results, or long-term stability on follow-up imaging. Benign nodules were defined by benign surgical pathology, benign cytology (Bethesda II), indeterminate cytology (Bethesda III and IV) with negative molecular testing (Thyroseq v2/v3 or Afirma GEC/GSC), or by 3-year stability on US imaging. All indeterminate nodules underwent molecular testing, with a negative result being considered sufficient to be considered benign without further US follow-up. Malignant nodules were defined by malignant surgical pathology or FNA cytology (Bethesda V or VI). A total of 989 consecutive patients were identified, of which 367 patients had additional thyroid nodule characterization. Patients with inadequate FNA samples (Bethesda I) or indeterminate FNA results (Bethesda III or IV) without further genetic testing were excluded (n = 14). Additional patients were excluded due to lack of discrete nodules on initial US (n = 4), inconclusive surgical pathology (n = 1), or nodule growth on follow-up thyroid US without further characterization (n = 1). This resulted in a final study population of 347 patients with 649 thyroid nodules (Fig. 1).
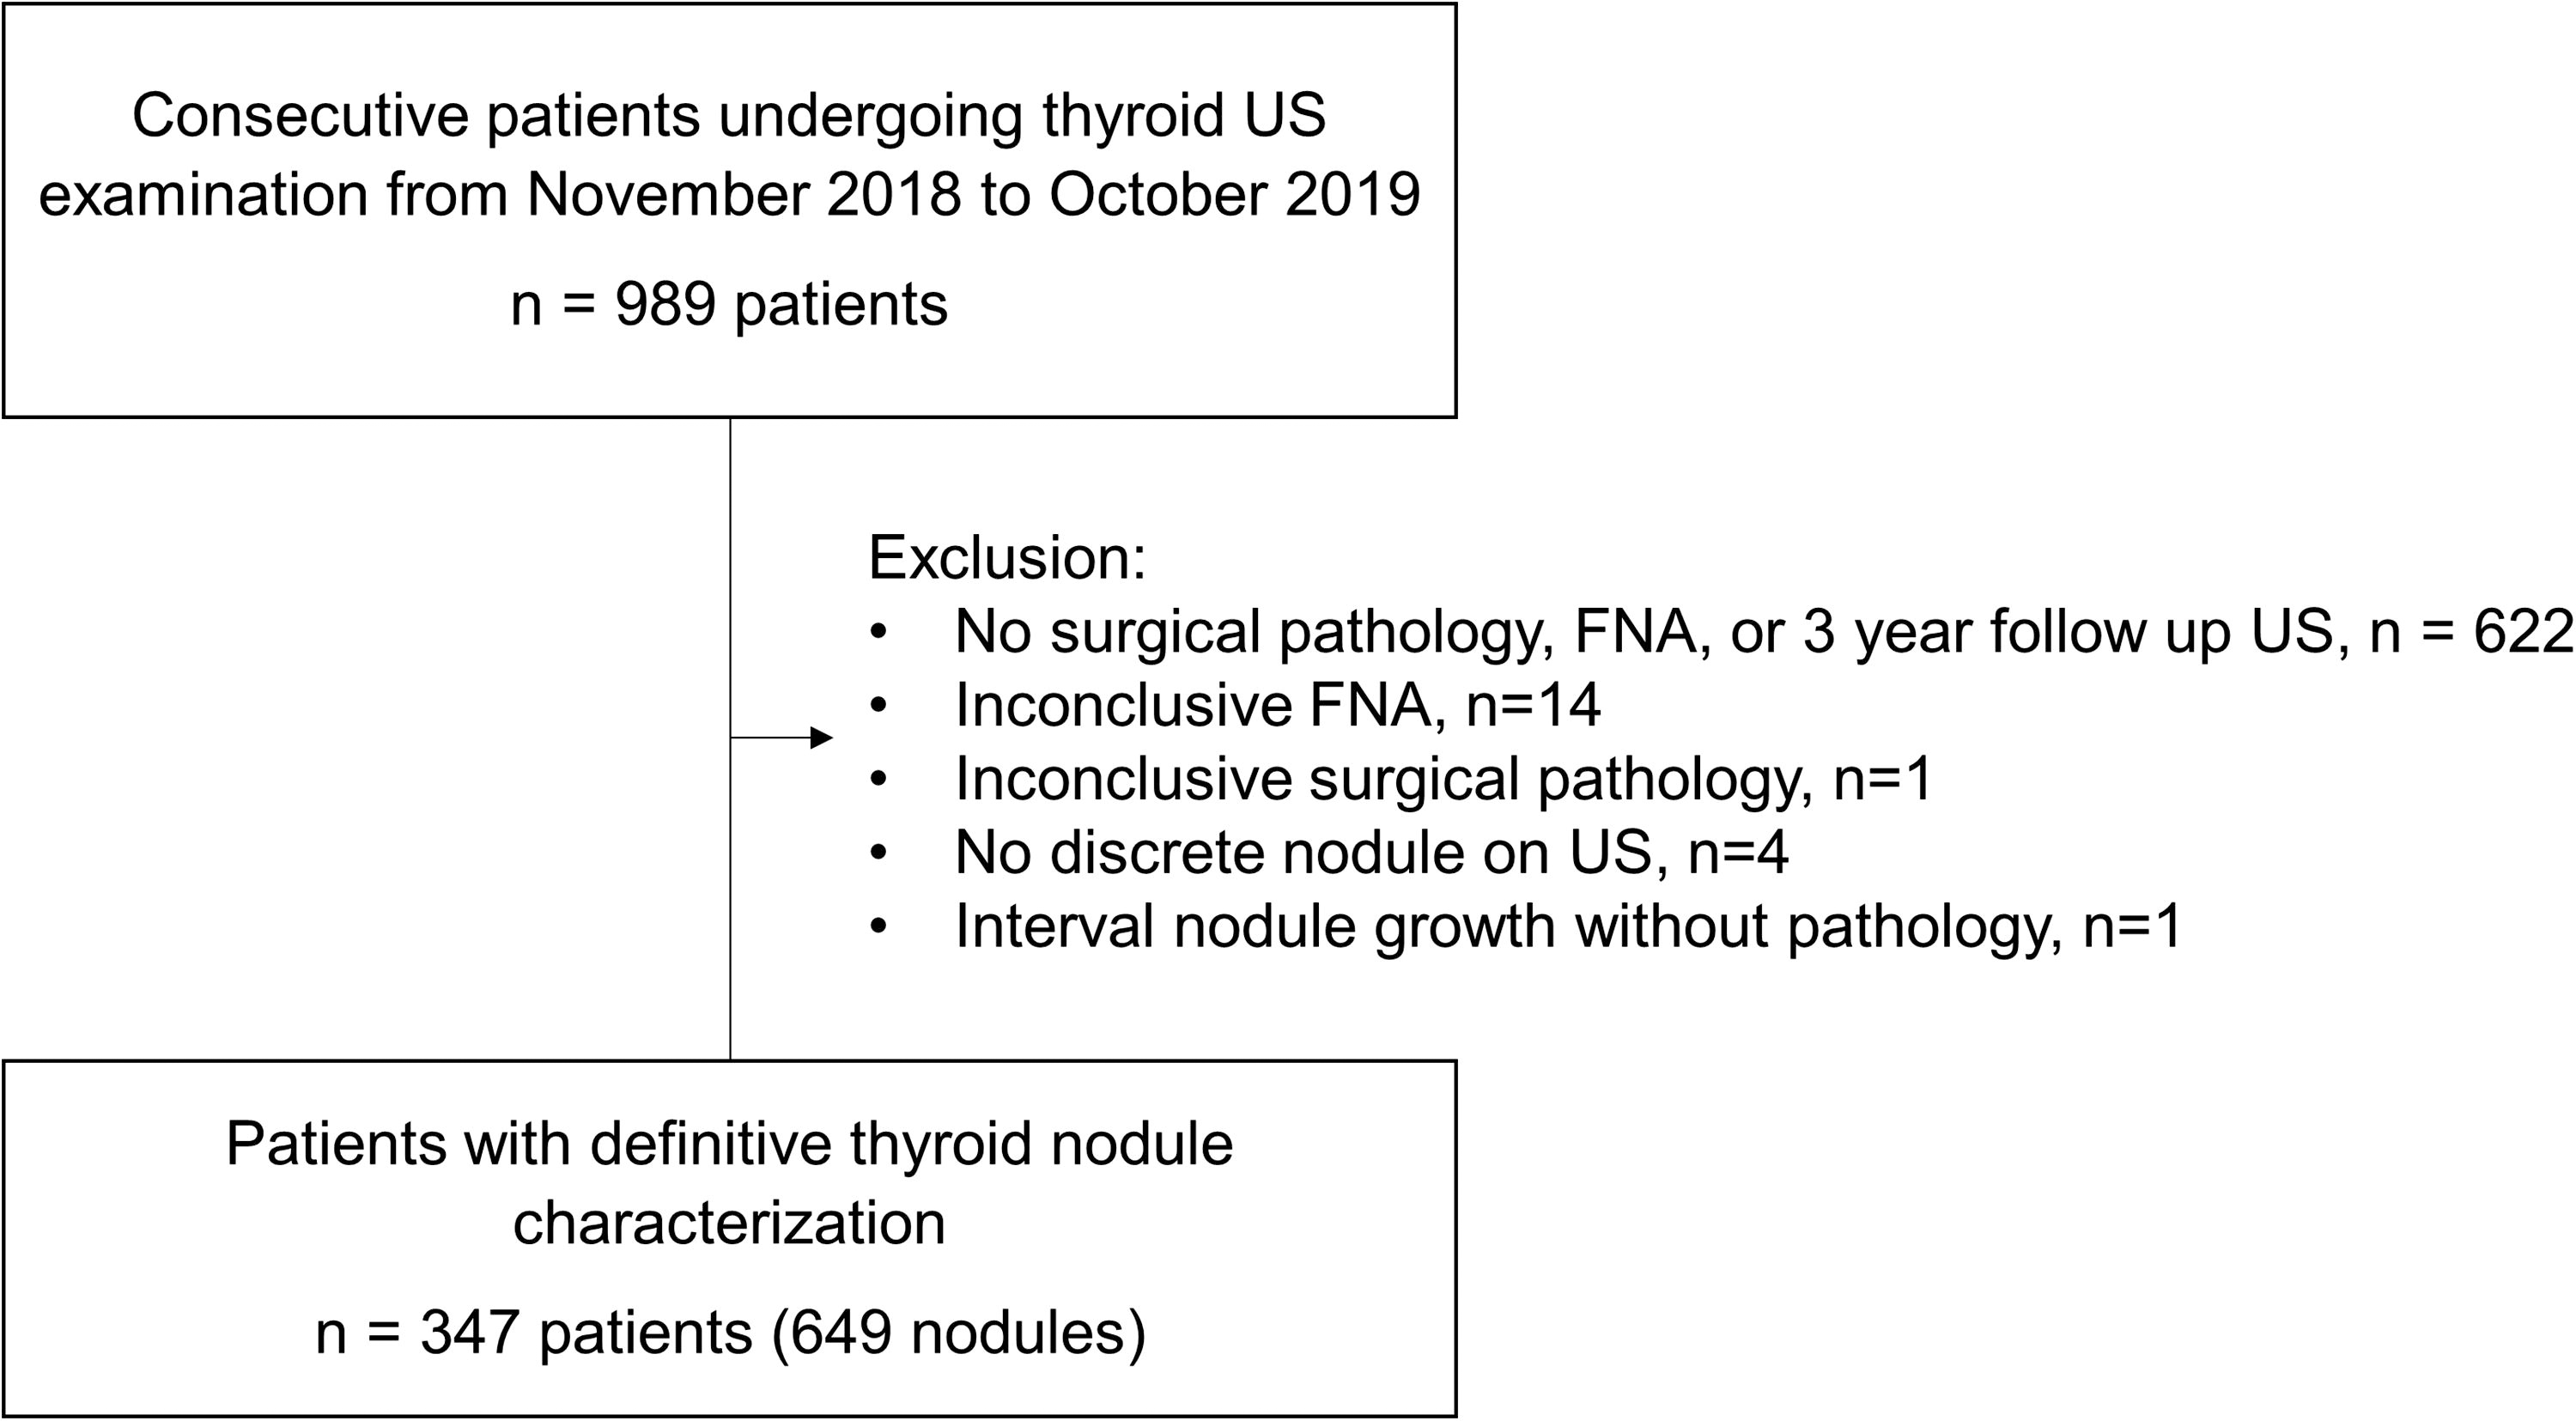
Study population flowsheet with exclusion criteria.
All US examinations were performed by trained sonographers using one of the commercially available US units in our fleet equipped with 5–15-MHz linear array transducers, including the Phillips IU22, Epiqs, and Epiqs Elite (Phillips Healthcare, Andover, MA).
US image analysis
Thyroid nodules were analyzed using Koios DS Thyroid, which was integrated with our institution’s imaging archive. A patient’s thyroid US images were loaded into the Koios software, a transverse and longitudinal image of each nodule were selected for analysis, and a radiologist drew a rectangular region of interest around the nodule margins. For consistency, the selected images were based on sonographers’ ‘central’ images of the nodule, images in which the sonographer subsequently placed their calipers for measurement. Koios then automatically selected nodule features according to the ACR TI-RADS lexicon, tallied a final TI-RADS score, and produced a TI-RADS recommendation (FNA, follow-up, or no follow-up). While TI-RADS feature assignments can be manually adjusted within the software by a radiologist, Koios outputs were not adjusted for this study. The software also produced an AI adapter score, a point adjustment between −2 and 2 that is based on overall AI image analysis, independent of the TI-RADS features. The AI adapter score can be used to modify the final TI-RADS score and corresponding recommendation (Fig. 2). Information on feature selections, final TI-RADS score, recommendations, and AI adapter adjustments were recorded for all thyroid nodules.
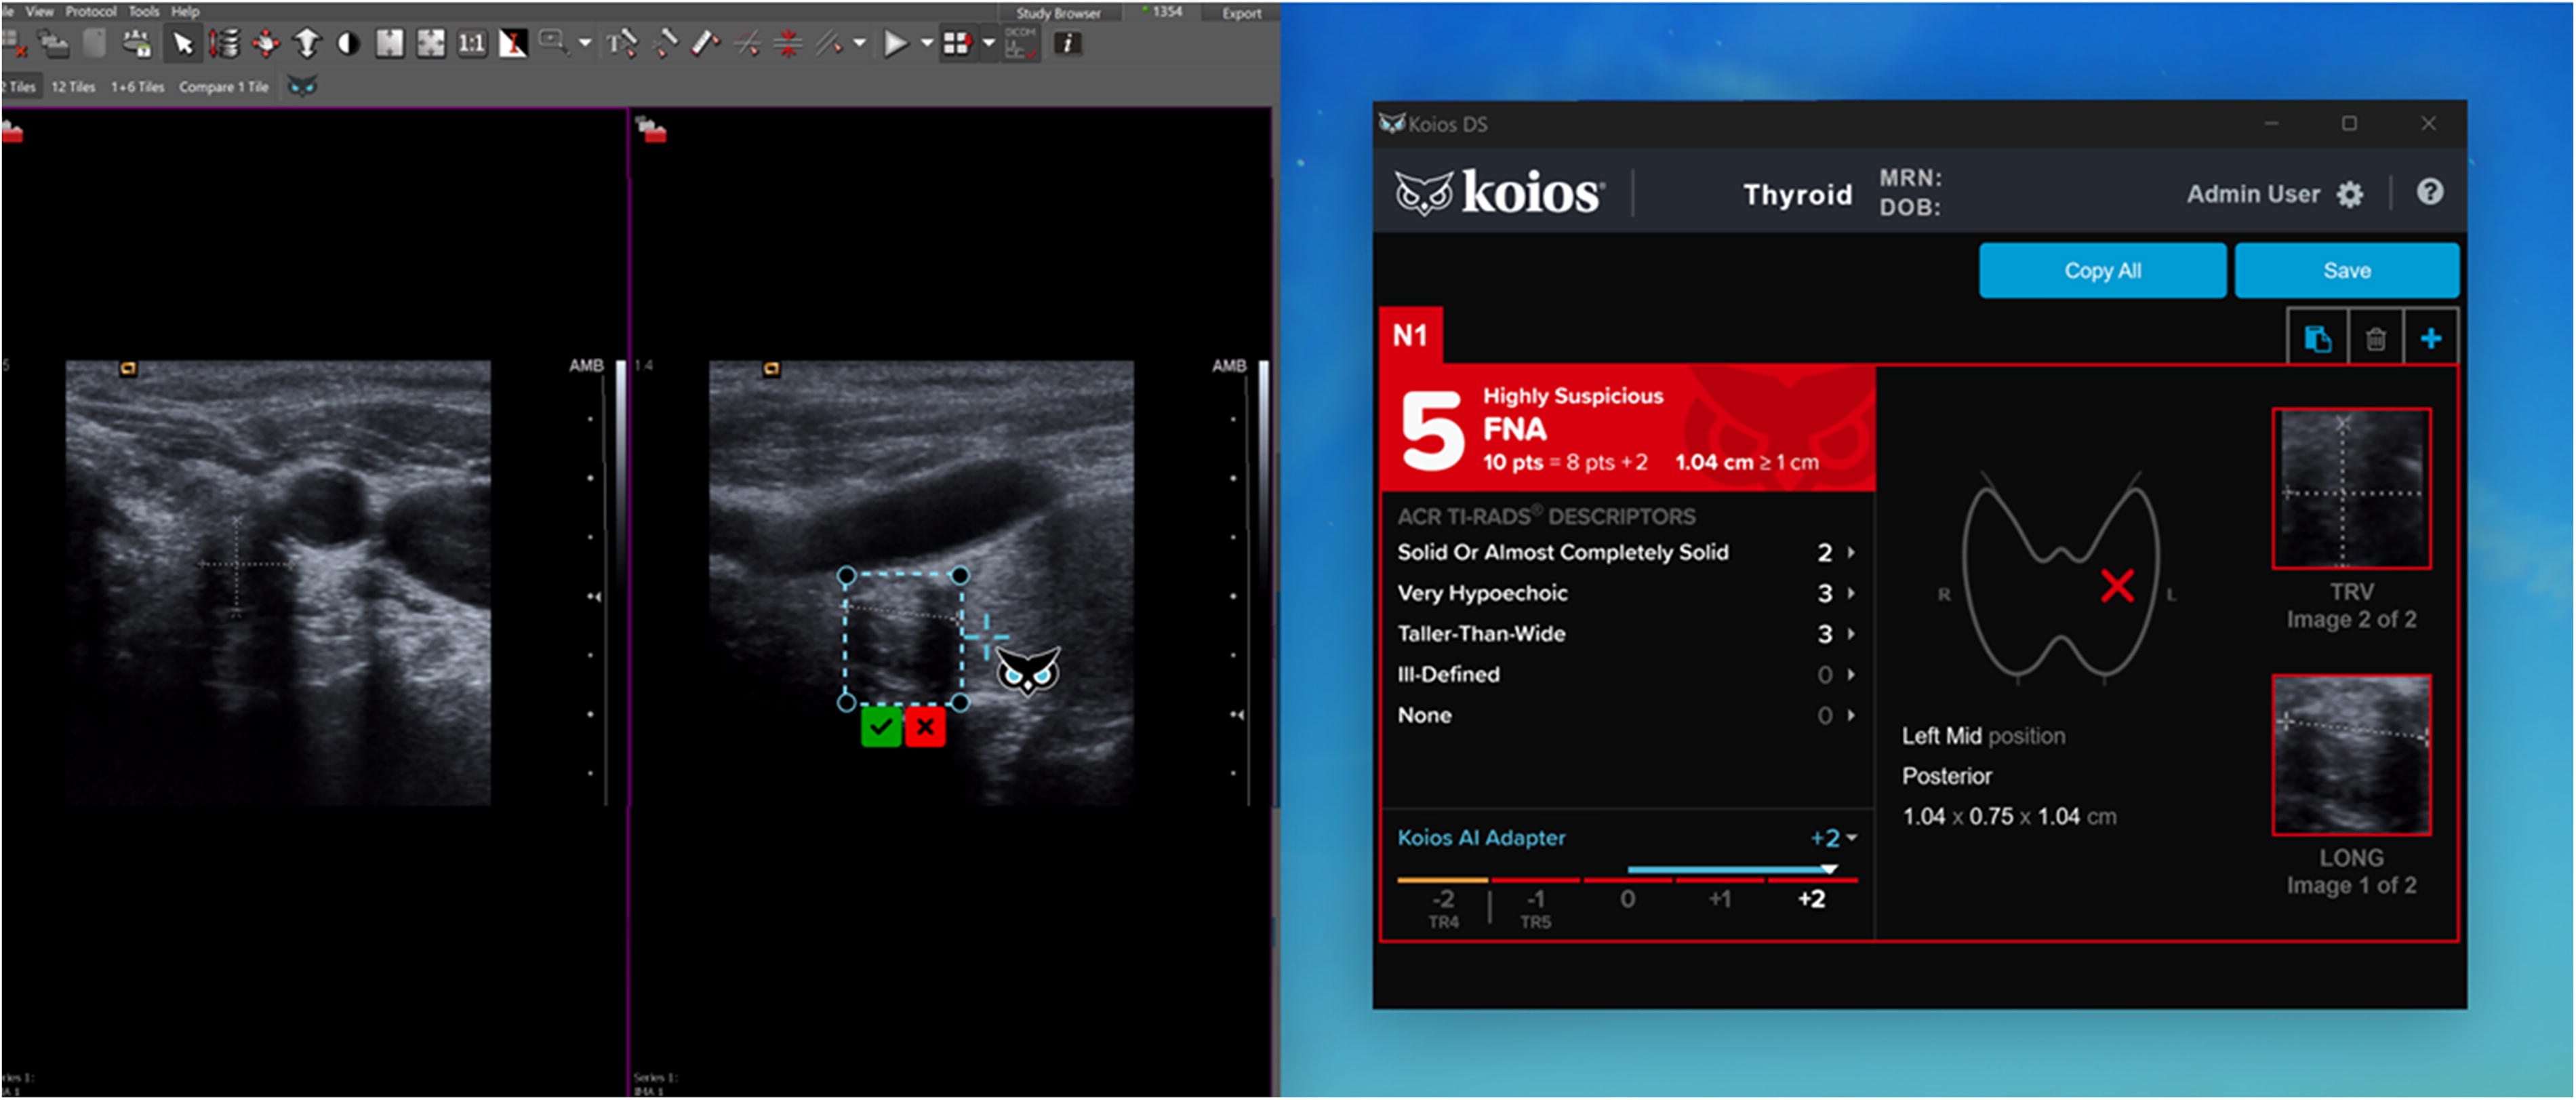
Koios software tool. Rectangular ROIs are manually drawn around the nodule of interest on the longitudinal and transverse ultrasound images (left image). After defining an ROI, the Koios software generates a summary of the TI-RADS nodule descriptor scores, an optional AI adapter score to adjust the risk assessment, and a final TI-RADS risk assessment category and recommendation (right image). TI-RADS, Thyroid Imaging Reporting and Data System.
Nodules were also assessed using the clinical interpretation rendered at the time of original acquisition. Examinations were interpreted by either a subspecialty trained attending radiologist (group of 12–14 radiologists depending on the year of the study period) with a range of 1–24 post-fellowship years’ experience, or a general radiologist (group of 12 radiologists). All reports used ACR TI-RADS for nodule classification. Nodule size based on the clinical report, feature selections, final TI-RADS scores, and final recommendations were recorded for each nodule.
Diagnostic performance analysis and statistical methods
Diagnostic performance of Koios DS and the clinical radiologist interpretation were evaluated by comparing four different groups: (i) clinical radiologist TI-RADS recommendations, (ii) clinical radiologist TI-RADS recommendations modified by the corresponding AI adapter score, (iii) Koios DS software TI-RADS recommendations without the AI adapter score, and (iv) Koios DS TI-RADS recommendations with the AI adapter score.
Performance of each group was evaluated using sensitivity and specificity for the detection of malignancy. For this analysis, a recommendation for FNA was considered a positive result, and a recommendation for no FNA (follow-up or no follow-up) was considered a negative result. Confidence intervals (CIs) for the sensitivity and specificity were reported using the empirical standard errors from generalized estimating equations to account for within patient correlation (multiple lesions per patient). 23 Differences in sensitivity and specificity between groups was evaluated using McNemar’s test. Positive predictive values (PPV) and negative predictive values (NPV) with CI were also reported. Receiver operating characteristic (ROC) curves and area under the curve (AUC) with CI were produced using the total TI-RADS score for each group. The differences in AUC between the radiologist group and the other three groups (accounting for multiple lesions per patient) were tested. 24
The distribution of AI adapter scores for the malignant and benign nodules was calculated, and differences between the AI adapter scores for malignant and benign nodules were evaluated using the Fisher’s Exact test.
The extent of interobserver agreement between the radiologist and Koios groups was calculated for each of the TI-RADS descriptors and final TI-RADS risk categories by calculating both the percent agreement between groups and the weighted Cohen’s kappa coefficient (using squared error weights). Differences in the distribution of the TI-RADS descriptors and total score between the two groups were also evaluated using the Wilcoxon signed rank test or Stuart-Maxwell test (for paired data) with p-values not adjusted for multiple comparisons.
Results
Population and nodule characteristics
Patient population and nodule characteristics are summarized in Table 1. There was a total of 649 nodules in the cohort including 32 malignant nodules (4.9%, 32/649) and 617 benign nodules (95.1%, 617/649). Nodule ground truth classification (benign vs malignant) was determined by surgical pathology for 152 nodules (23.4%, 152/649), FNA for 294 nodules (45.3%, 294/649), and 3-year stability on follow-up US for 203 nodules (31.3%, 203/649). On final pathology, the majority of malignant thyroid nodules were papillary thyroid carcinoma (87.5%, 28/32), with a small percentage of follicular thyroid carcinoma and parathyroid carcinoma (6.3% each, 2/32).
Patient Demographics and Nodule Characteristics
Diagnostic performance
Sensitivity and specificity of the four groups for detection of malignant nodules by TI-RADS recommendation is summarized in Table 2. Koios DS had lower sensitivity than radiologists (Koios 0.66, Koios + Adapter 0.69, radiologists 0.81), but higher specificity (Koios 0.56, Koios + Adapter 0.63, radiologists 0.43). Adding the AI adapter to the radiologist interpretation resulted in increased specificity (0.53 from 0.43) and unchanged sensitivity (0.81). These numbers reflect a low number of missed cancers for radiologists without (n = 6) and with (n = 6) the AI adaptor, compared to 11 missed cancers for the algorithm alone and 10 missed cancers for the algorithm with AI adaptor enabled. Use of the AI adaptor caused a reduction in false positives for both radiologist and algorithm (64 fewer for radiologists, 40 fewer for the algorithm) (Supplementary Tables S1, S2, S3, and S4). PPVs and NPVs are also listed in Table 2. PPVs were low and NPVs were high across all groups (due to low disease prevalence).
Diagnostic Performance of TI-RADS Recommendations for the Radiologists, Radiologists Combined with the AI Adapter, Koios AI Tool, and Koios with AI Adapter
CI in parentheses throughout.
CI were calculated using the empirical standard errors from generalized estimating equations to account for correlation.
CI, 95% Confidence interval; TI-RADS, Thyroid Imaging Reporting and Data System.
The ROC curves and AUC values for each group for total TI-RADS score are shown in Fig. 3. Koios DS without the AI adapter had the lowest AUC of 0.65 ([CI: 0.54–0.76]), but with the addition of the AI adapter tool the software had a higher AUC of 0.70 ([CI: 0.60–0.81]). The best AUC was obtained when the radiologist interpretation was combined with the AI adapter, AUC 0.76 ([CI: 0.67–0.85]), which was significantly higher than the radiologist group AUC of 0.70 ([CI: 0.60–0.79]) (p = 0.03). Both the Koios DS groups (without and with the AI adapter) were not statistically significantly different than the radiologist group (p = 0.43, 0.92).
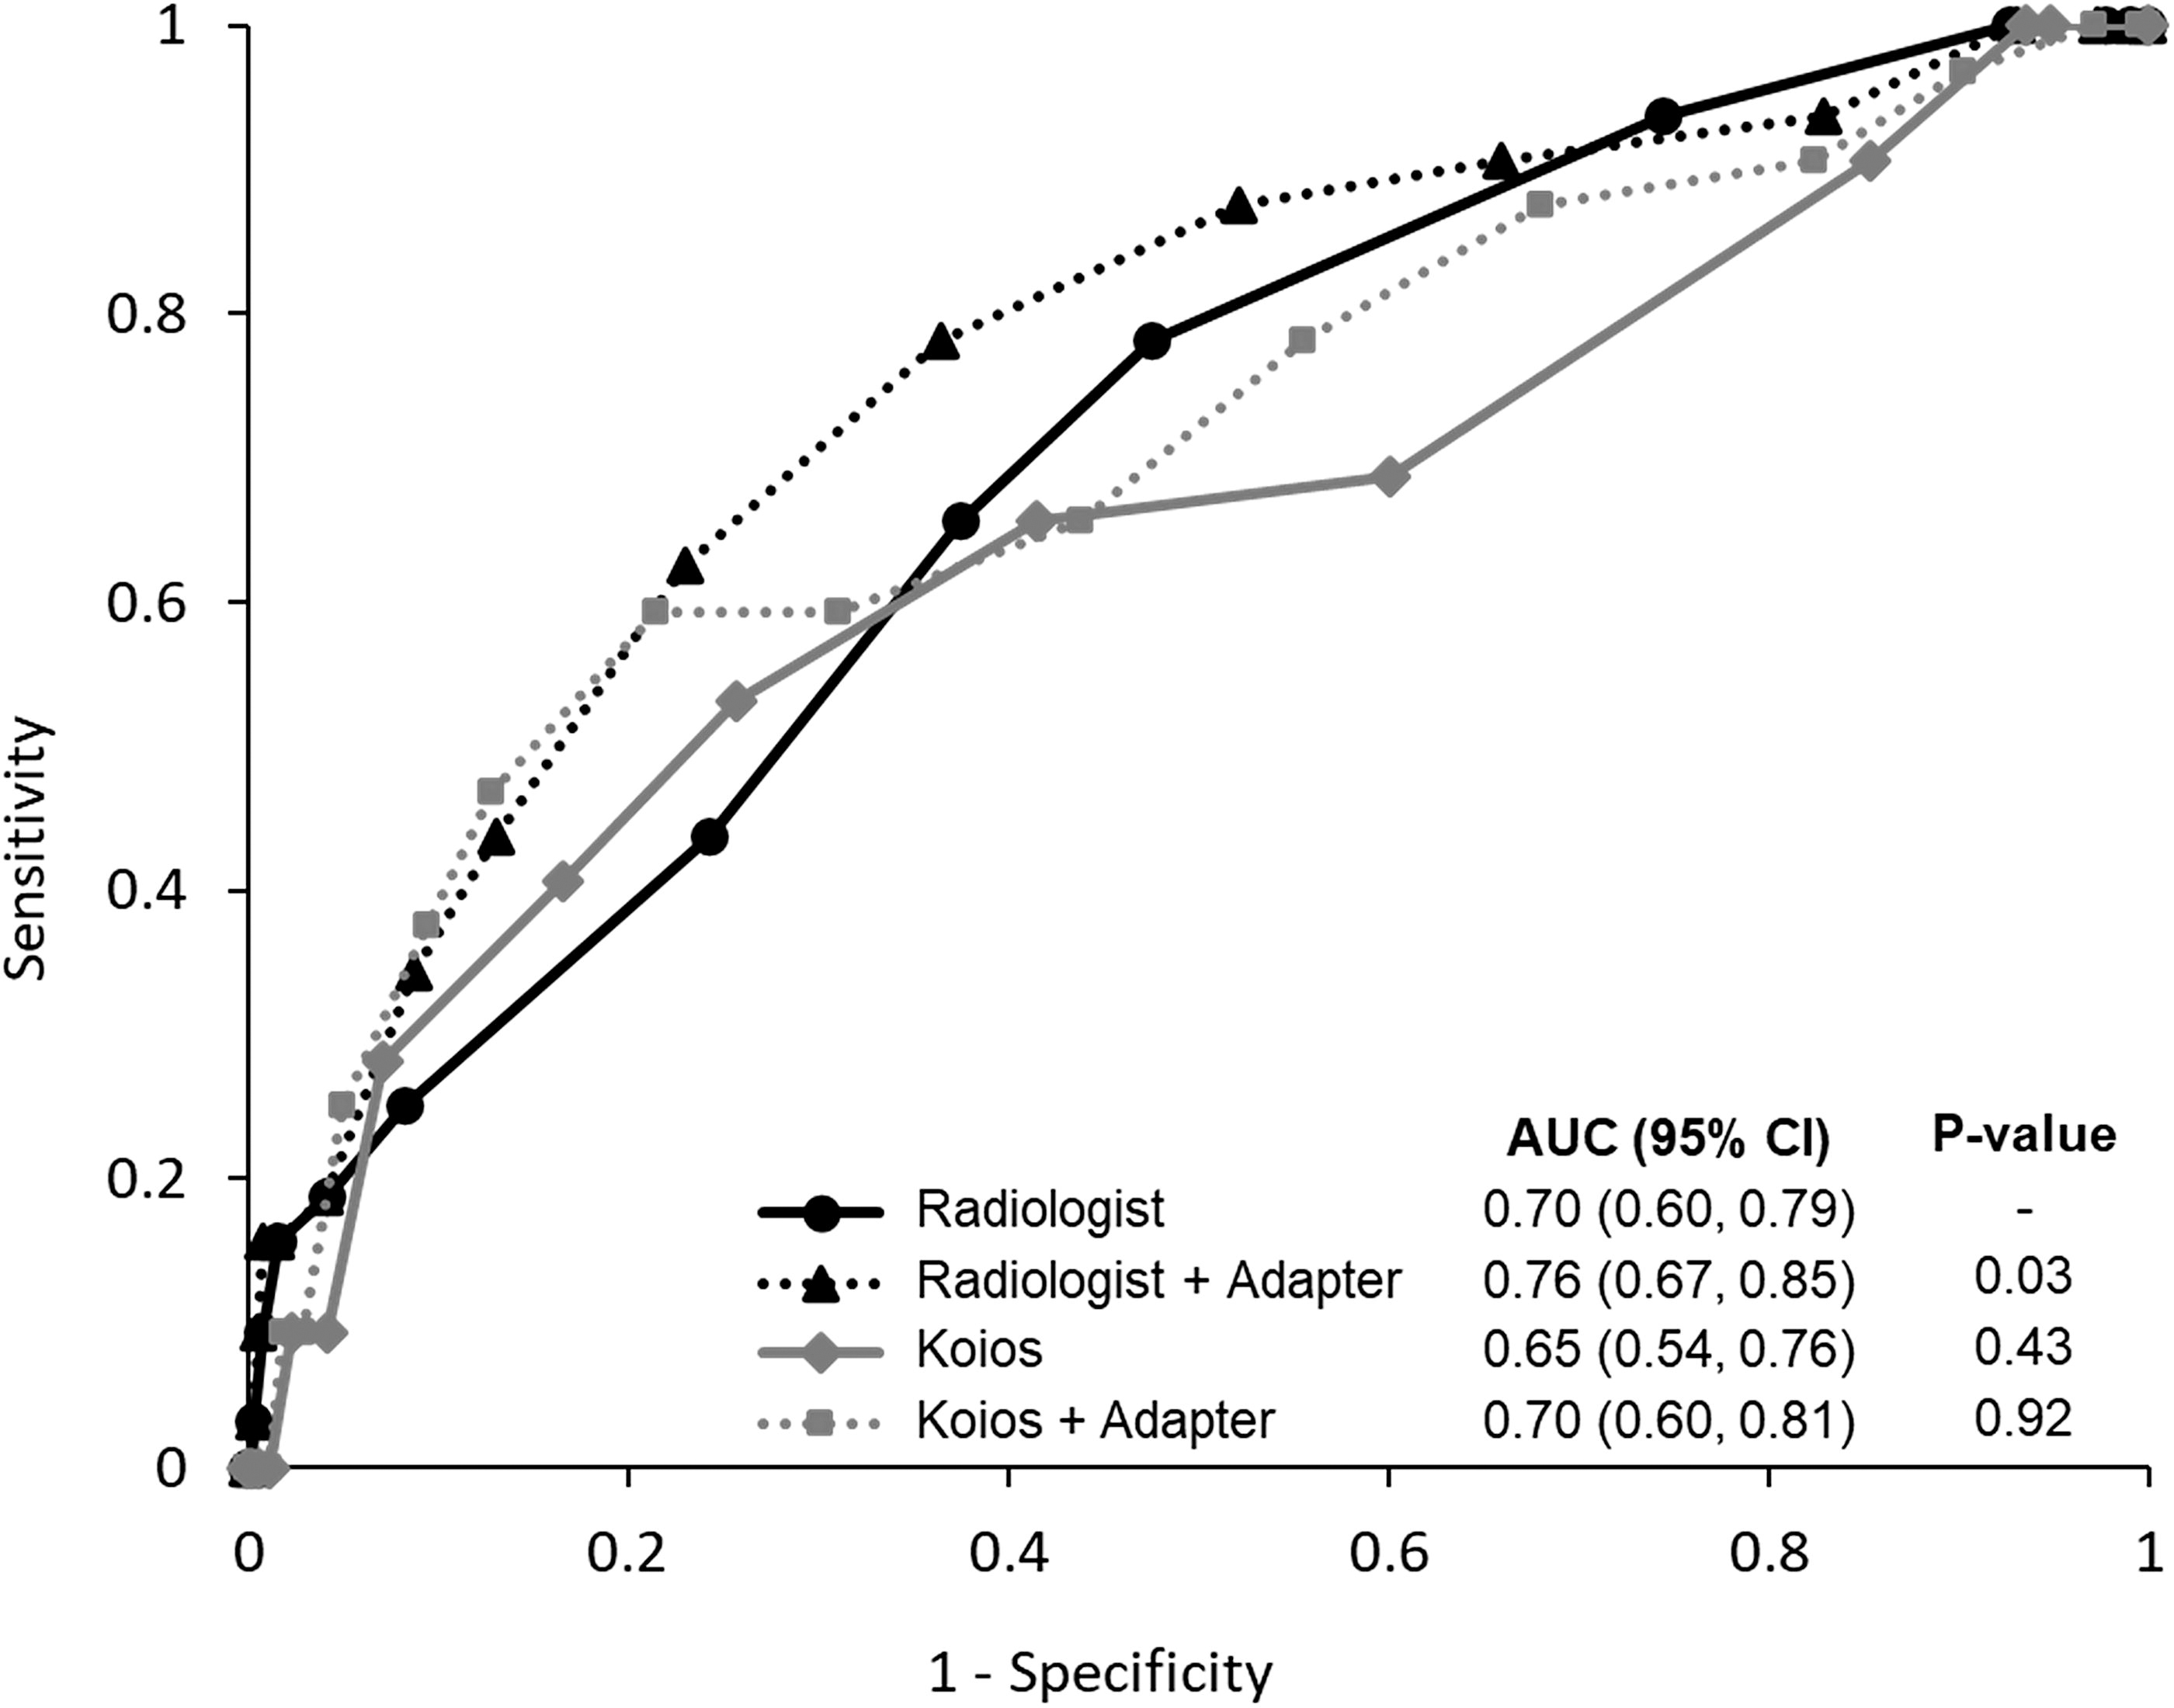
ROC curves for the total TI-RADS score with calculated AUC values and 95% confidence intervals (CI) for each group. The difference in AUC for each group versus the AUC for the radiologist alone were computed and p-values presented. AUC, Area under the curve; ROC, receiver operating characteristic; TI-RADS, Thyroid Imaging Reporting and Data System.
A breakdown of the final TI-RADS recommendations for each group is shown in Table 3. Using Koios DS generally resulted in lower risk categories relative to the radiologist group, which led to fewer recommendations for FNA and more recommendations for no further follow-up. When the AI adapter was added to the radiologist TI-RADS scores, the number of recommended FNAs decreased and the number of recommendations for no further follow up increased. Compared to the radiologist group, there was a 17% relative reduction in FNA recommendations for the radiologist with AI adapter group (378 vs. 314) and a 34% relative reduction in FNA recommendations for the Koios with AI adapter group (378 vs. 251).
Final TI-RADS Recommendation for Each Group (n = 6490 Total)
TI-RADS, Thyroid Imaging Reporting and Data System.
Lastly, there were two follicular carcinomas and two parathyroid carcinomas in the dataset. For the four cancers combined, radiologists alone identified all four correctly compared to 3 of 4 when combined with the AI adaptor. The algorithm alone identified 2 of the 4, compared to 1 of 4 with the AI adaptor enabled.
AI adapter performance
The distribution of AI adapter scores for malignant nodules and benign nodules is shown in Fig. 4. There was a statistically significant difference between the AI adapter scores for benign nodules and malignant nodules (p < 0.001) with higher scores assigned to the malignant nodules. Of the malignant nodules, 69% (22/32) were upgraded in suspicion by the AI adapter (score of +1 or +2), 19% (6/32) were downgraded in suspicion (−1 or −2), and 13% (4/32) were unchanged by the AI adapter (score of 0). Of the six malignant nodules with falsely negative AI adapter scores (−1 or −2), only one had a change in final TI-RADS risk category leading to a false negative recommendation for no FNA for both the radiologist +AI adapter and the Koios +AI adapter groups. Of the 22 malignant nodules with positive AI adapter scores, one nodule was appropriately upgraded to FNA recommendation for the radiologist +AI adapter group, and two nodules were appropriately upgraded to FNA recommendation in the Koios +AI adapter group. Most benign nodules (70%, 432/617) were either downgraded in suspicion or remained unchanged by the AI adapter; however, a minority of benign nodules (30%, 185/617) were upgraded in suspicion by the adapter.

Distribution of AI Adapter scores by nodule type (benign vs. malignant). The AI adapter scores for the malignant nodules were significantly different from the distribution for the benign nodules by Fisher’s Exact test (p value <0.001).
Characterization of false negatives by group
Of the 32 malignant nodules, five were false negatives for all groups. Four of these were too small for FNA recommendation by ACR TI-RADS criteria (<1 cm) and one was small (1 cm) with no suspicious imaging features, so none of the groups recommended FNA.
The radiologist group had one false negative case that the AI adapter correctly upgraded to an FNA recommendation for the radiologist +AI adapter group. However, the AI adapter also falsely downgraded one nodule resulting in a new false negative for the radiologist +AI adapter group. Therefore, the addition of the AI adapter to the radiologist interpretation led to no overall change in the number of false negative recommendations.
The Koios without AI adapter group had an additional six false negatives compared to the radiologist group. In five of these cases, the Koios DS software missed echogenic foci, and in one of the cases, the software miscategorized a very hypoechoic nodule as cystic. Adding the AI adapter to the Koios DS upgraded the suspicion of two of these missed nodules resulting in an appropriate recommendation for FNA. However, the AI adapter with Koios DS also downgraded suspicion for one nodule leading to a new false negative (same nodule as described above for the radiologist group). Overall, the addition of the AI adapter to the Koios software led to one less false negative compared to the Koios software without the AI adapter.
Radiologist and koios software TI-RADS scoring agreement
TI-RADS feature assignments for radiologists and Koios DS showed varying levels of agreement, from fair to moderate (Table 4). Higher kappa values of 0.42 ([CI: 0.33–0.51]) and 0.36 ([CI: 0.29–0.44]) were seen for composition and echogenicity, respectively, while lower agreement was seen for echogenic foci, shape, and margin. Kappa was 0.26 ([CI: 0.18–0.33]) for TI-RADS risk category. Actual percent agreement between the groups was better, with greater than 80% agreement for the composition, shape, and margin features.
Agreement between the Radiologist Score and Koios AI Score for the TI-RADs Features and TI-RADS Categories in the Cohort, Including Both the Weighted Cohen’s Kappa Coefficients (Squared Error Weights) with CI and Actual Percentage Agreement
CI, 95% Confidence interval; TI-RADS, Thyroid Imaging Reporting and Data System.
The distribution of TI-RADS descriptor scores for the radiologist and the Koios groups are shown in Table 5. The distribution of scores for the two groups was found to be statistically different for all of the features, however the actual magnitude of the differences was small for all the features except echogenic foci. The radiologist group had a much higher frequency of a score of three for echogenic foci (29.6% in the radiologist group, 6.8% in the Koios group), which typically corresponds to the punctate echogenic foci feature. The average total TI-RADS score for the radiologist group was also generally higher than the Koios group, with an average score of 5.0 for the radiologist group and 4.4 for the Koios group. This difference in total score was almost entirely accounted for by differences in scores for the echogenic foci descriptor.
Distribution of the TI-RADS Score for Each of the TI-RADS Nodule Features and Total TI-RADS Score by the Radiologist and Koios AI
Tests for differences using Wilcoxon signed rank tests and Stuart-Maxwell tests for paired data. p value was not adjusted for multiple comparisons.
TI-RADS, Thyroid Imaging Reporting and Data System.
Discussion
In this study of over 600 thyroid nodules, overall diagnostic performance of the Koios DS AI tool with its AI adapter feature was similar to that of radiologists when comparing AUCs. The highest AUC was obtained when radiologist interpretations were combined with AI adapter. Although the AUC for Koios DS with the AI adapter was similar to radiologists, there were larger differences between groups when comparing sensitivity and specificity. The Koios software (both with and without the AI adapter) had higher specificity and lower sensitivity than radiologists, which led to fewer overall recommendations for FNA but also more missed cancer diagnoses. For the radiologist group, the addition of the AI adapter resulted in increased specificity with no change in sensitivity, resulting in fewer FNA recommendations (17% reduction) and no change in the total number of missed cancer diagnoses.
The results of this study can help radiology practices better understand the performance characteristics of this FDA-cleared AI tool for thyroid nodules, particularly how the tool may impact human reads. One method of evaluation is a reader study in which the software is fully integrated into the diagnostic workflow, which Koios conducted as part of its approval process. A complementary approach, employed in this study, is to directly apply the AI adapter to a clinical read. The radiologist would not change their behavior based on the result of the AI, and the adapter adjustment could be applied at the end of the diagnostic workflow. This approach may be more appealing to radiologists who may be hesitant to adopt new technology. Even with this more conservative approach of adding the AI adapter score retrospectively to the clinical radiology read, we found an AUC increase of 0.07, specificity increase of 0.10, and no change in sensitivity when comparing the radiologist group with the AI adapter to the radiologist group without the AI adapter. These results are similar to what Koios reported in their reader study, 21 where the use of Koios DS by radiologists led to a mean AUC increase of 0.08, specificity increase of 0.14, and sensitivity increase of 0.08 relative to radiologists without the software tool. An additional recent retrospective reader study evaluating the use of the Koios DS software on a dataset of 172 nodules demonstrated similar results, with mean AUC increase of 0.04, mean sensitivity increase of 0.04, and mean specificity increase of 0.07 when comparing radiologists alone to radiologists incorporating the Koios software into their interpretation. 22 These results suggest that incorporating Koios DS into the radiologist workflow in some way (whether using the full algorithm or just the AI adaptor) may lead to performance improvements and reduction in unnecessary FNAs. However, any FNA reductions must ultimately be balanced against the potential for missed cancers.
Results of this study can also be compared to studies evaluating other thyroid nodule AI algorithms. A meta-analysis of AI-assisted thyroid reads including over 17,000 nodules reported a pooled sensitivity of 0.88, specificity, of 0.81, and AUC of 0.92. 25 A second meta-analysis of AI for thyroid nodule reads compared to radiologist reads also showed high performance for AI, citing a pooled sensitivity of 0.86, specificity of 0.78, and AUC of 0.89. This was not significantly different than the radiologist performance with pooled sensitivity of 0.85, specificity of 0.82, and AUC of 0.91. 26 Both meta-analyses cited significant heterogeneity within the included studies due to difference in experimental design, populations, and thresholds for sensitivity and specificity, among other factors. In our study, the performance of both the AI software and the radiologists was lower than the pooled results of the meta-analyses, which may be impacted by differences in patient population and the TI-RADS criteria used for evaluation of nodules. The results in this study are more comparable to studies evaluating other FDA-cleared AI software, which have similarly used ACR TI-RADS or the ATA guidelines for nodule classification. For example, a study using the AmCAD-UT software and following ACR TI-RADS criteria demonstrated a sensitivity of 0.80, specificity of 0.43, and AUC of 0.72 for the software tool, 27 overall similar to the findings in our study. A study using the S-Detect software tool and following the ATA guidelines demonstrated a sensitivity of 0.95 and specificity of 0.30 for the software tool, 28 which is higher sensitivity but lower specificity than what was seen for the Koios DS software.
Performance of Koios DS for automated classification of TI-RADS features independent of radiologist input was good when evaluating actual percent agreement, with greater than 80% agreement between radiologists and Koios DS for composition, shape, and margin. Kappa scores were lower, in part due to the high likelihood of chance agreement between groups in some categories, particularly composition, shape, and margin. In these categories, the vast majority of nodules fall into only one or two features, an effect that naturally reduces the calculated kappa coefficient. An additional comparison between radiologist and Koios was made by evaluating the distribution of points assigned in each category. Although all of the features had a statistically significant difference between groups, the actual magnitude of the difference between the two groups was small. The only descriptor that had both a statistically significant and clinical meaningful difference in point distribution was echogenic foci. Koios DS gave significantly lower scores overall than the radiologist group and had a much lower frequency of an echogenic foci score of 3, which typically corresponds to the punctate echogenic foci classifications. The majority (5 out of 6) of the malignant nodules that Koios DS did not recommend for FNA (while the radiologist group appropriately recommended FNA) were due to missed echogenic foci. It appears that the sensitivity of Koios DS for echogenic foci is lower than radiologists, leading to lower scores on average for echogenic foci and overall lower total TI-RADS scores. This underscores the need for radiologists to be involved in the interpretation process and to fully evaluate nodule appearance prior to accepting any AI-generated nodule descriptors.
The inclusion of the AI adapter score led to improvements in diagnostic performance for both the radiologist group and the Koios group, with improvement in AUC for both groups, increased specificity for the radiologist group, and increase sensitivity and specificity for the Koios group. The AI adapter generally performed well for classifying nodules, with 69% of malignant nodules being upgraded in suspicion by the AI adapter score and 70% of benign nodules being downgraded or unchanged by the AI adapter score. Although not a perfect discriminator, the addition of the AI adapter could provide additional confidence to a radiologist in recommending or not recommending FNA. The primary benefit seen with use of the AI adapter in this study (when combined with the radiologist interpretation) was an overall reduction in the number of FNA recommendations made with no change in overall number of missed cancers. Of note, Koios does periodically update their software based on sources from around the world, and newer versions of the software may have higher performance.
This study had several limitations. The primary limitation was that it did not fully replicate the normal diagnostic interpretation process. In our study, the radiologist with AI adapter group was created by retrospectively combining the clinical radiology report impression with the AI adapter score for a final combined risk assessment. In actual practice the radiologist would use the AI tool in real time and interact with the automatically generated Koios descriptors, possibly adjusting their clinical impression based on the results of the software. Therefore, this study is an approximation of how the software might perform in practice when combined with radiologist interpretation. This approach, however, was chosen because it enabled use of a large dataset of well-characterized nodules and allowed for in-depth analysis of the performance of the Koios tool in isolation and when combined with radiologist interpretations. Another limitation of our study design was that we did not evaluate interpretation time or workflow, two potential causes of radiologist frustration when introducing new technology. Nor did we evaluate radiologists’ perception of the tool, as the lack of transparency or “explainability” with the AI adaptor may be less palatable to some. Future evaluation of this software using prospective reader studies will allow for further validation of these issues. Another important limitation relates to the follow-up period. Our three year follow-up window was likely sufficient to confirm stability and exclude aggressive malignancies, but it may miss some indolent cancers. Some papillary neoplasms can be stable for five years, 29 and a longer follow-up window may have been beneficial in a minority of cases. Finally, the AI outputs were based on two still images, which may not be true representations of a nodule’s features. The images to use were chosen based on the sonographers’ centered images on the middle of a nodule, the same images used for measurement and general depiction of a nodule. Still images have formed the foundation of much thyroid nodule research and product development, with future studies likely focusing on the use of cine clips.
The Koios DS AI software tool demonstrated standalone performance similar to that of radiologists, though with lower sensitivity and higher specificity. Performance was best when radiologist interpretations were combined with the AI adapter component, which led to improved specificity and a reduction in unnecessary FNA recommendations. Further prospective studies of this tool are warranted to evaluate real world clinical performance.
Footnotes
Authors’ Contributions
J.A.: Conceptualization, data curation, investigation, writing—original draft preparation. S.M.: Methodology, formal analysis, visualization, writing—review and editing. A.E.: Methodology, formal analysis, writing—review and editing. B.W.-T.: Conceptualization, investigation, supervision, writing—review and editing.
Author Disclosure Statement
B.W.-T. is a consultant for See-Mode Technologies. The other authors have no relevant disclosures.
Funding Information
Support was provided by the Biostatistics, Epidemiology and Research Design Methods Core funded through Grant Award Number UL1TR002553 from the National Center for Advancing Translational Sciences, a component of the National Institutes of Health.
Supplementary Material
Supplementary Table S1
Supplementary Table S2
Supplementary Table S3
Supplementary Table S4