
Abstract
Purpose:
Extraocular muscle (EOM) enlargement occurs in both acromegaly and Graves’ disease, but the degree and pattern of enlargement have not been directly compared in these patient groups. This study investigated whether acromegaly and Graves’ orbitopathy (GO) are associated with different patterns of EOM enlargement at the time of diagnosis.
Study Design:
Retrospective cohort.
Methods:
All new patients with a diagnosis of acromegaly or GO who presented to St Joseph’s Health Care in London, Ontario, between January 1, 2015, and July 1, 2020, and who underwent computed tomography (CT) scanning with adequate orbital imaging were considered for inclusion. We included age- and sex-matched control patients with pituitary macroadenomas without thyroid or growth hormone abnormalities. Orbital CT scans were analyzed by a single neuroradiologist, who measured the maximum diameter and cross-sectional area of each EOM. The relative likelihood of involvement of each rectus EOM was analyzed separately using an analysis of variance test.
Results:
We included 16 patients with GO, 17 with acromegaly, and 18 controls. Ages (mean ± standard deviation) of groups were 55.6 ± 18.0, 50.2 ± 15.7, and 49.3 ± 14.0 years. The mean maximum diameter of EOMs in GO, acromegaly, and controls was inferior rectus (IR) = 4.77 ± 1.53, 4.66 ± 0.61, and 3.68 ± 0.61 mm; medial rectus (MR) = 5.35 ± 2.23, 4.84 ± 0.81, and 3.65 ± 0.42 mm; superior rectus (SR) = 4.94 ± 1.84, 4.88 ± 0.91, and 3.68 ± 0.61 mm; and lateral rectus (LR) = 3.91 ± 1.59, 4.55 ± 0.60, and 3.20 ± 0.43 mm. The IR, MR, and SR muscles were significantly larger in the GO group compared with controls (IR, p = 0.020; SR, p = 0.004; MR, p < 0.001; and LR, p = 0.166), and all four EOMs were larger in acromegaly compared with controls (IR, p = 0.039; SR, p = 0.006; MR, p = 0.006; and LR, p = 0.001). There was no significant difference between the GO and acromegaly groups (IR, p = 0.959; SR, p = 0.987; MR, p = 0.408; and LR, p = 0.250).
Conclusions:
GO and acromegaly groups demonstrated the enlargement of the IR, MR, and SR muscles when compared with controls. The GO group did not show significantly larger EOM sizes compared with the acromegaly group. In the GO group, the IR, MR, and SR were similarly affected and did not follow previously described patterns of enlargement in GO.
Background
The most common cause of extraocular muscle (EOM) enlargement is Graves’ orbitopathy (GO). 1 Less frequent causes include inflammation, neoplasms, vascular abnormalities, infections, and a variety of other conditions such as acromegaly. 2 In addition to clinical context, specific features of EOM enlargement seen on neuroimaging can be useful in diagnosis—including features such as muscle shape, borders, and enlargement pattern across muscles. Despite recent evidence that EOM enlargement occurs in patients with acromegaly, they do not typically have clinically significant exophthalmos, unlike patients with GO. 2
EOM hypertrophy in GO has been described to preferentially affect certain muscles, with the greatest enlargement of the inferior rectus (IR), followed by the medial rectus (MR), superior rectus (SR), lateral rectus (LR), and lastly oblique muscles—sometimes referred to as the “IMSLO” pattern. This pattern of EOM enlargement is purportedly distinct from patterns in other rarer pathological EOM changes. 3 A clear characterization of the different patterns of EOM enlargement in various orbital pathologies may thus potentially aid in accurate diagnosis. Although EOM enlargement in GO is generally accepted to follow the IMSLO pattern, a belief that was first published in 1979 by Enzmann et al. 4 and has since been propagated in the literature, the evidence for this pattern remains scant. Patterns of EOM enlargement in acromegaly are likewise not well understood, due to the small quantity and sample sizes of studies. An understanding of comparative EOM enlargement patterns for various conditions could thus improve diagnostic accuracy when EOM abnormalities are detected and extend understanding of the mechanisms underlying changes to orbital tissue. For example, in clinically unilateral GO, EOM enlargement is often found in contralateral eyes before clinical signs appear, 5 and in most cases of acromegaly, there are significant delays in diagnosis.
In this study, we further characterize the diagnostic value of EOM size by comparing the pattern of EOM enlargement in GO with acromegaly, as well as controls. We additionally report differences in proptosis between these groups and EOM enlargement differences between various levels of disease severity in GO.
Methods
All new patients with a diagnosis of GO evaluated by a single neuro-ophthalmologist (L.L.C.D.B.) between January 1, 2015, and July 1, 2020, and who underwent computed tomography (CT) imaging of the orbits were considered for inclusion. Patient demographics, date of diagnosis of Graves’ disease, date of imaging, and laboratory results including thyrotropin, free triiodothyronine, free thyroxine, and thyrotropin receptor antibody test were collected. All imaging used in the study was from the time of diagnosis, and no follow-up data were analyzed. The acromegaly group included patients with a new diagnosis of acromegaly evaluated in an endocrinology outpatient clinic by a single endocrinologist (S.V.U.) during the same time period as above. The control group consisted of age- and sex-matched patients with nonfunctioning macroadenomas, who did not have evidence of GO or acromegaly. All data for the acromegaly and control groups were adapted from a previously published study. 6 All patients included had CT scans with adequate views of the orbits for EOM measurements.
CT scans were analyzed by a single neuroradiologist (P.O.). The maximum diameter and cross-sectional area of each rectus muscle (SR, IR, MR, and LR) were measured in both eyes of all patients according to a previously described technique. 6 Oblique muscles were not reliably imaged and were therefore not measured. Degree of proptosis was also measured for each orbit, using the anterior globe position as outlined in a validated protocol. 7
Severity scores for both orbits of each patient with GO were determined to assess the relationship between EOM parameters and severity of disease. The mean total diameter of all EOM was combined for each GO eye and analyzed in relation to disease severity. These scores were determined through the European Group on Graves' orbitopathy (EUGOGO) classification of mild, moderate-to-severe, or sight-threatening GO. 8
Ethical approval for this study was obtained from the Lawson Health Research Institute (No. 116401), and the proper processes were followed. This study adhered to the tenets of the Declaration of Helsinki, and informed consent was obtained from each patient. This study followed the STROBE guidelines for reporting observational studies.
Data analysis
Right and left eye EOMs and proptosis were compared within each group using a two-tailed unequal variance t test, with no significant lateral difference (p > 0.05 for all muscles and globe positions in all groups). For the remainder of the analysis, only right eyes were considered to avoid cross-correlation effects between individual patients’ eyes, as GO and acromegaly do not affect both eyes of individuals similarly.
Results
In total, there were 16 patients with GO, 17 with acromegaly, and 18 controls. The age (mean ± standard deviation) of patients was 55.6 ± 18.0 years in the GO group, 50.2 ± 15.7 years in the acromegaly group, and 49.3 ± 14.0 years in the control group.
While there were no significant differences in sex, age, height, weight, and blood pressure between the acromegaly and control groups, there was a substantially greater proportion of females in the GO group (100%) than the acromegaly (41%) and control groups (33%). Members of the GO group had lower height (p = 0.003), lower weight (p < 0.001), and lower diastolic blood pressure (p < 0.001) than the control group (Supplementary Table S1). There were robust differences in endocrinological laboratory measures between the three groups assessed (Supplementary Table S2).
Post hoc analysis showed significant differences in mean maximum EOM diameter between the GO group and the control group for the SR (p = 0.004), IR (p = 0.02), and MR (p < 0.0001) but not LR (p = 0.167) muscles (Supplementary Table S3, Fig. 1). While the acromegaly group significantly differed from controls for all EOM, they did not significantly differ from the GO group for any muscle. The same results were obtained for EOM cross-sectional area, with a significantly greater maximum area of the SR (p = 0.007), IR (p = 0.01), and MR (p = 0.03) but not the LR (p = 0.05) in the GO compared with the control group (Supplementary Table S4, Supplementary Fig. S1). There was no significant difference in the cross-sectional area of any muscle between the GO and the acromegaly group (all p > 0.05).
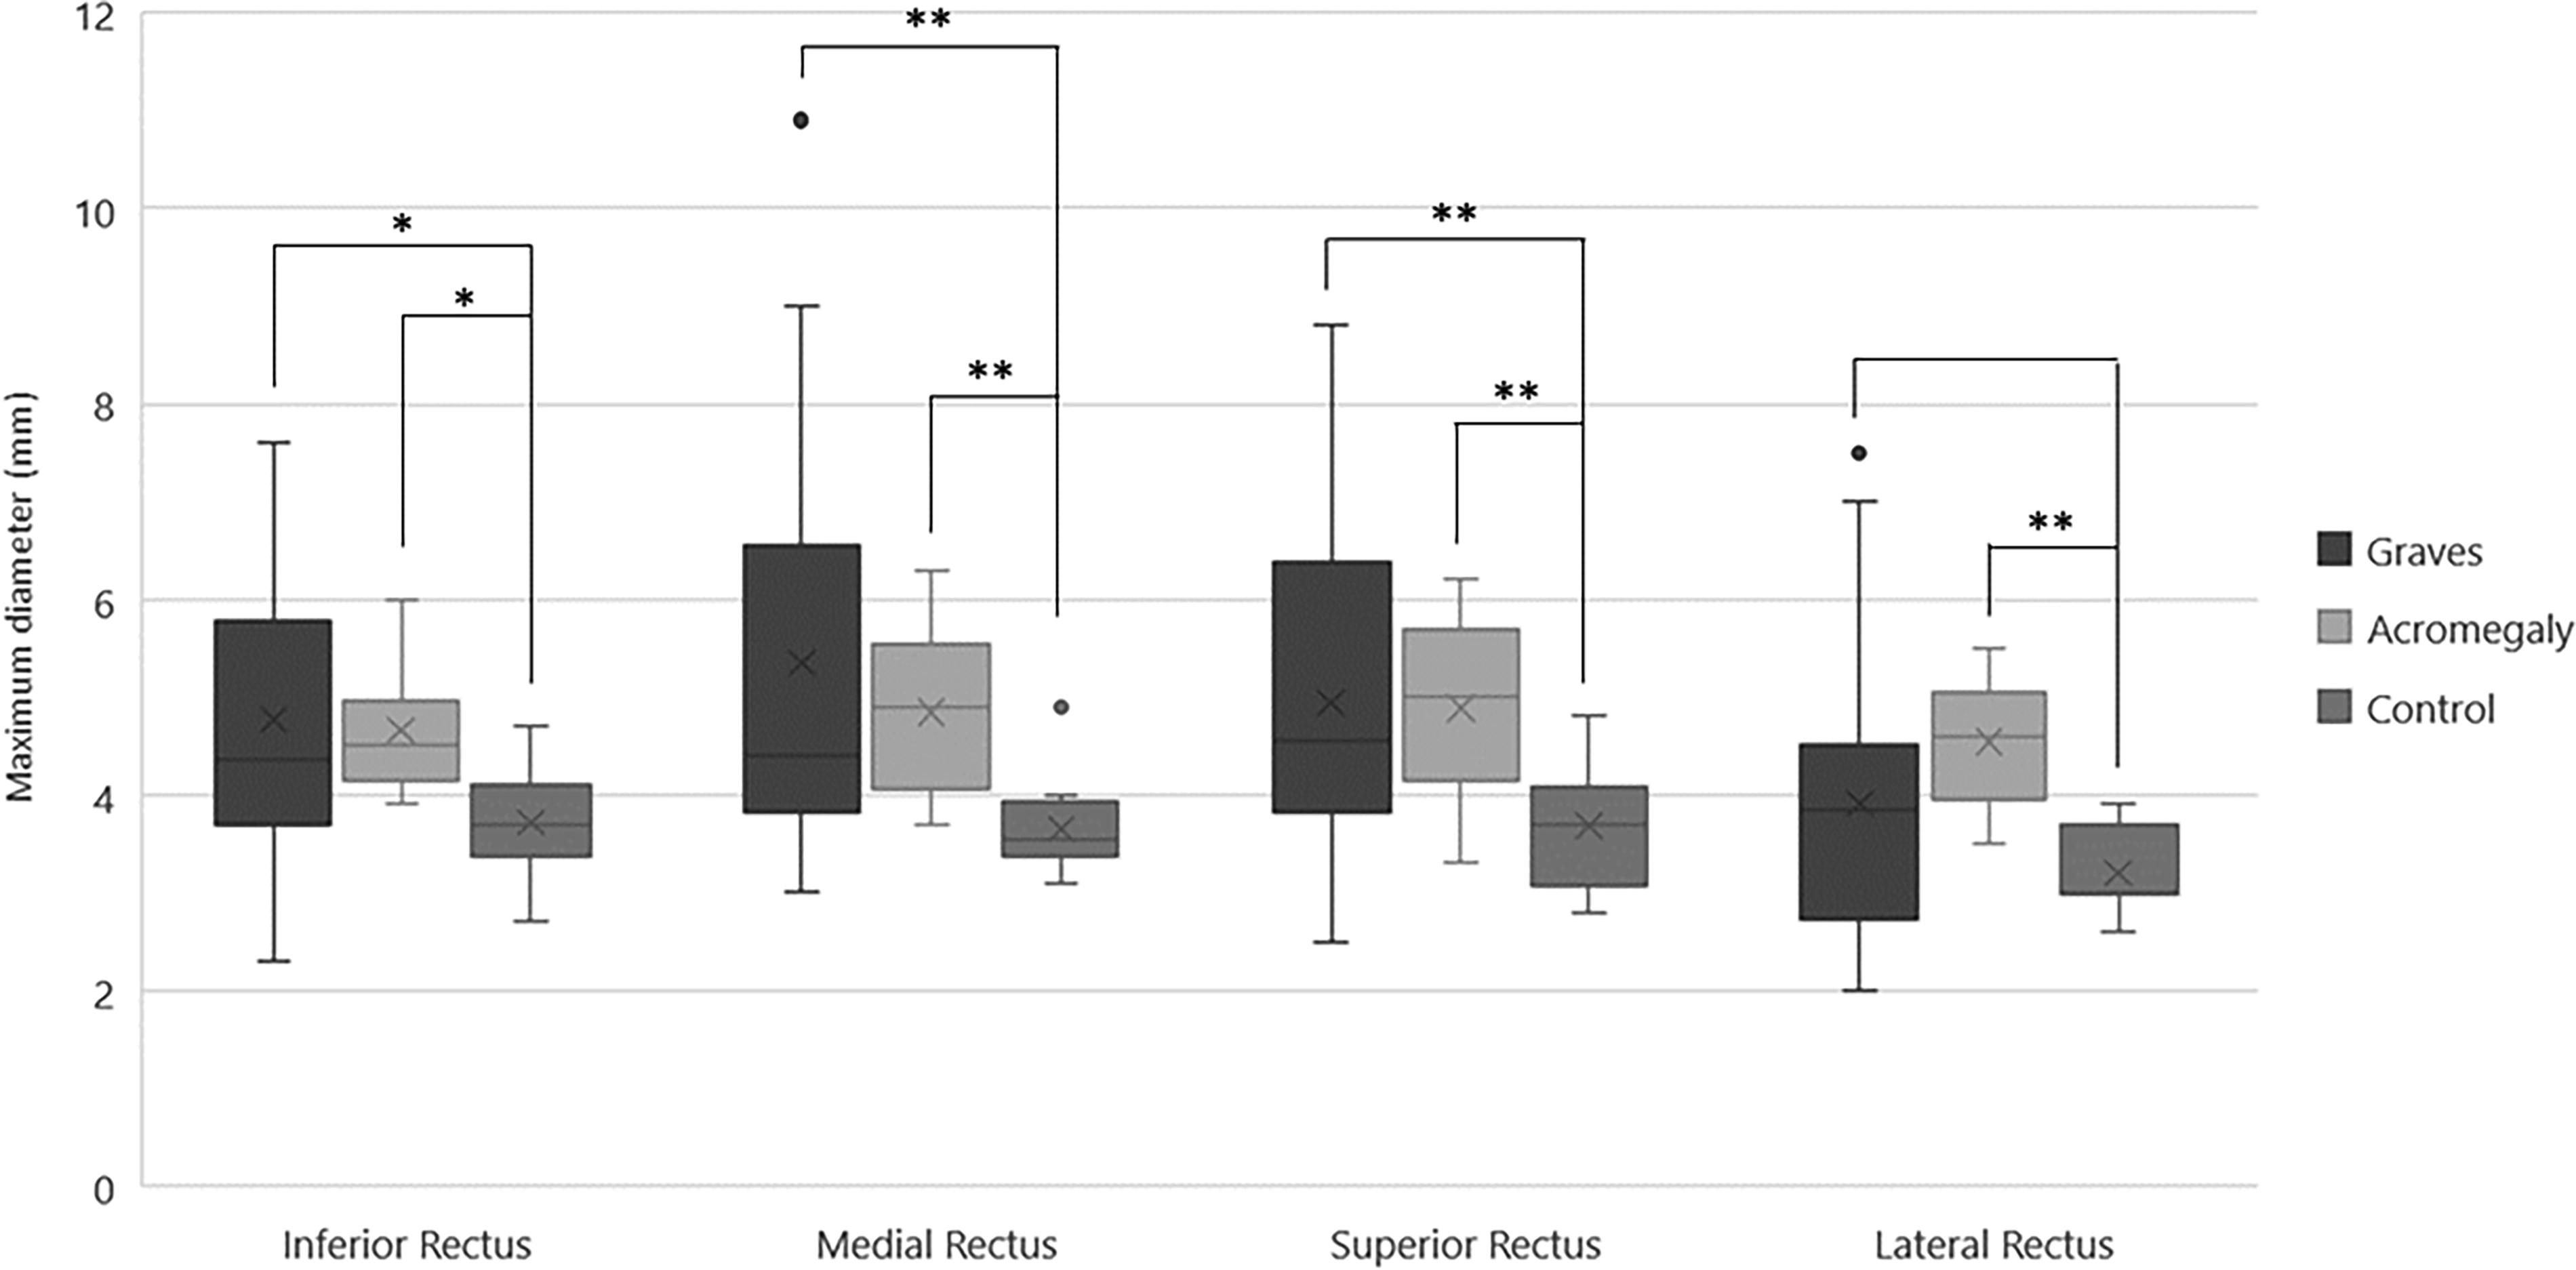
Extraocular muscle (EOM) maximum diameters in Graves’ orbitopathy, control, and acromegaly groups. Significant differences between Graves and controls were found for the inferior, medial, and superior rectus muscles but not the lateral rectus. All four EOMs were significantly different between acromegaly and controls. There were no differences between Graves and acromegaly groups for any EOM. *p < 0.05; **p < 0.01.
Mean right anterior globe position was 21.0 mm in the GO group, 19.3 mm in the acromegaly group, and 17.9 mm in the control group. There was a significantly greater degree of exophthalmos in the GO group than in the control group (p = 0.028). There was no significant difference in the mean anterior globe position of the acromegaly compared with the control group (p = 0.411) or GO compared with the acromegaly group (p = 0.290).
When the GO group was subdivided by degree of disease severity, the mean diameter of all EOM was 16.27 ± 5.10 mm in the mild subgroup (n = 15), 21.84 ± 8.71 mm in the moderate-to-severe subgroup (n = 14), and 23.4 ± 3.15 mm in the sight-threatening subgroup (n = 3; Supplementary Fig. S2).
Discussion
This retrospective analysis suggests that EOM enlargement in GO may occur uniformly across the IR, SR, and MR muscles but to a lesser degree in the LR. The enlargement is similar in magnitude to acromegaly patients across all measured muscles. Although GO is the most commonly associated condition with EOM enlargement, our findings suggest that the degree and proportion of enlargement are not significantly different than that seen in acromegaly (Fig. 2). 6 Enlargement of the LR was the most specific differentiating acromegaly versus GO.
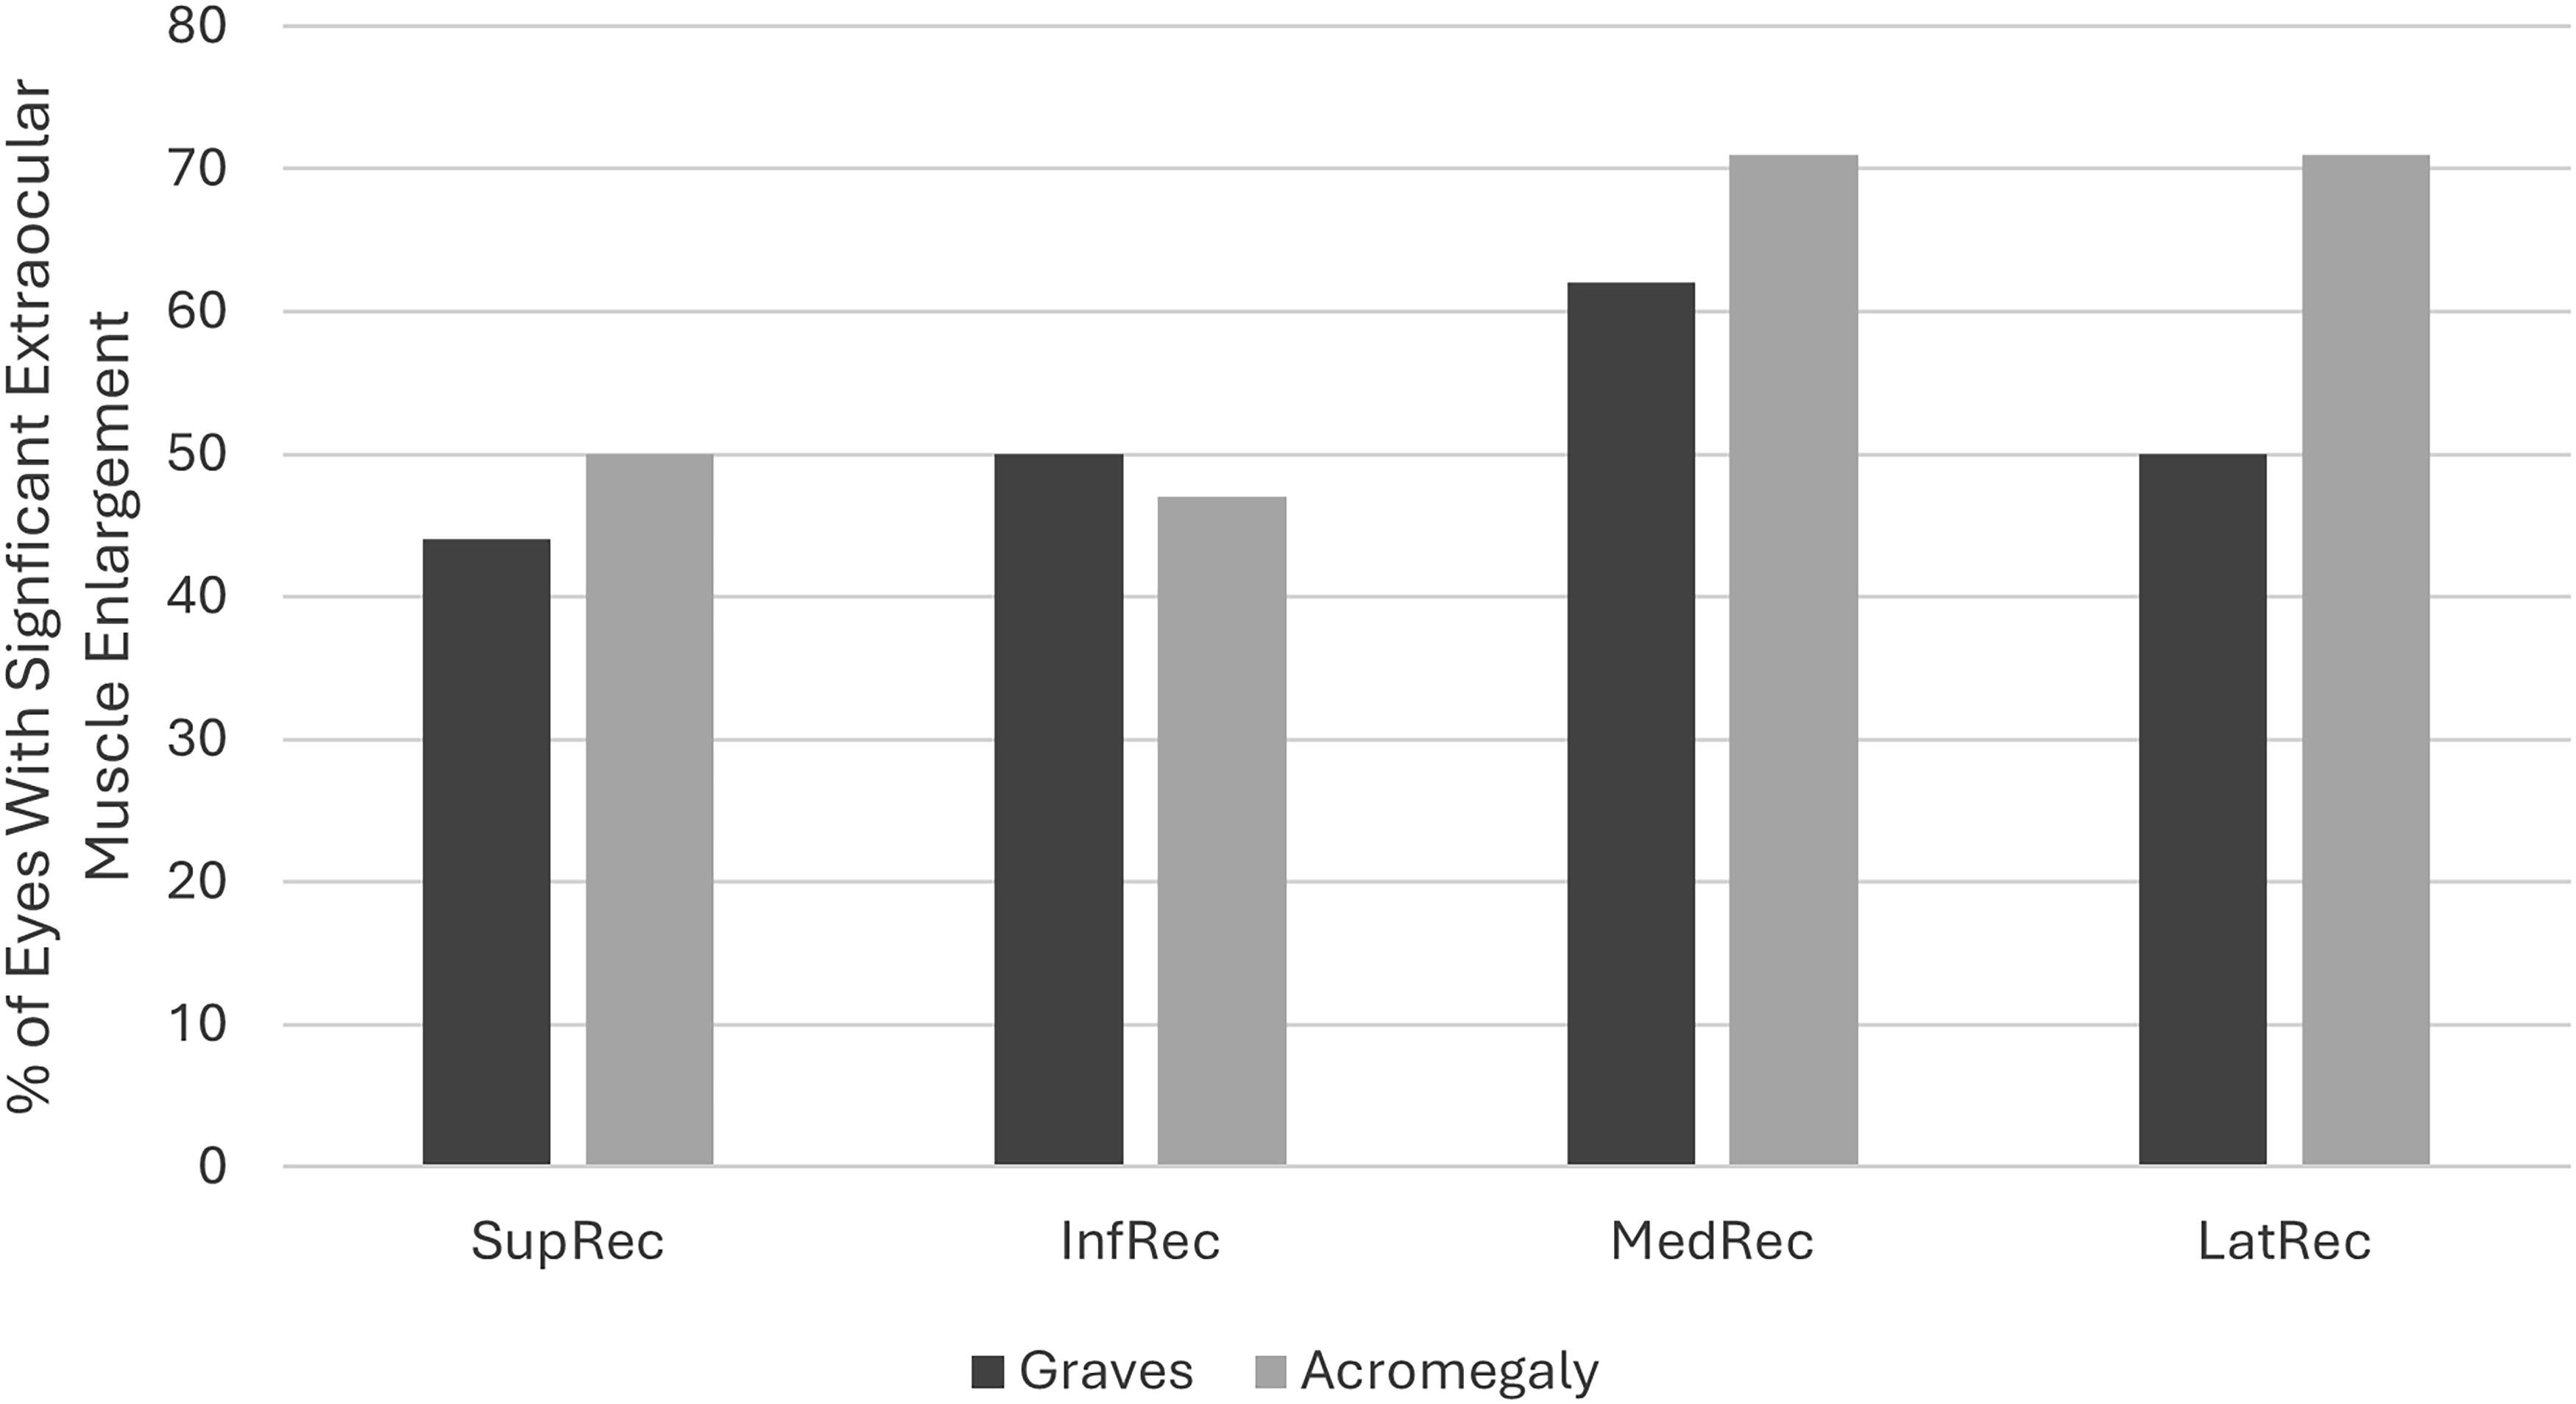
Proportion of eyes with enlarged extraocular muscles (EOMs) in disease groups. Eyes with significant EOM enlargement were defined as having maximal diameters at least two standard deviations from controls. There was a higher proportion of lateral rectus enlargement in the acromegaly group compared with Graves’ orbitopathy. InfRec, inferior rectus; LatRec, lateral rectus; MedRec, medial rectus; SupRec, superior rectus.
We did not find significant differences in EOM diameter or cross-sectional area when directly comparing GO and acromegaly. Therefore, other differentiating features may be particularly valuable in determining a diagnosis beyond GO, including unilateral EOM enlargement, restricted diffusion on MRI, absence of pain, or involvement of adjacent structures. 3 While EOM is known to reduce in size with treatment in acromegaly, 9 recent evidence has shown that teprotumumab—an IGF-1 receptor inhibitor—not only improves clinical symptoms of GO but also reduces EOM cross-sectional area. 10 This would suggest a possible primary implication of IGF-1 in EOM enlargement for both conditions but does not explain why the LR may be affected to a lesser extent in GO than acromegaly. Despite the vast majority of EOM enlargement occurring secondary to GO, it remains vital to consider other diagnoses such as acromegaly, given the high likelihood of systemic disease and associated mortality.
The classically accepted pattern of “IMSLO” EOM enlargement in patients with GO was not reflected in our limited sample. Our study found that in patients with GO, the IR, MR, and SR muscles were enlarged to a similar degree, whereas there was a lesser degree of enlargement of the LR. Simultaneous presence of multiple clinical and radiographical signs should be used for the diagnosis of thyroid-associated orbitopathy. The features of GO are complex, and further study of the precise radiographical features of this disease in comparison with other conditions is warranted. A major limitation of our study was the lack of males in the GO group, which limits the generalizability of the findings. Larger, gender-balanced multicenter investigations may be worthwhile to better elucidate the different characteristics of EOM enlargement in GO and acromegaly in order to further guide clinical diagnostics at presentation.
Footnotes
Authors’ Contributions
C.Z.: Methodology (supporting), investigation (equal), data curation (lead), writing—original draft (lead), and writing—review and editing (equal). N.P.: Investigation (equal), writing—original draft (supporting), and writing—review and editing (equal). R.M.: Investigation (equal), data curation (supporting), and writing—review and editing (equal). S.V.U.: Methodology (supporting), investigation (supporting), and writing—review and editing (equal). A.F.: Methodology (supporting), investigation (supporting), and writing—review and editing (equal). P.O.: Investigation (equal) and writing—review and editing (equal). L.L.C.D.B.: Conceptualization (lead), methodology (lead), investigation (equal), resources (lead), and writing—review and editing (equal).
Author Disclosure Statement
No competing financial interests exist.
Funding Information
No funding was received for this study.
Supplementary Material
Supplementary Figure S1
Supplementary Figure S2
Supplementary Table S1
Supplementary Table S2
Supplementary Table S3
Supplementary Table S4
References
Supplementary Material
Please find the following supplemental material available below.
For Open Access articles published under a Creative Commons License, all supplemental material carries the same license as the article it is associated with.
For non-Open Access articles published, all supplemental material carries a non-exclusive license, and permission requests for re-use of supplemental material or any part of supplemental material shall be sent directly to the copyright owner as specified in the copyright notice associated with the article.