
Abstract
Background:
This retrospective case–control study aimed to investigate the effects of thyroid-stimulating hormone (TSH) suppression on vascular wall inflammation, assessed by [18F]-fluorodeoxyglucose (FDG) positron emission tomography (PET)/computed tomography (CT). Vascular [18F]FDG-uptake is highly correlated with arterial inflammation, which represents a major risk factor for atherosclerotic plaques.
Methods:
Forty patients with differentiated thyroid cancer underwent [18F]FDG-PET/CTs under TSH suppression therapy following surgical removal of the thyroid and subsequent radioiodine ablation. The [18F]FDG-uptake was measured in the carotid arteries, aortic arch, and the ascending, descending, and abdominal aorta. All measurements in the PET scans were normalized to body weight and corrected for blood pool activity in the superior vena cava, creating target-to-background ratios (TBRs). Twenty-five patients with euthyroid hormone status were used as a control group. In addition, to evaluate long-term changes, the follow-up PET/CTs of 24 thyroid carcinoma patients under continued TSH suppression therapy were analyzed.
Results:
In patients with TSH suppression, significantly higher arterial [18F]FDG-uptake (p < 0.001) was observed in the ascending aorta, aortic arch, abdominal aorta, carotid artery, and for all arterial vessels combined (mean TBRmax ± standard deviation [SD]: 1.8 ± 0.4, 1.8 ± 0.3, 1.9 ± 0.4, 1.4 ± 0.3, 1.7 ± 0.2, respectively) compared with the euthyroid control group (TBRmax ± SD: 1.4 ± 0.2, 1.4 ± 0.2, 1.4 ± 0.2, 1.1 ± 0.2, 1.3 ± 0.1, respectively). In the subgroup of patients who received an additional follow-up scan after a mean duration of 1.9 ± 1.1 years of continued TSH suppression therapy, no significant changes in arterial [18F]FDG-uptake were found in the five arterial sites when both scans were compared over time (p > 0.05).
Conclusions:
Our study suggests that patients under TSH suppression may experience a significant increase in vascular [18F]FDG-uptake, a marker of arterial inflammation, and, therefore, might be at higher risk for cardiovascular disease. Interestingly, the duration of TSH suppression was not significantly associated with vascular [18F]FDG-uptake in our study, indicating that the observed increase in arterial inflammation may not be influenced by the duration of TSH suppression.
Introduction
Cardiovascular disease (CVD) is a major burden for society and remains the leading cause of death in Europe and in the world. 1 There is a rising trend of CVD-related death rates in recent years, which has been partially attributed to worsening risk factors. 2,3 To prevent cardiovascular events, identifying populations at heightened risk and managing potentially reversible factors, such as core health behaviors (smoking, physical activity, nutrition, sleep, and obesity) and health factors (cholesterol, blood pressure, glucose control, and metabolic syndrome), are essential. 4
Thyroid-stimulating hormone (TSH) suppression is one of the main pillars of thyroid cancer treatment and a less well-known potential cardiovascular risk factor. 5 TSH is a hormone produced by the anterior pituitary gland that affects the thyroid by increasing blood flow and stimulating tissue growth and, thus, affects the body’s metabolism as a whole. 6,7 Patients with thyroid carcinoma undergo surgical removal of the thyroid and radioiodine ablation, after which they require supplemental hormones. Without this supplementation, thyroid hormone levels drop and TSH levels rise, potentially stimulating leftover thyroid cells and causing proliferation of the tumor. 8 Giving excess thyroid hormones causes TSH levels to become suppressed, with the intention of reducing the potential risk of recurrence. This iatrogenic subclinical hyperthyroidism, however, has adverse effects.
Higher levels of thyroid hormone increase the basal metabolic rate of tissues, as well as increasing glucose uptake, glycolysis, gluconeogenesis, and tissue blood flow. 6,9 Thyroid hormones have also been shown to elevate the expression of glucose transporters in muscles, liver, and, in some models, in the brain, 10 –12 and it has been observed that subclinical hyperthyroidism might lower bone mineral density. 13
Some studies have shown a relationship between cardiovascular morbidity and mortality and increased thyroid hormone levels. 4,14 In particular, high levels of free thyroxine (fT4) have an adverse effect on large arteries and on aortic stiffness. 4,15 Other CVD-related side effects of TSH suppression include prothrombotic effects, increased incidence of atrial fibrillation, and increased left ventricular mass. 15 –17 Therefore, clinical practice guidelines and studies suggest a personalized approach, in which the side effects of TSH suppression are weighed against the risk of tumor recurrence. 4,18,19
[18F]fluorodeoxyglucose (FDG)-positron emission tomography (PET)/computed tomography (CT) scans have become a key imaging technique with which to analyze vascular inflammation by visualizing heightened metabolic activity of vascular plaques. [18F]FDG is a radioactive glucose analog that is taken up by cells and accumulates in regions of increased metabolic activity. In atherosclerosis, a progressive inflammatory response of the vascular wall, 20 [18F]FDG-uptake has been linked to the macrophage content of vascular plaques, indicating vessel wall inflammation and correlating with CVD development. 21 –24
In this study, we aimed to investigate the impact of TSH suppression on arterial inflammation, utilizing [18F]FDG-PET/CT scans for assessment. We conducted a retrospective analysis of data from 40 patients with differentiated thyroid cancer (DTC) who underwent PET scans during periods of TSH suppression and compared this with a control group of 25 patients with euthyroid hormone status. In addition, to evaluate long-term changes, follow-up [18F]FDG-PET/CTs of 24 thyroid carcinoma patients, with a mean duration of 1.9 ± 1.1 years between the two scans, were analyzed.
Methods
Patients
In this retrospective case–control study, [18F]FDG-PET/CT scans of 40 patients with suppressed TSH and 25 patients with euthyroid hormone status at the time point of the scan were analyzed (Fig. 1).
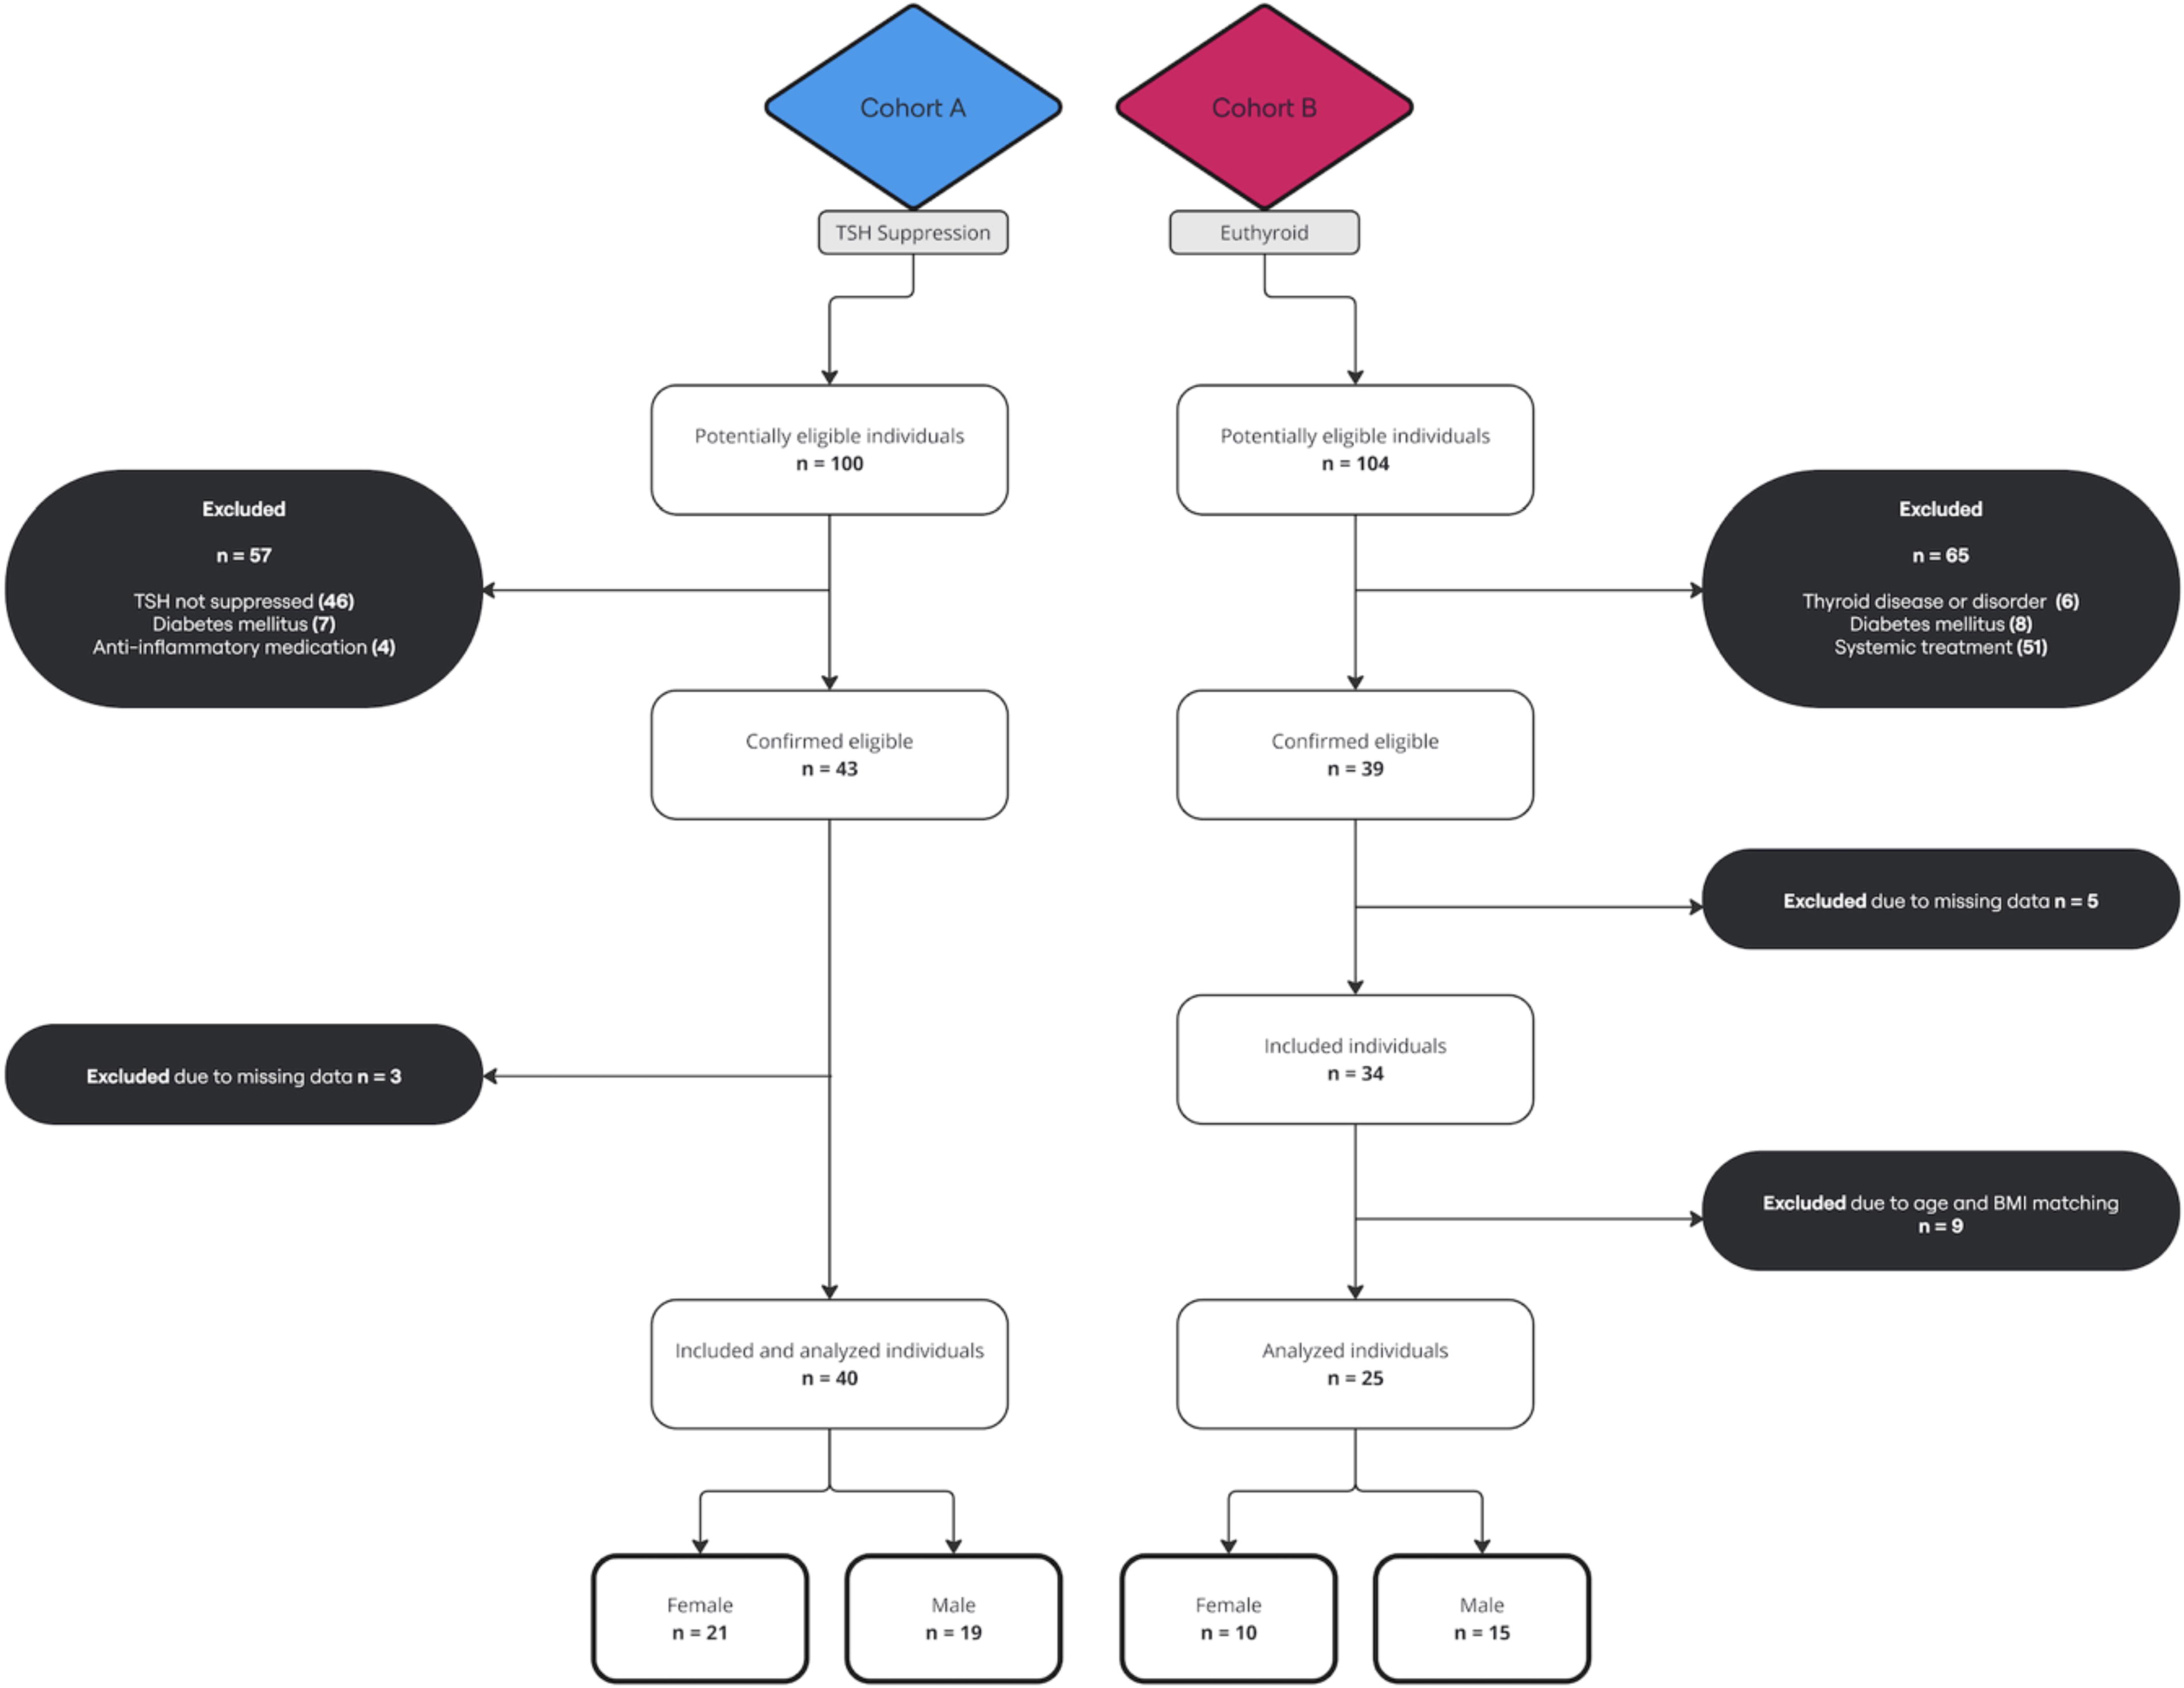
Participant flow diagram.
In cohort A, 100 patients who were treated initially for DTC in the Division of Nuclear Medicine at the Vienna General Hospital from January, 1, 2016 to December, 31, 2020 and who received [18F]FDG-PET scans were eligible. Every patient received total thyroidectomy and radioiodine ablation as part of their treatment for DTC. At our institution, the routine dose activity administered for ablation during the study period ranged from 2960 MBq to 7400 MBq, depending on factors such as patient risk stratification, remnant thyroid tissue volume, and presence of distant or nodal metastases. Patients with any history of systemic therapy (except radioiodine ablation), including chemotherapy, tyrosine kinase inhibitor and anti-inflammatory medication, or diabetes mellitus, with a euthyroid status, as well as lacking PET imaging data, were excluded (n = 60). All PET scans in cohort A were conducted due to the clinical suspicion of the recurrence of thyroid cancer. Follow-up scans were performed exclusively in patients who exhibited disease progression or who were undergoing reassessment due to clinical suspicion of recurrence.
In cohort B, 104 patients who received [18F]FDG-PET scans in the Division of Nuclear Medicine at the Vienna General Hospital from January 1, 2020, to January 7, 2024, for research purposes, or for initial staging, or for suspicion of bladder and prostate cancer were eligible. Patients with any history of thyroid disease or diabetes mellitus and any systemic treatment, including chemotherapy, tyrosine kinase inhibitor, anti-inflammatory medication, or other medication that could possibly interfere with thyroid hormones, were excluded (n = 65). Cohort B was matched to cohort A according to age and body mass index, thereby ensuring comparability between the groups and minimizing the influence of these variables on the study outcomes (n = 9 excluded). Five patients were excluded due to missing PET imaging data. The final cohort B consisted of 25 patients, including 15 patients with the clinical absence of known systemic diseases, seven patients with treatment-naive prostate cancer, one patient with treatment-naive bladder cancer, one patient with treatment-naive gastric cancer, and one patient with treatment-naive celiac disease. The 15 patients already mentioned, who did not have any significant underlying health conditions, underwent PET scans solely for research purposes (EK: 1707/2022). The remaining 10 patients in cohort B were all at the initial stage of their respective diseases and had not undergone any systemic therapy treatment prior to the examination.
The Ethics Committee of the Medical University of Vienna (EK: 1640/2023) approved this study, and written informed consent was waived for data collection and analysis due to the retrospective design of the study.
PET/CT examinations
All whole-body [18F]FDG PET/CT scans were conducted from the skull base to the thigh approximately 60 minutes after the tracer injection using either a Siemens Biograph TruePoint TrueView or a Siemens Biograph 128 Vision Quadra Edge PET/CT-scanner (Siemens Healthineers, Erlangen, Germany). PET examinations were performed with a duration of 4 minutes per bed position, using iterative reconstruction with a point-spread-function-based algorithm. Subsequently, scatter and attenuation corrections were then applied based on the CT scan. When using the Siemens Biograph TruePoint TrueView with a PET matrix size of 168 × 168, CT scans were conducted using the following parameters: 120 kV; 200–220 mAs; 5 mm slice thickness; and a B19s reconstruction kernel. When using the Siemens Biograph 128 Vision Quadra Edge with a PET matrix size of 220 × 220, CT scans were performed with the following parameters: 120–140 kV; 30–40 mAs; 2 mm slice thickness; and a Br32f reconstruction kernel.
Image analysis
The Hybrid 3D software (version 4.17, Hermes Medical Solutions, Stockholm, Sweden) was utilized for image analysis.
PET image intensities (Bq/mL) were converted to standardized uptake values (SUVs) and normalized to the body weight. Two experienced nuclear medicine physicians used the axial section plane to determine the SUVmean- and SUVmax-values in certain vessels and organs. Regions of interest (ROIs) were manually drawn in the abdominal aorta, thoracic ascending aorta, aortic arch, thoracic descending aorta, and carotid artery, delineating the entire artery, including the arterial wall and lumen, as can be seen in the Supplementary Fig. S1. A cuboidal volume of interest (VOI) with a target size of 1.60 mL was placed in the superior cava vein (SCV) and a target size of 13.50 mL was used in the spleen and bone marrow. ROIs were not set when activities of nearby structures, such as metastatic lesions, spilled into the vessel or organ. To normalize all results, PET parameters, including SUVmean and SUVmax, were divided by the SUVmean of the cuboid VOI placed in the SCV. To minimize potential bias, training was conducted to align the methods of the two nuclear medicine physicians who performed the delineation.
Moreover, CT was used to evaluate and detect the extent of calcification in the different arterial segments. Calcified plaques (CPs) were assessed, therefore, semi-quantitatively using a scale previously published: 25 0 = no sign of CP in the artery circumference; 1 = plaques <10% of the artery circumference; 2 = plaques 10%−25% of the artery circumference; 3 = plaques 25%−50%; and 4 = plaques >50% of the artery circumference.
Data collection
Allgemeines Krankenhaus Information Management was used to extract all necessary laboratory parameters, lifestyle factors, and current therapies.
Statistical analysis
Statistical analyses were performed with IBM Mac SPSS Version 28. Descriptive variables were expressed as mean (±standard deviation (SD)), as median (minimum; maximum), or as absolute numbers (n). Group comparability of the two cohorts was assessed by comparing the baseline demographics. Normality and heteroscedasticity of continuous data were assessed and calculated using the Shapiro–Wilk test and the Levene test.
Categorical data across groups were compared using the χ2 test. Spearman’s correlation coefficient was applied to examine the relationship between laboratory results and target-to-background ratios (TBRs). According to the data distribution, the Mann–Whitney U test was used to compare continuous outcomes. To further quantify the difference between the two cohorts, 95% confidence intervals (CIs) using the Hodges–Lehmann estimator were calculated. Longitudinal analyses were performed using a paired t test. A p value of <0.05 was determined to be statistically significant. In addition, boxplots were created to illustrate the different SUV values of all included arteries in both cohorts. A scatterplot was constructed to visualize the longitudinal analyses. In this study, missing data were handled using pairwise deletion, excluding only cases with missing values for specific variables.
Results
The demographic and clinical characteristics of DTC patients under TSH suppression and euthyroid control patients are demonstrated in Table 1. Significant differences were necessarily determined in TSH and fT4 (both p < 0.01). Among all DTC patients, disease recurrence was proven in 14 patients, including 3 patients with locoregional recurrence, 3 patients with cervical lymph nodes, 4 patients with both cervical lymph nodes and locoregional recurrence, and 4 patients with distant metastases, involving the lung, liver, or bones.
Demographic Characteristics of TSH-Suppressed and Euthyroid Patients
BMI, body mass index; CRP, C-reactive protein; DTC, differentiated thyroid cancer; LDL, low-density lipoprotein; n, number of patients; SD, standard deviation; TSH, thyroid-stimulating hormone.
Comparison of DTC patients under TSH suppression with euthyroid control patients
As shown in Figure 2 and Table 2, when comparing DTC patients after a mean duration of 3.8 (±2.6) years of TSH suppression to euthyroid individuals, statistically different TBRmean-values were observed between groups in the following locations: ascending aorta (95% CI: 0.059–0.172, p < 0.001), aortic arch (95% CI: 0.029–0.112, p < 0.001), abdominal aorta (95% CI: 0.129–0.275, p < 0.001), carotid artery (95% CI: 0.122–0.343, p < 0.001), and all arterial vessels combined (95% CI: 0.088–0.185, p < 0.001). The difference in TBRmean-values in the thoracic descending aorta did not reach statistical significance (95% CI: −0.001–0.128, p = 0.054).
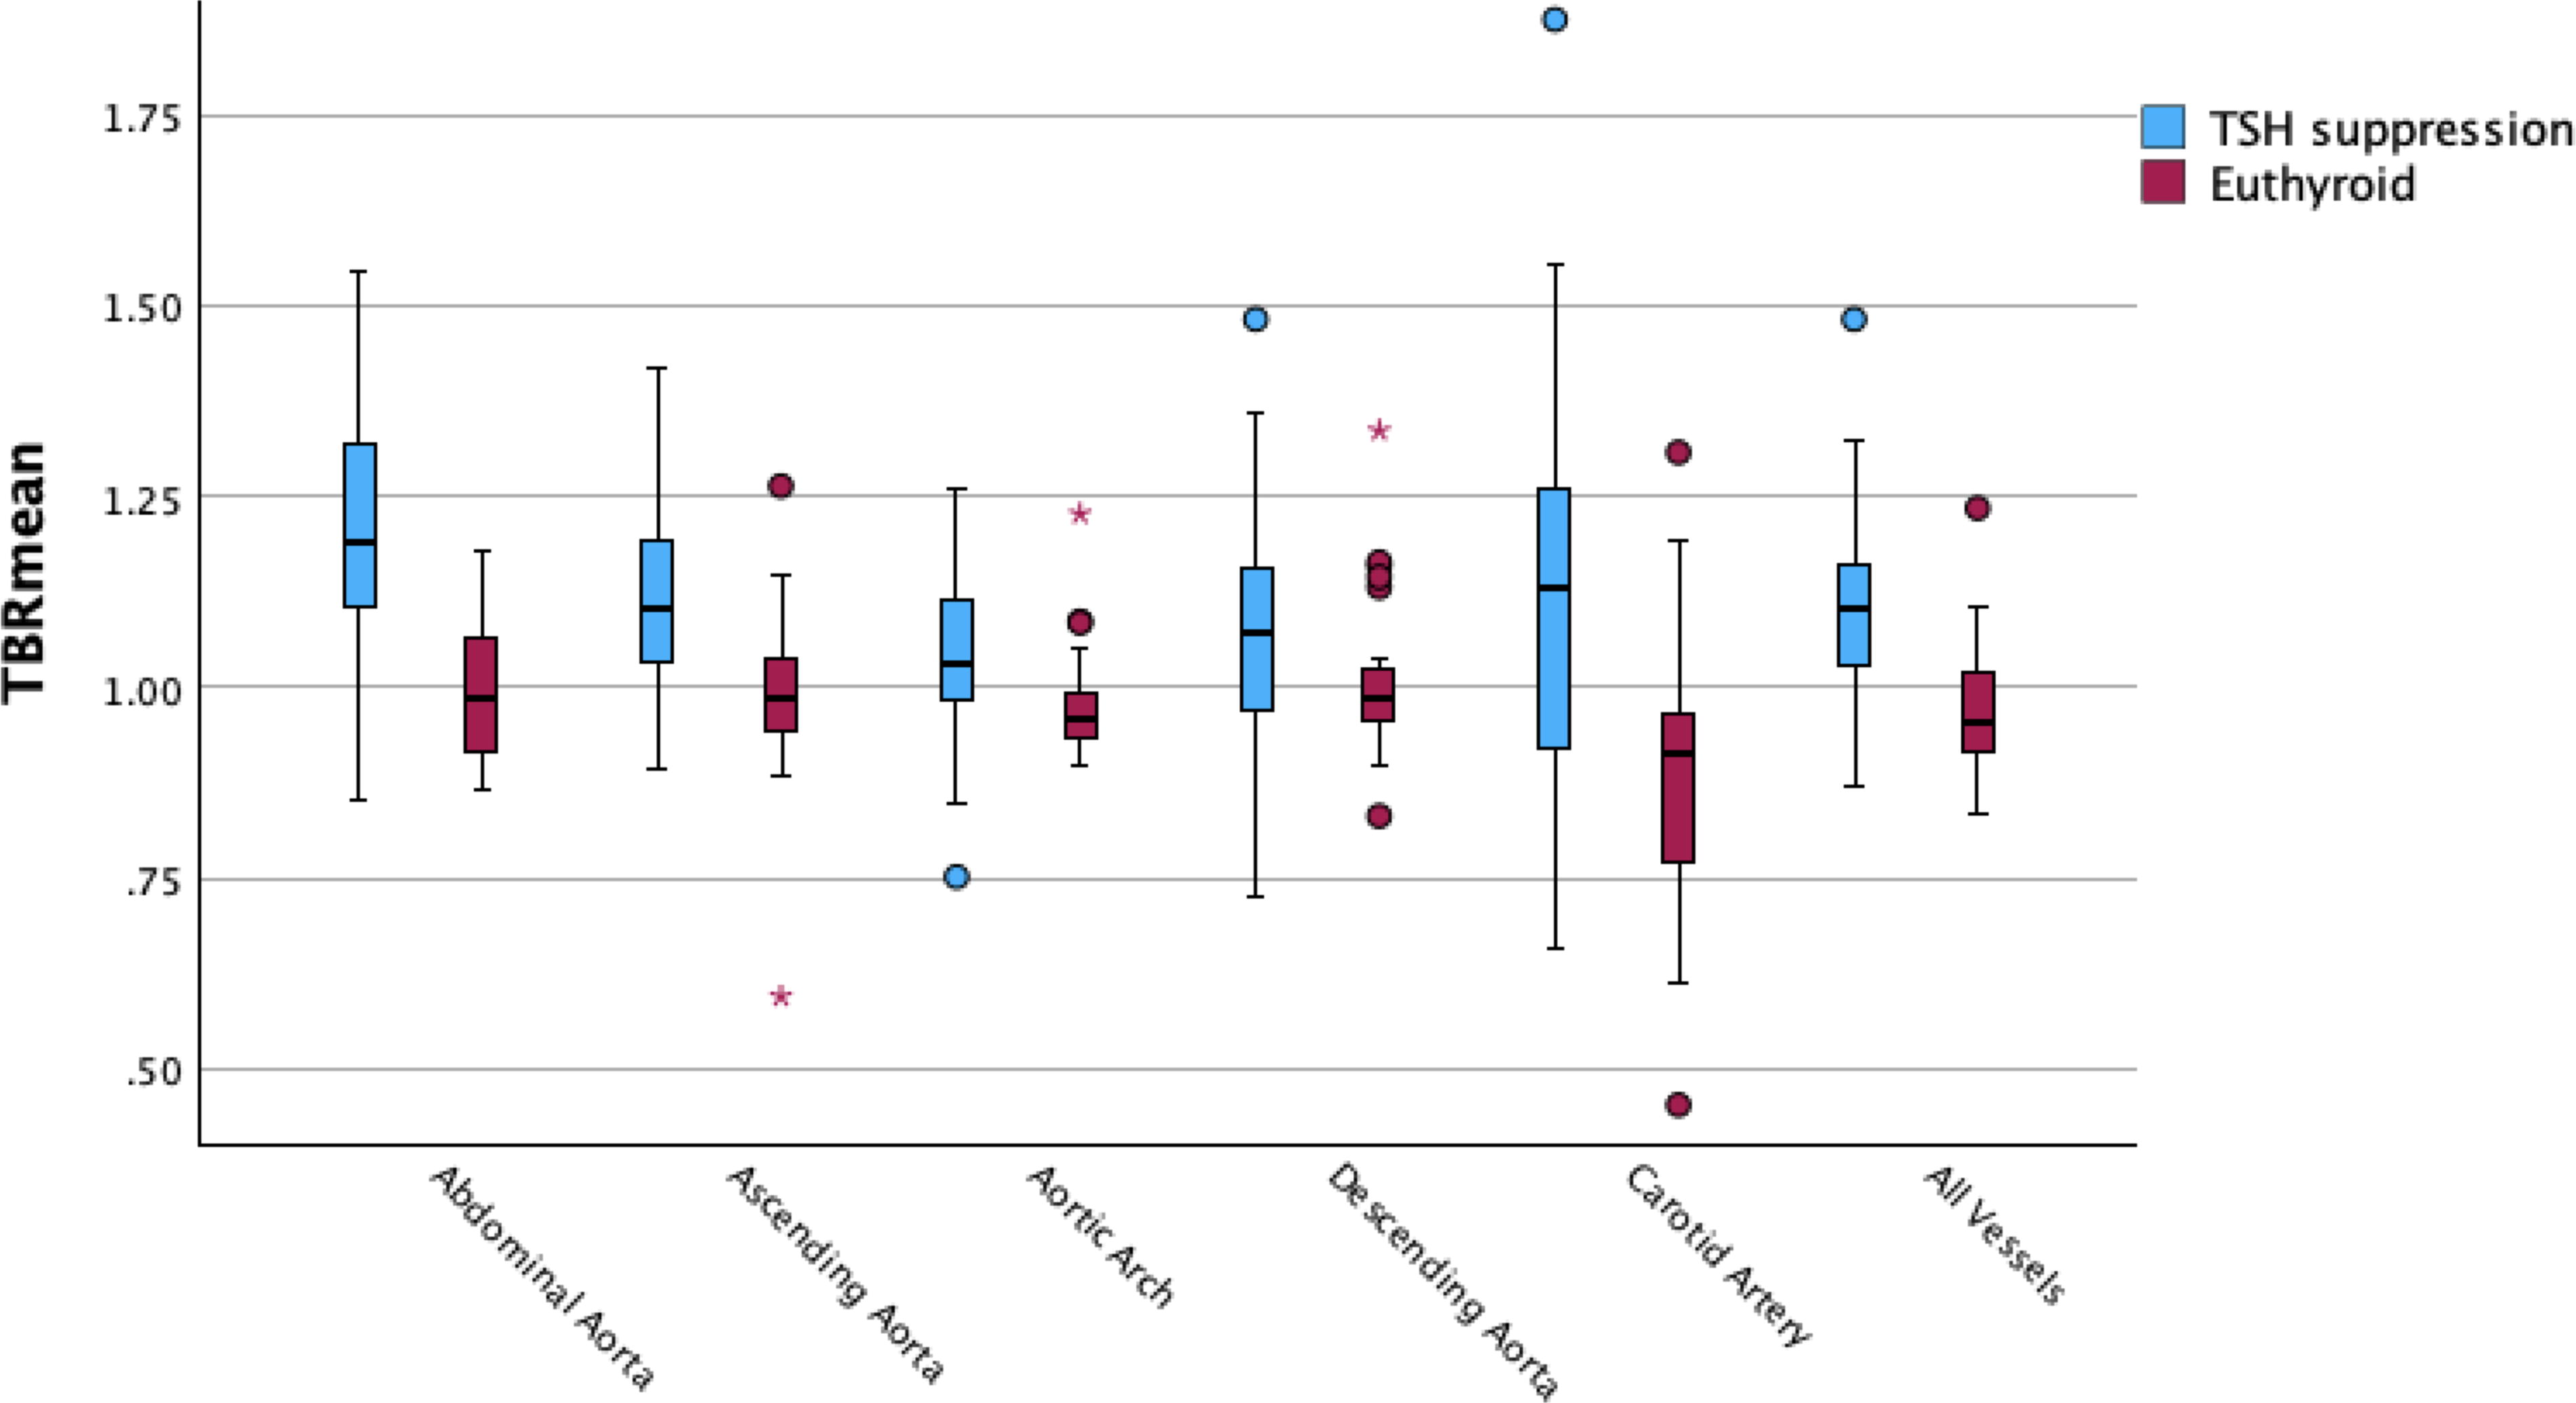
Boxplots with TBRmean-values of all included arteries in TSH-suppressed and euthyroid patients. TBR, target-to-background ratio; TSH, thyroid-stimulating hormone.
[18F]FDG-Uptake (TBRmean and TBRmax) Values of All Patients Under TSH Suppression and of Euthyroid Patients
Values presented as mean (±standard deviation).
Significant differences (p < 0.05) between all TSH-suppressed and euthyroid patients.
CT, computed tomography; DTC, differentiated thyroid cancer; FDG, fluorodeoxyglucose; n, number of patients; PET, positron emission tomography; TBR, target-to-background ratio; TSH, thyroid-stimulating hormone.
As shown in Figure 3 and Table 2, when comparing TSH-suppressed thyroid cancer patients with euthyroid individuals, significantly different TBRmax-values were observed between groups in the ascending aorta (95% CI: 0.246–0.502, p < 0.001), aortic arch (95% CI: 0.193–0.435, p < 0.001), thoracic descending aorta (95% CI: 0.229–0.460, p < 0.001), abdominal aorta (95% CI: 0.339–0.611, p < 0.001), carotid artery (95% CI: 0.152–0.406, p < 0.001), and all arterial vessels combined (95% CI: 0.280–0.452, p < 0.001).
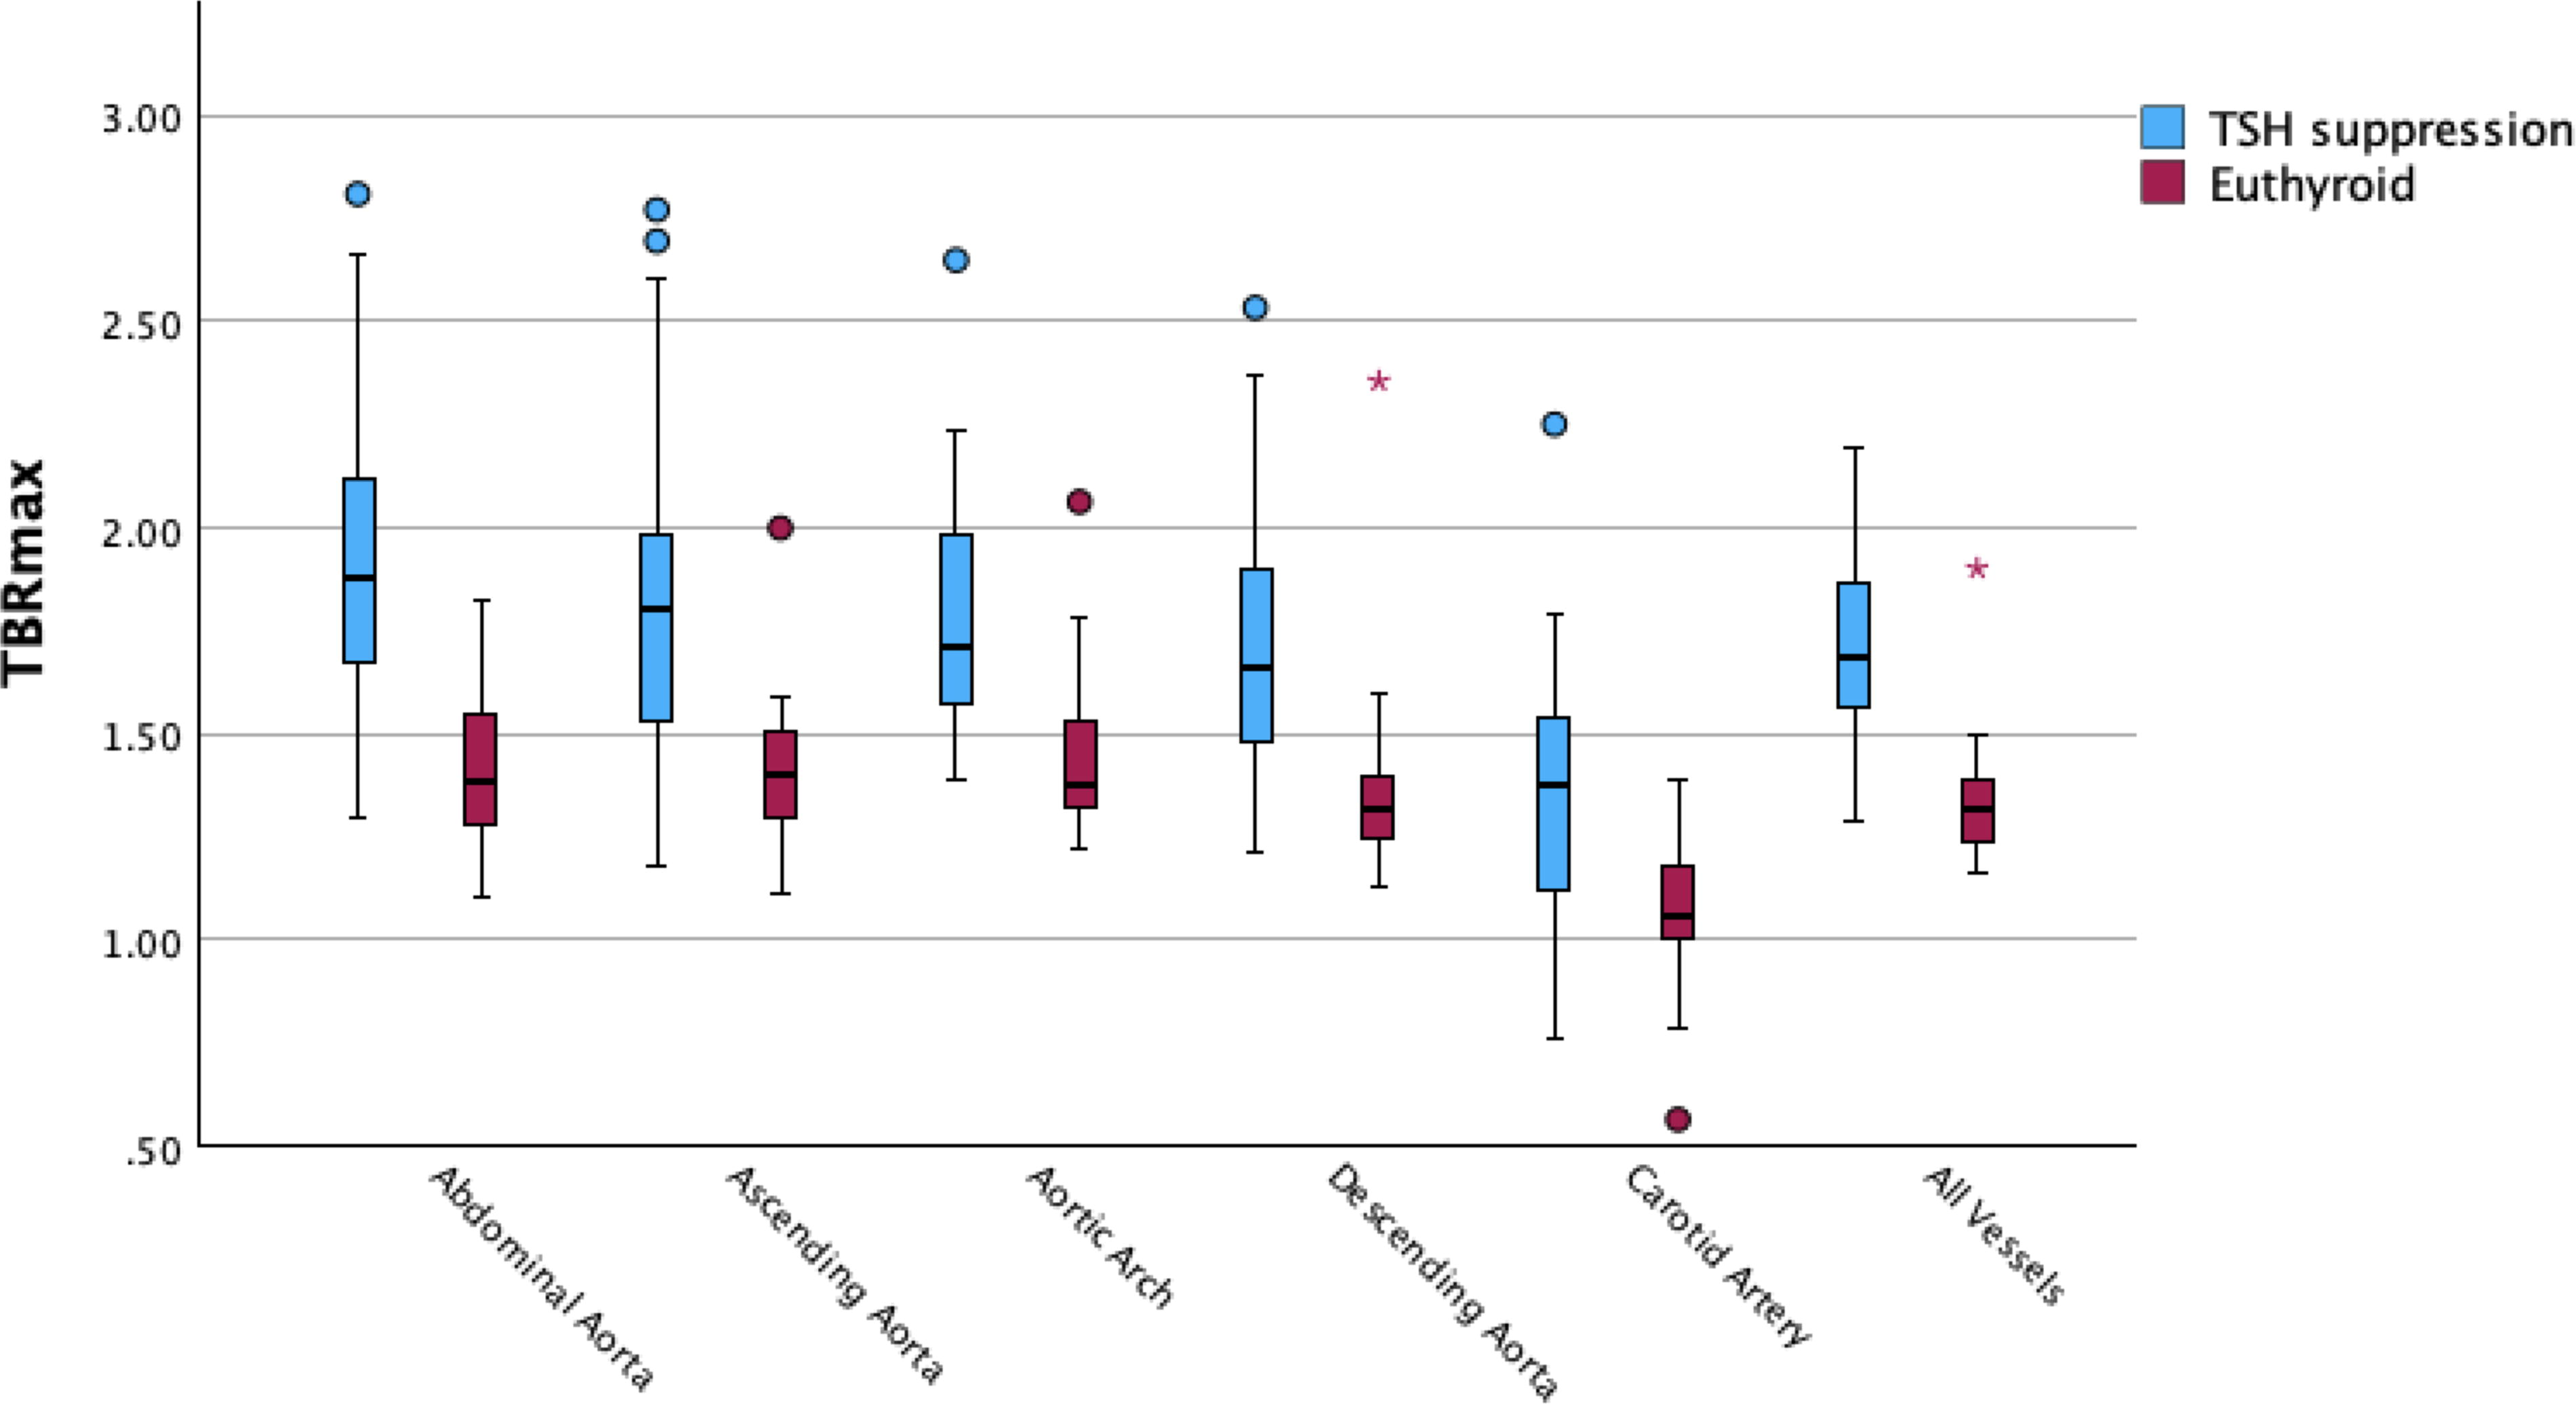
Boxplots with TBRmax-values of all included arteries in TSH-suppressed and euthyroid patients. TBR, target-to-background ratio; TSH, thyroid-stimulating hormone.
No statistically significant differences between groups were observed in the TBRmean- and TBRmax-values in the spleen (95% CI: −0.092–0.068, p = 0.80; 95% CI: −0.089–0.256, p = 0.43, respectively) (p = 0.80; p = 0.43) or in the bone marrow (95% CI: −0.042–0.206, p = 0.17; 95% CI: −0.088–0.553, p = 0.18, respectively).
Comparison of male and female patients within all DTC patients under TSH suppression
In addition, we also examined sex-related differences in [18F]FDG-uptake within the TSH-suppressed cohort. When comparing male with female DTC patients under TSH suppression, no significantly different TBRmean- and TBRmax-values were observed when all arterial vessels were combined together (95% CI: −0.140–0.018, p = 0.09; 95% CI: −0.172–0.139, p = 0.90, respectively).
Longitudinal analysis in DTC patients under TSH suppression who underwent multiple [18F]FDG-PET/CT scans
In a subgroup of DTC patients with TSH suppression who received two [18F]FDG-PET/CT scans, the mean duration of TSH suppression was 2.9 ± 2.3 years at the time of the first scan and an additional 1.9 ± 1.1 years of TSH suppression before the follow-up scan. The demographic and clinical characteristics of this subgroup are reported in Table 3. No statistically significant changes over time were observed in TBRmean and TBRmax in vessels, spleen, or bone marrow (Table 4).
Demographic Characteristics of the TSH-Suppressed Differentiated Thyroid Cancer Patient Subgroup with a Follow-Up [18F]FDG-PET Scan After Prolonged TSH Suppression
BMI, body mass index; CRP, C-reactive protein; FDG, fluorodeoxyglucose; LDL, low-density lipoprotein; n, number of patients; PET, positron emission tomography; SD, standard deviation; TSH, thyroid-stimulating hormone.
TBRmean and TBRmax of the Subgroup of Differentiated Thyroid Cancer Patients Under TSH Suppression with a Second [18F]FDG-PET Scan After Prolonged TSH Suppression
Values presented as mean (±standard deviation); all p > 0.05.
CT, computed tomography; FDG, fluorodeoxyglucose; n, number of patients; PET, positron emission tomography; TBR, target-to-background ratio; TSH, thyroid-stimulating hormone.
A scatterplot in the Supplementary Figure S2 offers a more illustrative overview.
Correlation between TBRs and laboratory parameters
We examined the relationship between the mean TBRmean and mean TBRmax values of all arteries combined for each patient and for various laboratory parameters. When combining both cohorts of this study, TSH, fT4, and total cholesterol blood levels correlated significantly with the mean TBRmean (Spearman rho ρ = −0.480, 0.639, −0.372, all p < 0.05, respectively) and the mean TBRmax (Spearman rho ρ = −0.557, 0.757, −0.350, all p < 0.05, respectively).
However, when the two cohorts were separated, significant correlations were found only between mean TBRmax and fT4 in cohort A (Spearman rho ρ = 0.480, p < 0.05) and mean TBRmax and total cholesterol blood levels in cohort B (Spearman rho ρ = −0.471, p < 0.05). No other significant correlations between laboratory parameters and the TBRs were determined when the cohorts were separated.
CP score
We quantified the extent of calcification within both groups, using the CP score. The mean summed CP scores of all included vascular segments in TSH-suppressed and euthyroid patients were 3.7 and 3.3 (p = 0.281), respectively. Interestingly, there was a trend toward higher mean summed CP scores after prolonged TSH suppression within the subgroup who received follow-up [18F]FDG-PET/CT scans (first scan: 4.04 ± 3.6; follow-up scan: 4.58 ± 3.5; p = 0.079).
Discussion
In this retrospective case–control study, we observed that arterial [18F]FDG-uptake is elevated in DTC patients under TSH suppression compared with the euthyroid control patients. This finding suggests a higher risk of CVD and the development of atherosclerotic plaques in DTC patients with suppressed TSH levels. Notably, the duration of TSH suppression does not seem to significantly impact the progression of arterial inflammation but shows a trend toward higher arterial calcification.
As per standard procedure for the assessment of vessel wall inflammation, we used arterial [18F]FDG-uptake corrected for the [18F]FDG blood pool activity as our endpoint. The [18F]FDG activity of the vessel wall was measured using ROIs. These were defined to encompass the entire vessel wall, including the lumen. Due to the limited resolution of PET/CT scans, the [18F]FDG activity inside the lumen plays a substantial role in determining vessel wall activity. To correct for the inherent background activity inside blood vessels, the blood pool activity in the SCV was used as background correction, creating a TBR. This corrected for spill-in and spill-out artifacts, standardizing the PET imaging protocol, 26,27 as well as correcting for likely fluctuations in blood pool activity caused by the increased distributional spread of [18F]FDG in patients with hyperthyroidism. 6,9 –11 To account for variations in injected activity, patient weight, and decay of the radionuclide, SUVs were used.
Earlier research has primarily investigated the harmful effects of hypothyroidism on atherosclerosis. 28 –30 Previous studies have shown that hypothyroidism increases the risk of initiating and advancing atherosclerosis by worsening cardiovascular risk factors, such as hypertension and dyslipidemia. 29,30 In addition, subclinical hypothyroidism has been associated with increased systemic low-grade inflammation, as indicated by higher C-reactive protein (CRP) and interleukin levels, compared with euthyroid states. Atherosclerotic plaques in the carotid arteries of these patients also had a higher macrophage content than those of euthyroid patients. 31 Further, in vitro studies suggest a potential anti-inflammatory role of thyroid hormones by, for instance, a reduction in the migration of bone marrow-derived monocytes to inflammatory sites. 28,32
Conversely, our study’s findings suggest a proinflammatory effect associated with TSH suppression in DTC patients. Arterial [18F]FDG-uptake was significantly higher in all but one of the major arteries in patients in the iatrogenic subclinical hyperthyroid state compared with the control group in the euthyroid state. This implies that there is an underlying mechanism responsible for the increase in vascular wall inflammation. Preclinical studies have shown direct effects of thyroid hormones on the vascular wall. For instance, thyrotoxic rats exhibited markers of oxidative stress, lipid peroxidation, and increased arterial stiffness due to alterations in vascular smooth muscle cells, elastin, and collagen content. 33,34 Other studies showed that patients with Graves’ disease-related hyperthyroidism showed elevated endothelial activation markers 35,36 and increased carotid intima-media thickness. 37
In DTC patients, some studies have shown a relationship between cardiovascular morbidity and mortality and increased thyroid hormone levels. 4,14 Clinical studies also associate altered thyroid hormone levels with various CVD and atherosclerosis indicators. 38,39 For instance, elevated free thyroxine (fT4) correlates with greater arterial stiffness, 40 and low TSH levels are related to increased carotid intima-media thickness. 38 A large population study found that, perplexingly, there is an inverse association between TSH and coronary artery calcium (CAC) scores in euthyroid patients—meaning that low TSH levels were linked to higher levels of CAC. This suggests that low TSH levels may influence atherosclerosis through distinct mechanisms, given the presence of TSH and thyroid hormone receptors in vascular smooth muscle cells. 39 Although this study focused on individuals with euthyroid hormone levels, these findings suggest that altered thyroid hormone levels might contribute to atherosclerosis.
Previous studies have demonstrated that measuring arterial [18F]FDG-uptake improves the prediction of CVD 22 and future cardiovascular and cerebrovascular events. 41 Another study found that increased arterial [18F]FDG-uptake is associated with an increased risk of future cardiovascular and cerebrovascular events in tumor patients. 42 Although no direct causal link has been established, the increased arterial [18F]FDG-uptake observed in TSH-suppressed patients in our study raises the possibility that TSH suppression may contribute to an elevated CVD risk profile. Building on this general context, a large international multicenter trial is currently underway to evaluate the prognostic value of arterial [18F]FDG-imaging in predicting clinically significant cardiovascular events. 43
Prior research has also established that elevated CRP levels are significantly correlated with an increased risk of subsequent cardiovascular events and with arterial [18F]FDG-uptake. 44,45 Elevated thyroid hormones may upregulate the expression of proinflammatory cytokines and adhesion molecules. While we did not observe statistically significant differences in CRP levels between the groups, there was a trend toward elevated CRP in patients undergoing TSH suppression (p = 0.061; Table 1). This aligns with findings from prior research, 5 suggesting a potential association between TSH suppression and increased inflammatory markers. However, histological evidence confirming that the increased arterial [18F]FDG-uptake was due to specific changes, such as a higher macrophage presence in the vascular wall or macrophage activation, was not obtained.
Previous studies have also shown that hematopoietic organs are involved in the systemic inflammatory response in atherosclerosis, as there is a correlation between arterial inflammation and [18F]FDG-uptake in the spleen and bone marrow. 46,47 Another previous study that investigated both the influence of hypothyroidism and TSH suppression on vascular inflammation found significantly higher bone marrow TBRs in patients during their TSH suppression state compared with the hypothyroid state. 5 However, in our study, this increased [18F]FDG-uptake in hematopoietic organs was not shown. There was no statistically significant difference in the TBRmean- and TBRmax-values in the spleen (p = 0.80; p = 0.43) or in the bone marrow (p = 0.17; p = 0.18, respectively). This suggests there might be another underlying mechanism leading to increased arterial [18F]FDG-uptake in TSH-suppressed patients.
Furthermore, we observed no significant difference in the traditional risk factors for CVD in the TSH suppression group compared with the euthyroid control group. There was also no significant difference in vascular calcification between the two groups, assessed semiquantitatively using the mean summed CP score, as previously published. 25
Interestingly, we observed that the duration of TSH suppression did not significantly affect vascular wall activity. The mean duration of TSH suppression in the subgroup was 2.9 ± 2.3 years at the time of the first scan, with 1.9 ± 1.1 years of TSH suppression before the follow-up scan. One possible explanation for the lack of effect on vascular wall [18F]FDG-uptake could be the relatively short duration of TSH suppression in our cohort, which may not have been sufficient to produce detectable changes in the vessel wall. Future studies with longer follow-up periods may help clarify the impact of prolonged TSH suppression on vascular changes. In addition, the lack of a relationship between the duration of TSH-suppressive therapy and [18F]FDG activity in the vessel wall could be explained by a plateau effect. It is possible that the impact of TSH suppression may reach a threshold at which prolonged therapy has no additional effect, perhaps due to desensitization of arterial tissue to TSH or possibly due to activation of compensatory anti-inflammatory mechanisms; however, further research is needed to clarify the exact mechanisms involved.
Our study, in agreement with a single previous study, showed that TSH suppression increases arterial [18F]FDG-uptake, 5 suggesting that there is some mechanism in atherosclerotic plaque progression that has typically been linked only to hypothyroidism. 29,30 The exact mechanism behind the increased arterial [18F]FDG-uptake during TSH suppression remains to be determined.
Iatrogenic subclinical hyperthyroidism has adverse effects. DTC clinical practice guidelines and studies suggest a personalized approach, weighing the side effects of TSH suppression against the risk of tumor recurrence. 4,18,19 In addition, it has been suggested that DTC patients might not benefit from TSH suppression, 48 and the optimal duration of TSH suppression remains unclear, as there is insufficient evidence regarding its efficacy, impact on quality of life, and adverse effects.
Limitations
This study has several limitations that need to be considered. First, the small sample size and the retrospective design limit the statistical power and generalizability of these findings. Second, there is a lack of long-term data on cardiovascular events to support the hypothesis that the increased arterial [18F]FDG-uptake in TSH-suppressed patients is actually linked to higher CVD risk. A prospective study with a larger cohort is needed to rectify this. Third, although the control group was selected carefully, our control group was substantially different in terms of not having suspected recurrent thyroid cancer. The study could be more robust if the explored cohort served as its own control group, allowing for a more direct comparison of outcomes. Furthermore, the ROIs and VOIs were placed manually. To improve accuracy and consistency in future studies, artificial intelligence-based methods could be employed for automated and precise delineation of blood vessels, reducing subjectivity. This would also facilitate the analysis of larger study populations. Another limitation is that not all desired information was available for all included patients due to the study’s retrospective design. A dedicated questionnaire in a prospective study design could rectify this.
Conclusion
This study highlights the association between TSH suppression and increased vascular [18F]FDG-uptake in DTC patients, suggesting a potential association with vascular inflammation. However, the evidence linking TSH suppression to atherosclerosis or CVD risk remains circumstantial. Further studies are needed to better understand whether this association contributes to increased CVD risk or cardiovascular mortality and to inform clinical management of DTC patients with regard to TSH suppression.
Footnotes
Authors’ Contributions
H.E. and B.H.: Conception and design; collection and assembly of data; data analysis; data interpretation; article writing; and final approval of article. B.R. and H.K.: Collection and assembly of data and final approval of article. M.H. and G.K.: Conception and design; data interpretation; and final approval of article. H.E., B.H., B.R., H.K., M.H., and G.K.: Responsibility for the integrity of the data and accuracy of the analysis.
Author Disclosure Statement
The authors have no conflicts of interest to disclose and no competing financial interests exist.
Funding Information
The authors received no funding.
Supplementary Material
Supplementary Figure S1
Supplementary Figure S2