
Abstract
Background:
Epidemiological data suggest the population distribution of thyrotropin (TSH) values is shifted toward lower values in self-identified Black non-Hispanic individuals compared with self-identified White non-Hispanic individuals. It is unknown whether genetic differences between individuals with genetic similarities to African reference populations (GSA) and those with similarities to European reference populations (GSE) contribute to these observed differences. We aimed to compare genome-wide associations with TSH and putative causal TSH-associated variants between GSA and GSE groups.
Methods:
We performed genome-wide association studies (GWAS) in 9827 GSA individuals and 9827 GSE individuals with TSH values between 0.45 and 4.5 mU/L. We compared effect sizes and allele frequencies of previously reported putative causal TSH-associated variants and our power to detect associations with these variants between the two groups. We additionally focused on variants in PDE8B and PDE10A, loci that have been most strongly associated with TSH in previous GWAS in GSE populations.
Results:
Four loci attained genome-wide significance in the GSA group compared with seven in the GSE group. PDE8B was not significantly associated with TSH in the GSA group, despite its strong association in the GSE group. Eight putative causal variants had significantly different effect sizes between groups. There was ≥80% power in the GSA group to detect significant associations with variants in PDE8B, PDE10A, NFIA, and LOC105377480, with higher expected power than in the GSE group for variants in PDE8B, NFIA, and LOC105377480 and similar power for other variants in PDE8B and PDE10A. No additional putative causal variants in PDE8B and PDE10A had effect sizes that differed significantly between the groups; power to identify associations with additional putative causal variants in PDE8B and PDE10A was similar between the groups.
Conclusions:
Patterns of genetic associations with TSH differed between identically sized GSA and GSE groups. Failure to replicate the strongest associations previously reported in GSE individuals in our GSA population was not fully explained by differences in allele frequencies or power, assuming similar effect sizes. Larger GSA population GWAS are necessary to confirm our findings and further investigate the contribution of genetic factors to population differences in the distribution of TSH values.
Introduction
Thyroid dysfunction is common, occurring in approximately 10% of the general population. It is primarily diagnosed when thyrotropin (TSH) is outside of a reference range based on the 2.5th and 97.5th percentiles of TSH distribution in a population without thyroid disease or factors likely to affect thyroid function. Epidemiological data from the National Health and Nutrition Examination Survey (NHANES) suggest that there is a shift in the distribution of TSH toward lower values in self-identified Black, non-Hispanic individuals compared with self-identified White, non-Hispanic individuals (0.35–3.63 vs. 0.49–4.18 mU/L). The clinical significance of this distribution shift is not known, but it may impact rates of diagnosis of thyroid dysfunction. 1
The observed differences in TSH distribution in NHANES in individuals of different self-identified racial and ethnic groups were not explained by environmental factors such as geographic location, socioeconomic status, or urbanicity. Up to 65% of the TSH variation between individuals is heritable, 2 raising the possibility that the genetic factors that influence TSH values may differ between individuals that share genetic similarity with African reference populations (GSA) and those that share similarity with European reference populations (GSE). To date, investigations of genetic associations with TSH have been conducted almost exclusively in GSE individuals, 3 –6 except for a single study that included 351 GSA individuals. 7 Studies in GSE individuals have identified strong and consistent associations with PDE8B and PDE10A, which encode proteins that hydrolyze cyclic adenosine 3′,5′-monophosphate (cAMP), the intracellular second messenger of TSH, but none of the 87 suggestive variants identified in the 351 GSA individuals were in PDE8B or PDE10A. Two variants in PDE8B, two upstream of IGFBP5 and one in ABO, which were significantly associated in the GSE group in that study, generalized in the GSA group (defined as consistent direction and magnitude of effect with a p value < 0.05), but over 80% of the associations in the GSE group did not generalize. Of all the associated variants in GSE populations reported in the literature prior to that association study, 25% generalized to the GSA group, including one variant in PDE8B. The GSA sample size in that study was too small to identify genome-wide associations with TSH and it therefore remains unknown whether genetic variants associated with TSH values, and their effect sizes, differ between GSA and GSE populations.
We used novel data from South African community and United States biobank GSA populations to test our hypothesis that the population shift in the distribution of TSH values may be explained, at least in part, by differences in its genetic determinants. We compared genome-wide associations with TSH values between GSA and GSE individuals and investigated whether observed differences in associations were explained by differences in effect size, allele frequency, or statistical power.
Materials and Methods
Study settings and participants
Study participants were selected from three cohorts: a self-identified Black South African population from the Africa Wits-INDEPTH partnership for Genomic Studies (AWI-Gen), 8 the Penn Medicine BioBank at the University of Pennsylvania (PMBB), 9 and BioVU, the biorepository at Vanderbilt University. 10 Characteristics of the included cohorts are shown in Supplementary Table S1.
AWI-Gen participants
The AWI-Gen study has been previously described. 8 In summary, individuals ≥40 years and permanently resident in the Agincourt Health and socio-Demographic Surveillance System in Mpumalanga province, South Africa 11 were randomly selected to participate in Health and Aging in Africa: A Longitudinal Study in an INDEPTH community (HAALSI), 12 with 5059 of the 6281 eligible individuals enrolling in the study cohort. A subset of 2486 individuals subsequently enrolled in the AWI-Gen study, which recruited participants from six sites across sub-Saharan Africa. Samples from 1498 of the individuals enrolled at the Agincourt site were randomly selected for TSH testing. Study recruitment took place between November 2014 and August 2016.
PMBB and BioVU participants
Biobank participants were eligible for inclusion in this study if they were ≥18 years old and had ≥1 TSH assay performed as an outpatient. Individuals were excluded if International Classification of Disease (ICD) codes in their electronic health records (EHRs) indicated pituitary dysfunction, hypothyroidism, hyperthyroidism, or thyroid cancer or if they were listed in their EHRs as taking medications that might affect TSH. TSH measurements recorded after the first evidence of pregnancy were removed for participants with a history of pregnancy-related ICD codes. Individuals were also excluded if they were having protocol-driven monthly TSH measurements or if they had >20 TSH measurements during the study period. PMBB participants were eligible if they had TSH results available between November 1998 and July 2022, while BioVU participants were eligible if they had TSH results available between February 1995 and December 2021. However, dates are shifted in both biobanks to protect participant privacy.
The general population in the United States 13 and the AWI-Gen study population are iodine-sufficient. 14
Data and sample collection
AWI-Gen participants self-reported sociodemographic data using a tablet-based questionnaire. Venous blood for TSH was collected in clot activator tubes after an overnight fast and centrifuged after collection. Supernatant serum was stored at −80°C until analysis. Samples collected in ethylenediaminetetraacetic acid (EDTA tubes) were centrifuged at 1500–2000 g for 15 minutes at room temperature and the buffy coat collected and DNA extracted for the genetic studies. For PMBB and BioVU participants, self-reported sociodemographic data and TSH values were extracted from the EHR. DNA extraction and analysis for biobank participants have been previously described. 9,10
Biochemical analysis
Serum samples from AWI-Gen participants were analyzed for TSH using a solid phase, chemiluminescent immunometric assay with a limit of detection of 0.01 mU/L and coefficient of variation of 4.8–5.8% (Immulite platform, Siemens Healthcare, Gwynedd, UK). Serum samples from PMBB and BioVU participants, which were collected as part of routine clinical care, were autoanalyzed for TSH using standard clinical third-generation TSH assays.
Trait definition
For biobank participants with >1 measurement in the study period, mean TSH was calculated to obtain a single TSH value. Participants were included if their TSH fell within a reference range of 0.45–4.5 mU/L. 15
Genotyping
DNA for AWI-Gen participants was genotyped using the H3Africa Custom Genotyping Array on the Illumina platform, which is enriched for common variants in sub-Saharan African populations with 2.267 million single-nucleotide variants (SNVs). 16 Pre- and post-imputation quality control have been described. 17 In brief, prior to imputation, duplicate, nonautosomal, and mitochondrial SNVs were removed as were SNVs with a genotype missing rate >0.05, minor allele frequency <0.01, and Hardy−Weinberg equilibrium (HWE) p-value < 0.0001, and SNVs that did not match GRCh37 reference alleles. Individuals whose biological and reported sex differed or who had a genotype missing rate >0.02 were also removed. Lastly, where potential duplication was suggested by a PIHAT >0.8, one of the pair was removed. One hundred and fifty-nine first degree relatives were also removed from the dataset. The cleaned dataset was then prephased with EAGLE2, 18 and the Sanger Imputation Server was used for imputation with the default Positional Burrows-Wheeler transform algorithm and the African Genomic Resource 19 used as the reference panel. After imputation, SNVs with an IMPUTE2 value <0.6, minor allele frequency <0.01, and HWE p-value < 0.00001 were removed from the final dataset, which had 13,980,000 SNVs.
Genotyping in PMBB participants has also been described. 9 Briefly, samples were genotyped on an Illumina Global Screening Array v.2.0 (GSAv2) by the Regeneron Genomics Centre, using a chip with a backbone of 654,027 genetic markers and additional ancestry informative markers. Genotype imputation was performed for all autosomes on the TOPMed Imputation Server 20 with TOPMed version R2 on a GRCh38 reference panel. Biallelic variant and sex checks were performed after imputation and palindromic variants were removed as were SNVs with a genotype call rate <0.99 and samples with a sample call rate <0.9. SNVs with an imputation score <0.7, minor allele frequency <0.01, and HWE p-value < 1 × 10⁻⁸ were also removed. The final PMBB GSA dataset had 28,257,979 SNVs and the final GSE dataset had 15,597,588 SNVs.
Genotyping in BioVU participants was performed on the Illumina Multi-Ethnic Genotyping Array (MEGAEX). 21 Imputation was performed using the Michigan Imputation Server 20 using the Haplotype Reference Consortium reference panel, and related individuals were removed using an identity by descent proportion filter of 0.2. For the genome-wide association study (GWAS), SNVs with minor allele frequency <0.01 and HWE p-value < 1 × 10⁻¹⁰ were removed. The final BioVU GSA dataset had 3,498,330 SNVs and the final GSE dataset had 4,735,516 SNVs.
Confirmation of population genetic similarities
AWI-Gen participants were ethnically homogeneous, with 85% of residents of the geographic area self-identifying as part of the Tsonga (Shangaan) ethnolinguistic group, 22 which was supported by genetic studies. 23 Principal components clustering was used to identify genetic similarities to reference populations from the 1000 Genomes Project 24 in PMBB 9 and BioVU 21 participants, with further analyses limited to GSA and GSE groups. Datasets were projected into the same principal components analysis space to confirm within-group similarities and between-group distinctions.
Statistical analyses
Mann−Whitney U tests were used to compare age and TSH distributions between GSA and GSE groups and a two-sided Z-test for proportions was used to compare sex between these groups. GWASs were performed in GSA and GSE individuals separately in each of the cohorts, and the effect sizes were then meta-analyzed using a fixed effects model to generate population group-specific effect sizes. We chose a fixed effects model as we were meta-analyzing within the same genetically inferred ancestry group. The I 2 statistic was calculated from Cochran’s Q test to assess heterogeneity. We used linear regression to evaluate associations with each variant, with the dependent variable being inverse-normalized TSH, 25 the independent variable being the dosage of the minor allele, and covariates of age2 and sex, with additional covariates of principal components 1–6 in the AWI-Gen study, ancestry-specific principal components 1–4 in PMBB, principal components 1–4 in the BioVU GSE group, and principal components 1–2 in the BioVU GSA group. The number of principal components chosen was based on visual inspection of scree plots, with principal components to the left of the point of maximum curvature of the plot included, as these components are likely to significantly contribute to the observed variance. Individuals from the GSE population were sampled to equal the size of the GSA population, with GSE individuals from BioVU randomly sampled to equal the number of GSA individuals from BioVU and GSE individuals randomly sampled from PMBB to equal the total number of individuals in the PMBB and AWI-Gen GSA populations. GSE individuals were sampled using the DataFrame.sample() function in the pandas Python package. The level of statistical significance was set to <5 × 10⁻⁸ (the standard genome-wide significance level to correct for multiple testing).
We then used a candidate variant approach to further investigate potential genetic contributions to the observed phenotypic shift. We applied Z-tests to compare the effect sizes of 259 previously reported putative causal variants 6 on TSH values between the GSE and GSA populations. The I 2 statistic was calculated from Cochran’s Q test to assess heterogeneity between the effect sizes of these putative causal variants in our two groups. As difference in allele frequency can result in differential statistical power and therefore differential strength of association between GSE and GSA groups, we conducted a power analysis to evaluate the likelihood of a variant reaching genome-wide significance in our GSE and GSA groups. We considered the actual sample sizes and allele frequencies and assumed that the effect sizes previously reported in GSE populations were the true effects and focused on 13 of the previously reported putative causal variants that attained genome-wide significance (p < 5 × 10⁻⁸) in at least one of our groups.
As PDE8B and PDE10A are the genes most strongly associated with TSH values in GSE populations in published studies, we generated LocusZoom plots to visualize associations with the lead SNVs in each of these genes in each population group. We also compared effect sizes and power to detect associations with putative causal variants in these two genes, regardless of significance levels.
Sensitivity analyses
We drew 1000 random unmatched sets of individuals from the PMBB GSE population, which were each the same size as the combined GSA population from PMBB and AWI-Gen, and in a second analysis, drew 1000 random sets of individuals from the PMBB GSE population, which were matched for age and sex with our combined GSA population from PMBB and AWI-Gen and each the same size as the combined GSA population. We plotted the distributions of association effect sizes and p-values in the unmatched and matched sets for the variants which were significantly different between the GSE and GSA populations in our main analysis.
Descriptive analyses were conducted using STATA v17.0 (StataCorp, Texas, USA). PLINK 1.9 software 26 was used for quality control and to perform the meta-analyses and calculate Cochran’s Q tests. PLINK 2.0 was used for the individual-level data GWAS.
Results
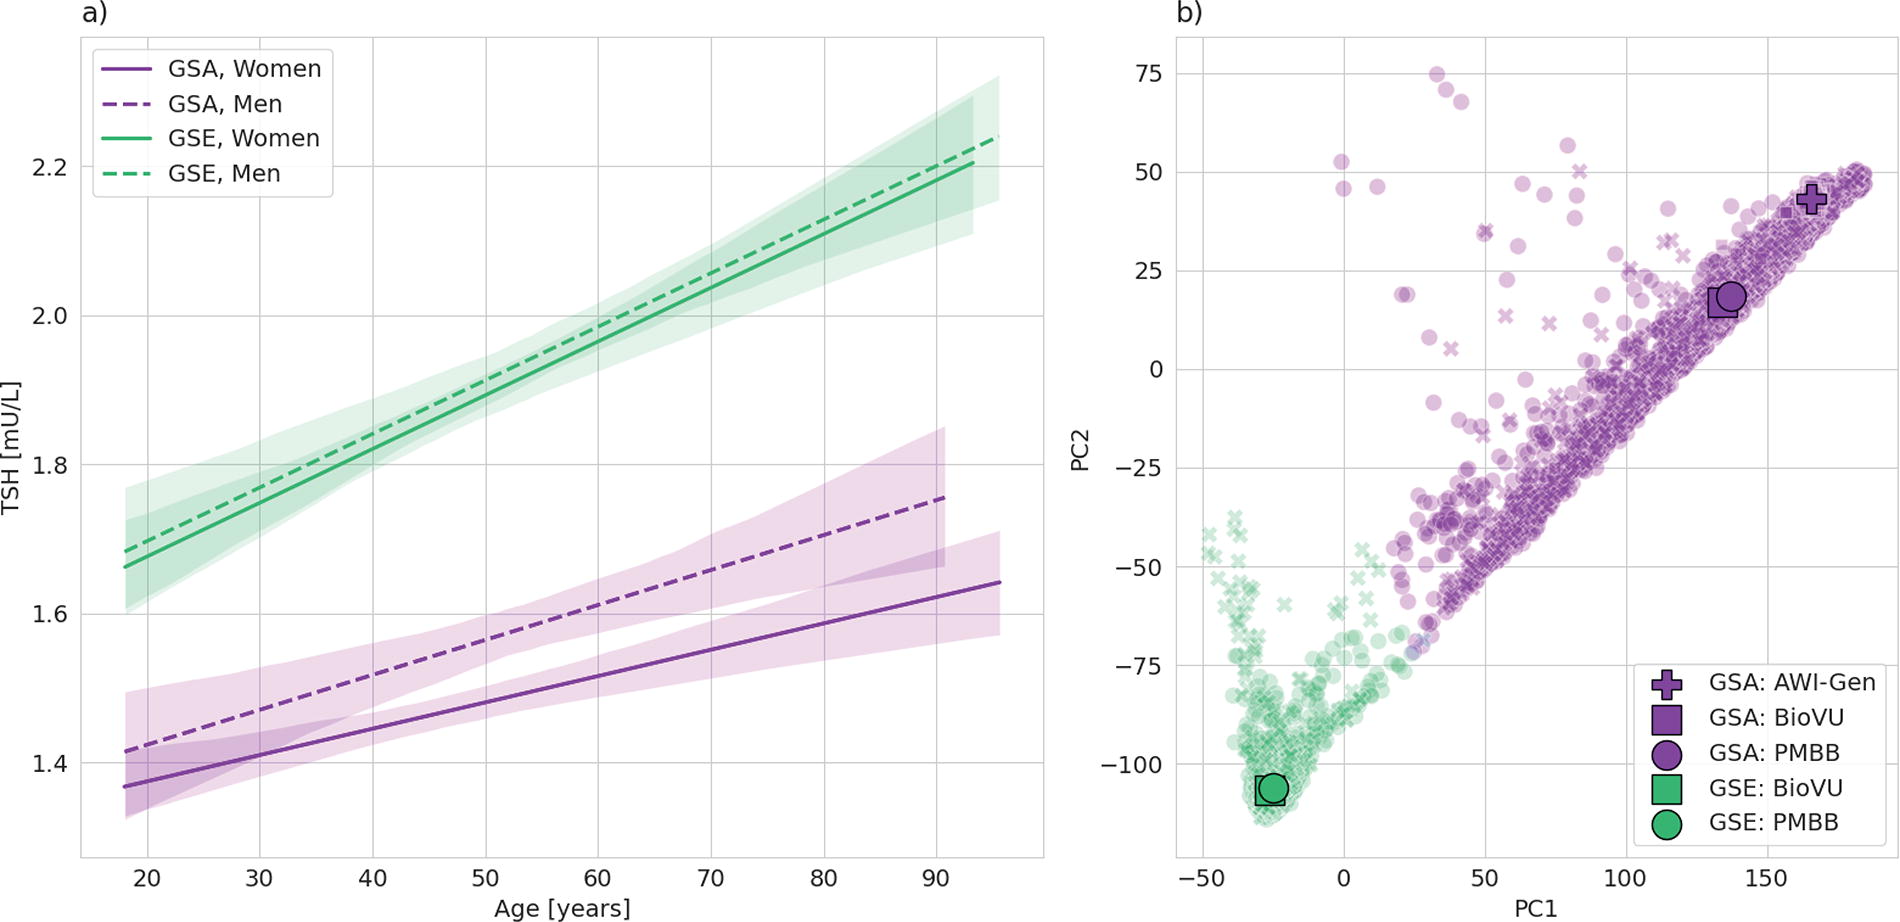
Our sample included 9827 GSA individuals (63.9% women) and 9827 GSE individuals (48.5% women), with median ages of 51 and 56.1 years, respectively (Table 1). Median TSH in the GSA group was 1.35 mU/L (first quartile [Q1]−third quartile [Q3] 0.96–1.89 mU/L) compared with 1.80 mU/L (Q1−Q3 1.30–2.43 mU/L) in the GSE group (p < 0.001) (Table 1). The PMBB GSE population was older than the BioVU GSE population, which may explain why its TSH distribution was higher, with TSH increasing with age in women and men in GSA and GSE populations (Fig. 1a). There was minimal overlap in ancestry between the GSA and GSE populations, with similar inferred ancestry in the three GSA populations and the two GSE populations (Fig. 1b).
Characteristics of Study Sample
Age and TSH are presented as median (first quartile−third quartile). p-Values are for overall GSA versus GSE.
AWI-Gen, Africa Wits-INDEPTH partnership for Genomic Studies; BioVU, Vanderbilt University biobank; GSA, genetic similarity to an African reference population; GSE, genetic similarity to a European reference population; PMBB, Penn Medicine Biobank; TSH, thyrotropin.
Loci associated with TSH values at genome-wide significance (p-value < 5 × 10⁻⁸) differed between the GSA and GSE groups (Fig. 2). In the GSA group, four loci (NHEJ1, NR3C2, PDE10A, and MAFTRR) attained genome-wide significance, in contrast to the identically sized GSE group, where seven loci (CAPZB, PDE8B, VEGFA, PDE10A, PTCSC2, ITPK1, and INSR) were detected at the same significance threshold. Notably, PDE8B, one of the loci most strongly associated with TSH values in the GSE group (p-value = 5.51 × 10⁻²⁰), did not reach the genome-wide significance threshold in the GSA group (p-value = 3.30 × 10⁻⁷). No novel associations were identified in either group. Heterogeneity was low in the meta-analyses of the SNVs that were significantly associated with TSH in the GSA group, while there was relatively high heterogeneity in the GSE meta-analyses of associations of TSH with CAPZB (I 2 73.4) and PDE10A (I 2 64.9) (Fig. 2).
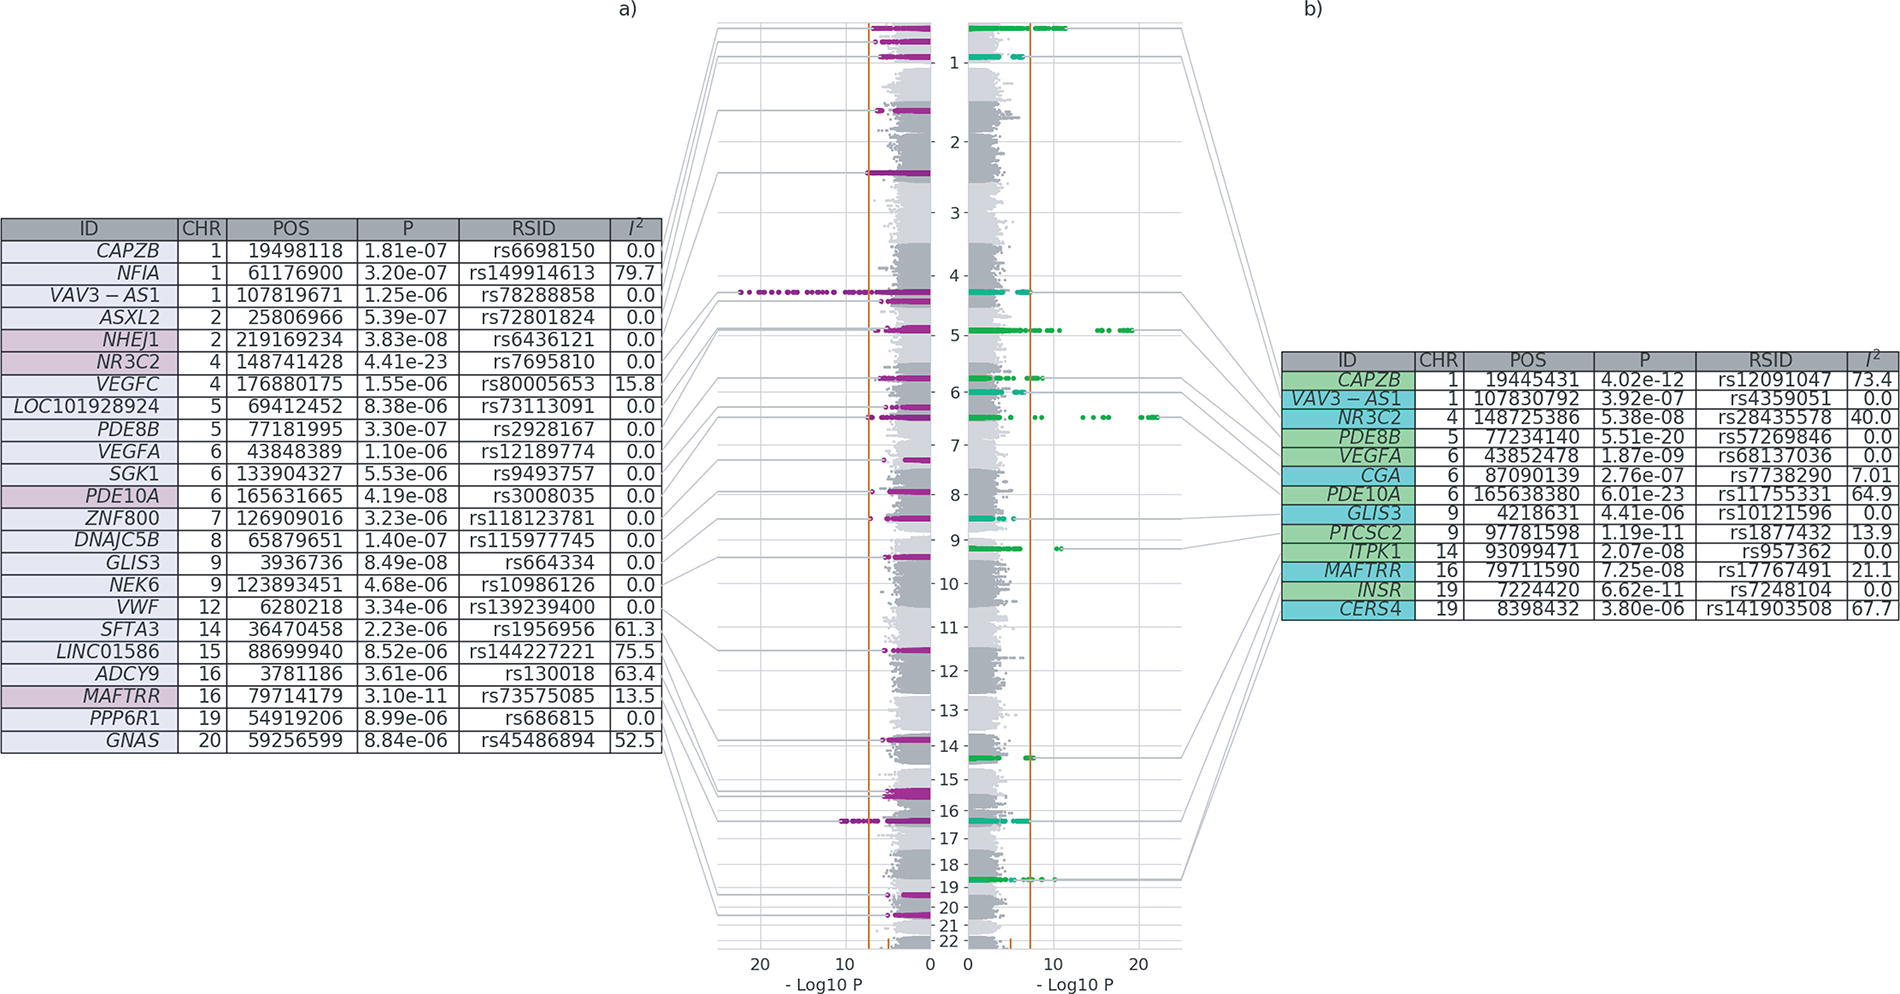
Comparison of meta-analyzed GWAS of TSH between GSA
Eight of the previously reported 259 putative causal variants had effect sizes that were estimated to be significantly different between the GSA and GSE groups, with a Z-statistic >2.5 standard deviations from zero for the difference in effect size (Fig. 3). For all eight variants, the previously reported effect size was within or very close to the confidence interval that we estimated in the GSE population. The I 2 statistic for each of these variants was >80%, indicating high heterogeneity between populations. One of these variants, rs3008034 in PDE10A, was strongly associated with TSH values in the GSE group (p-value = 2.04 × 10⁻²²) but did not reach the genome-wide significance threshold in the GSA group (p-value = 4.22 × 10⁻⁷). In contrast, for the NHEJ1 variant (rs7589228), the association was stronger in the GSA group (p-value = 4.43 × 10⁻⁸ in GSA vs. p-value = 3.05 × 10⁻¹ in GSE). In sensitivity analyses, effect sizes and significance levels for these eight variants in unmatched and age- and sex-matched PMBB GSE populations were similar to those in our main analysis (Supplementary Fig. S1).

Comparison of effect sizes of previously reported putative causal TSH variants between GSA and identically sized GSE populations. Previously reported putative causal variants and beta values were derived from Sterenborg et al. 6 and are displayed if there was no overlap between the confidence intervals in GSA and identically sized GSE populations. Variants are annotated with the Z-statistic for the difference in effect size between populations and between population heterogeneity. Confidence intervals are annotated with p-values. GSA, population with genetic similarity to an African reference population; GSE, population with genetic similarity to European reference population; TSH, thyrotropin.
Twelve previously reported putative causal variants were genome-wide significant in at least one meta-analysis. Comparing the estimated power between GSE and GSA groups, for most variants, the group with higher estimated power indeed had smaller p-values, except for rs1479559 in PDE8B, rs737308 in IGFBP5, and rs73575083 in MAFTRR (Fig. 4). For the GSE group, we estimated >80% power to detect significant associations for five variants, four of which (rs1479559 and rs9687206 in PDE8B, rs1317983 in VEGFA, and rs3008034 in PDE10A) attained genome-wide significance and one of which (rs6847675 in LOC105377480) was just below the significance threshold. In contrast, among the five variants that we expected to have at least 80% power in the GSA group, only two variants, rs334699 in NFIA and rs6847675 in LOC105377480, reached genome-wide significance, with three additional ones close to but below the threshold (p-value < 5 × 10⁻⁸). Among these five variants, the power was expected to be higher in the GSA group than in the GSE group for variants in PDE8B (rs1479559), NFIA (rs334699), and LOC105377480 (rs6847675) and similar between the two groups for variants in PDE8B (rs9687206) and PDE10A (rs3008034) (Fig. 4). On the contrary, two variants, rs7589228 in NHEJ1 and rs925489 in PTCSC2, were significantly associated with TSH values in the GSA group despite estimated power of <20%.
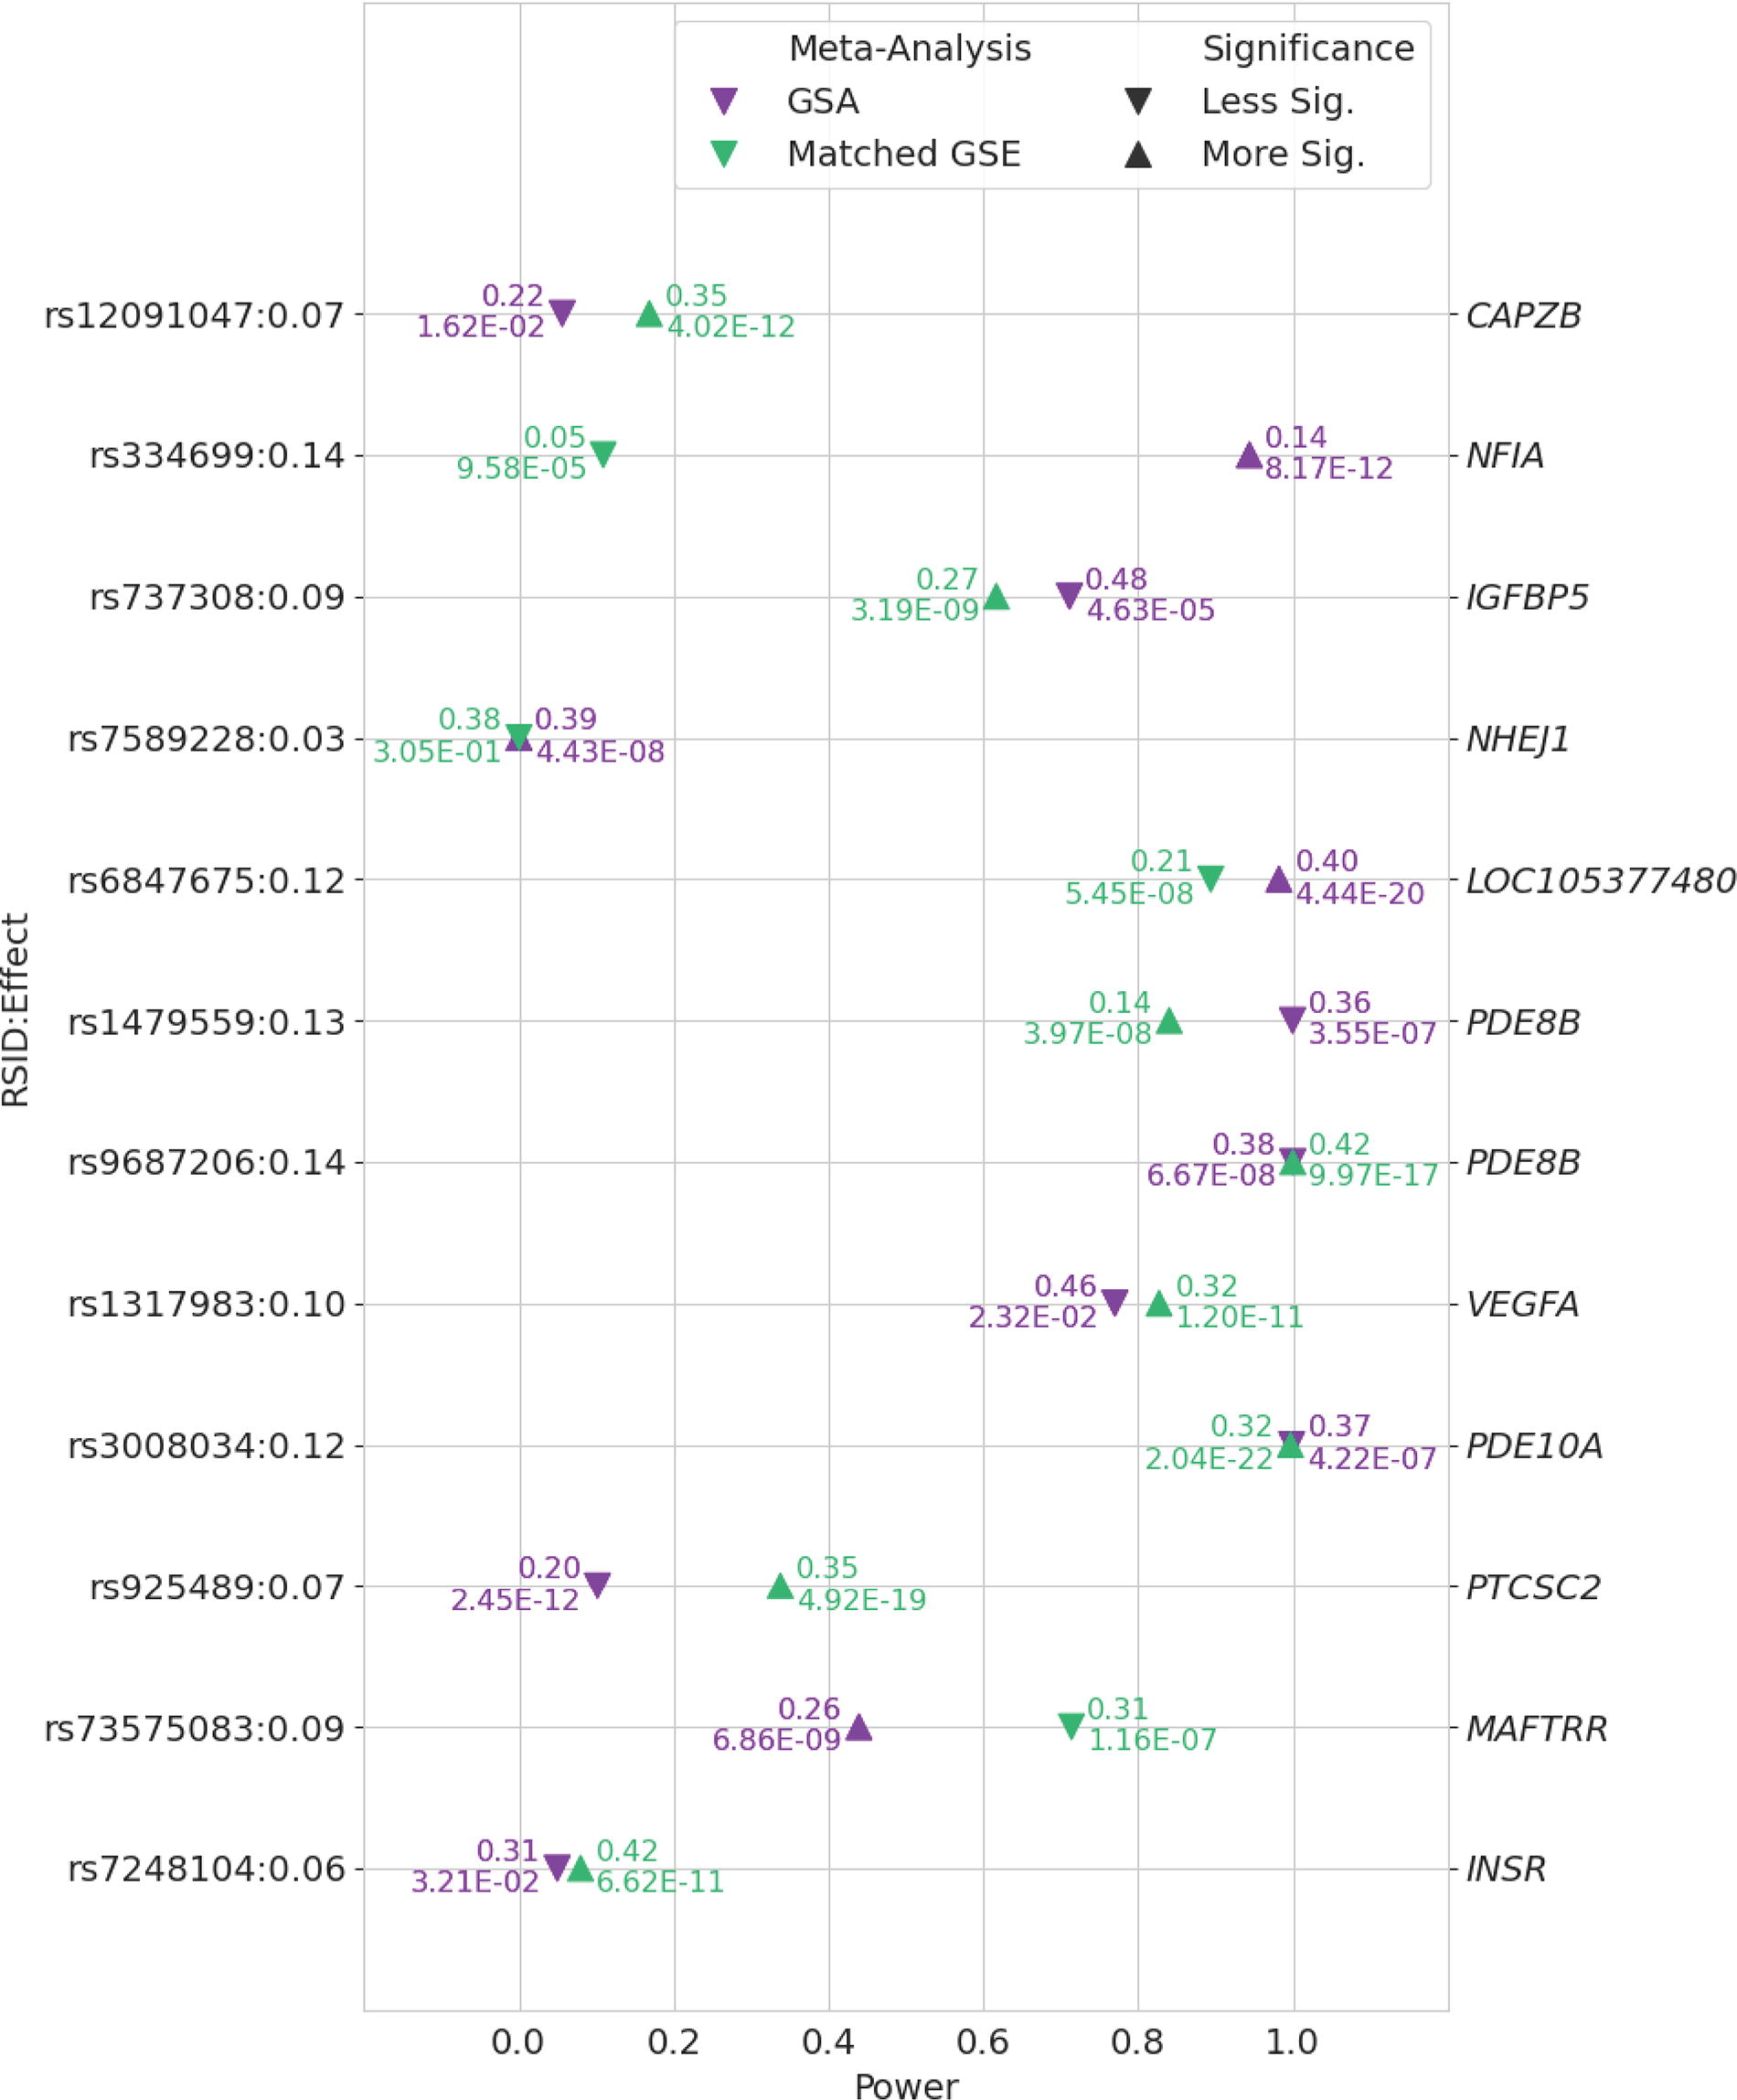
Comparison of power to detect associations between TSH and previously reported putative causal variants in GSA and identically sized GSE populations. Data points are annotated with minor allele frequency and p-value. Previously reported putative causal variants and assumed effect size derived from Sterenborg et al. 6 and included if they were genome-wide significant (p < 5 × 10⁻⁸) in at least one of the meta-analyses. Arrows indicate which meta-analysis yielded a more significant association relative to the other. GSA, population with genetic similarity to an African reference population; GSE, population with genetic similarity to European reference population; TSH, thyrotropin.
Detailed analysis of associations with PDE8B and PDE10A revealed that in the GSE group, the lead SNV in PDE8B was in strong linkage disequilibrium with several other SNVs (Fig. 5, panel c), in contrast to the GSA group, where the lead SNV was in strong linkage disequilibrium with one other SNV (Fig. 5, panel a). In both the GSE and GSA groups, multiple variants were in strong linkage disequilibrium with the lead SNV in PDE10A (Fig. 5, panels d and b). Beyond variant rs3008034 in PDE10A mentioned above, there were no additional previously reported putative causal variants in PDE8B or PDE10A with significantly different effect sizes between the two groups (Fig. 6a). Power to identify associations with additional, previously reported putative causal variants in PDE8B and PDE10A was similar between our two groups, because of the similar allele frequencies between GSA and GSE groups for most variants (Fig. 6b).
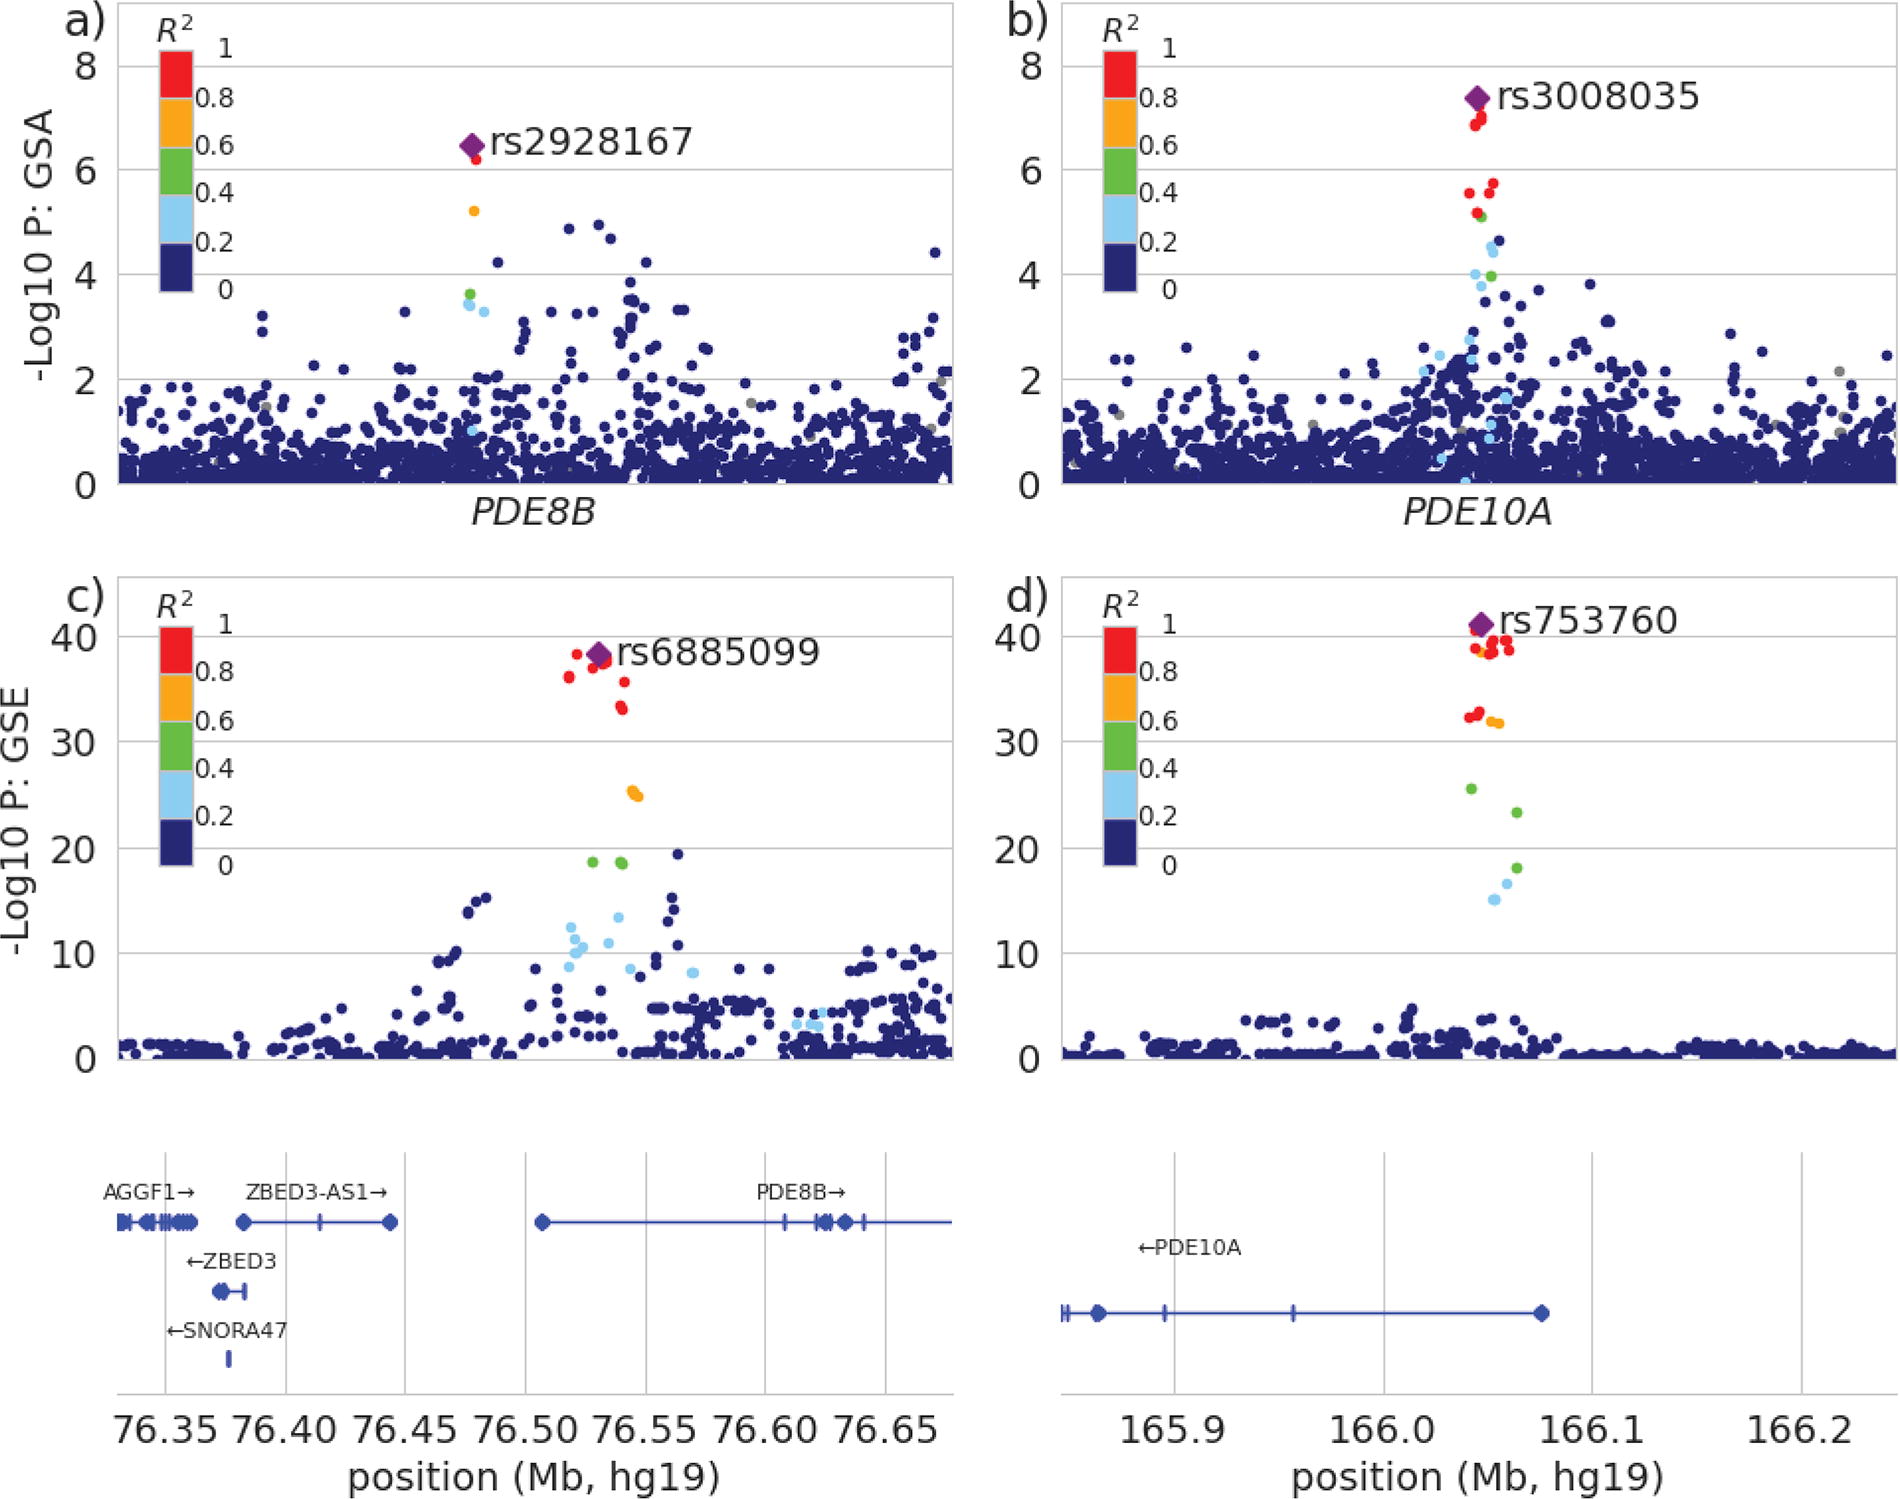
LocusZoom plots for PDE8B in GSA

Discussion
We found that patterns of genetic associations with TSH values differed between GSA and GSE populations. Several known associations, including strong associations with PDE8B, were replicated in the GSE group, but not in the GSA group, although associations with PDE8B in the GSA group were just below genome-wide significance. We observed unexpected associations and did not identify expected associations, given our power analysis that assumed previous effect size estimates were true for both populations. For example, our failure to detect an association with rs3008034 in PDE10A in our GSA group despite sufficient power contrasted with our ability to detect an association with rs7589228 in NHEJ1 despite low power. These unexpected results are not attributable to differences in sample size, as our GSE and GSA populations were identically sized. Rather, coupled with the significantly different estimated effect sizes for these variants between the two groups, they suggest true effect size differences between population groups due to differences in gene–gene or gene–environment interactions.
There is statistical evidence from population studies for the effects of PDE8B variants on TSH levels in humans. In a Sardinian population, each additional copy of the minor A allele of rs4704397 in PDE8B was associated with a TSH increase of 0.13 mU/L. 27 Higher TSH concentrations may be required to maintain the same intracellular effect in GSE individuals with PDE8B or PDE10A variants that increase hydrolysis of cAMP. Differences in associations with variants in these genes between GSA and GSE populations therefore present a plausible explanation for the higher TSH concentrations in GSE populations.
Our study has several strengths. We report for the first time, to our knowledge, loci attaining genome-wide significance in association studies with TSH values in a GSA population, while confirming that the distribution of TSH differs from a GSE population. Our sample size was substantially larger than the previous study of genetic associations with TSH in GSA individuals, which included only 351 participants. 7 We included GSA individuals from sub-Saharan Africa and two different regions in the United States, attenuating environmental factors or gene–environment interactions which might affect our TSH phenotype.
Our study has several limitations. Our major limitation was the lack of statistical power, although associations with PDE8B in GSE populations were identified in early GWAS with sample sizes of fewer than 5000 individuals. 27 We should have been adequately powered to detect these associations in our GSA population if the effect sizes were similar. Our GSA population included both continental Africans from southern Africa and admixed individuals from the United States, who are more likely to have west African ancestry. Given the significant genetic variation within Africa, 28 associations with TSH may differ within genetic subpopulations. Thyroid status and use of medications that might affect TSH were not assessed in the AWI-Gen cohort. However, in this rural South Affrican population, use of prescription medication for thyroid dysfunction is uncommon (personal communication; C. Kabudula, November 26, 2024). The immunoassay platforms used for the TSH results documented in PMBB and BioVU have changed over time. This could have increased variability in TSH estimates, but this would have been irrespective of ancestry. Inclusion of age and sex as covariates in our linear regression analyses assumes that their effects were linear, which may not have been the case.
Our study highlights the importance of including populations of diverse genetic and environmental backgrounds in studies of physiological traits. GWAS in larger GSA populations, especially those from continental Africa, are needed to confirm our findings of differential associations with TSH values when compared with GSE populations and to identify additional associations, which may not have been evident in our study due to small effect sizes. These studies will assist in understanding the contribution of genetic factors to differences in the distribution of TSH values across populations.
Footnotes
Acknowledgments
The authors acknowledge the AWI-Gen study and BioVU for providing data and thank the patient-participants who consented to participate in these research programs. The authors also acknowledge the Penn Medicine BioBank (PMBB) for providing data and thank the patient- participants of Penn Medicine who consented to participate in this research program. The authors would also like to thank the Penn Medicine BioBank team and Regeneron Genetics Center for providing genetic variant data for analysis. The PMBB is approved under IRB protocol# 813913.
Authors’ Contributions
A.N.W.: Conceptualization, writing–original draft, writing—review and editing, and funding acquisition. L.G.: Validation, formal analysis, writing–original draft, writing–review and editing, and visualization. M.H.: Validation, formal analysis, and writing—review and editing. P.S.: Validation, formal analysis, and writing−review and editing. Z.G.: Methodology, data interpretation, and writing−review and editing. M.M.: Data interpretation and writing—review and editing. A.T.: Data interpretation and writing−review and editing. L.K.D.: Resources, data acquisition and curation, and writing–review and editing. M.R.: Resources, data acquisition and curation, data interpretation, writing—review and editing, project administration, and funding acquisition. M.D.R.: Methodology, resources, data acquisition and curation, data interpretation, and writing−review and editing. A.R.C.: Conceptualization and writing−review and editing. All authors approved the final article and agree to be accountable for all aspects of the work.
Ethical Considerations
This study was conducted in accordance with the Declaration of Helsinki. Written informed consent was obtained from all AWI-Gen participants in Shangaan, the local language. Ethical approval for the HAALSI and AWI-Gen studies and this secondary analysis was obtained from the Human Research Ethics Committee (Medical) of the University of the Witwatersrand (M141159, M170584), the Institutional Review Board of Harvard University (IRB18-0129), and the Mpumalanga Research and Ethics Committee (MP_201801_003). PMBB participants provide informed consent during outpatient clinic visits at Penn Medicine. PMBB has been approved by the Institutional Review Board of the University of Pennsylvania (protocol #813913). BioVU participants provide informed consent in outpatient clinic environments at Vanderbilt University Medical Center (VUMC). The VUMC Institutional Review Board oversees BioVU and approved this project (protocol #212285).
Author Disclosure Statement
A.N.W. reports serving on a panel at an educational event on thyroid cancer sponsored by Sanofi. L.G., M.H., P.S., Z.G., M.M., A.T., L.K.D., M.R., M.D.R., and A.R.C. have no disclosures.
Funding Information
The AWI-Gen Collaborative Center is funded by the National Human Genome Research Institute (NHGRI), Office of the Director (OD), the Eunice Kennedy Shriver National Institute of Child Health and Human Development (NICHD), the National Institute of Environmental Health Sciences (NIEHS), the Office of AIDS Research (OAR), and the National Institute of Diabetes and Digestive and Kidney Diseases (NIDDK) of the National Institutes of Health (NIH) under award number U54HG006938 and its supplements, as part of the H3Africa Consortium as well as by the Department of Science and Innovation, South Africa, award number DST/CON 0056/2014. The HAALSI study was funded by the National Institute on Aging (P01 AG041710). The MRC/Wits Rural Public Health and Health Transitions Research Unit and Agincourt Health and socio-Demographic Surveillance System, a node of the South African Population Research Infrastructure Network (SAPRIN), is supported by the Department of Science and Innovation, the University of the Witwatersrand, and the Medical Research Council, South Africa, and previously the Wellcome Trust, UK (grants 058893/Z/99/A; 069683/Z/02/Z; 085477/Z/08/Z; 085477/B/08/Z). The PMBB is supported by Perelman School of Medicine at the University of Pennsylvania, a gift from the Smilow family, and the National Center for Advancing Translational Sciences of the National Institutes of Health under CTSA award number UL1TR001878. A.N.W. was supported by the Fogarty International Center, National Institutes of Health under award number K43TW010698 and A.R.C. was supported by the National Institute on Aging, National Institutes of Health under award K24AG042765. M.D.R. was supported by UL1TR001878. This article describes the views of the authors and does not necessarily represent the official views of the National Institutes of Health (USA) or the South African Department of Science and Innovation who funded this research. The funders had no role in study design, data collection, analysis and interpretation, report writing, or the decision to submit this article for publication.
Supplementary Material
Supplementary Figure S1
Supplementary Table S1
Penn Medicine BioBank Banner Author List and Contribution Statements
PMBB Leadership Team
Daniel J. Rader, MD, and M.D.R, PhD.
Contribution: All authors contributed to securing funding, study design, and oversight.