
Abstract
Background:
In China, thyroid cancer (TC) is the most common cancer in females and the fifth most common cancer in males. TC overdiagnosis leads to overtreatment, lifelong medical care, and side effects. This study systematically quantifies the epidemiological profile of TC incidence in China, as well as estimating TC incidence attributable to overdiagnosis.
Methods:
Data were derived from the Cancer Incidence in Five Continents databases. Age-standardized incidence rates (ASIRs) per 100,000 person-years were calculated using the world standard population. Joinpoint regression and age-period-cohort models were conducted to examine temporal ASIR trends and period effects, respectively. We estimated TC incidence attributable to overdiagnosis among patients aged 15–84 years by comparing shapes of age-specific curves with those observed before diagnostic practices.
Results:
In 2013–2017, there were 37,862 and 117,979 new TC cases in males and females in China, respectively, with ASIRs of 6.9/100,000 and 21.1/100,000. Significant upward trends were observed from 1993 to 2017, with average annual percent changes being 14.7% for males and 16.2% for females. Incidence rate ratios of period effects markedly increased from 1.0 to 61.8 for males and from 1.0 to 42.9 for females from 1993 to 2017. Overdiagnosis accounted for 83.5% (31,455/37,685) and 88.7% (104,222/117,509) of cases in males and females in 2013–2017, respectively, yielding ASIRs of 5.9/100,000 and 19.1/100,000. ASIRs attributable to overdiagnosis in urban populations (6.9/100,000 for males and 21.7/100,000 for females) were significantly higher than in rural populations (1.3/100,000 and 6.4/100,000). Among the 25 included provinces, ASIRs attributable to overdiagnosis ranged from 0.3/100,000 in Sichuan to 18.5/100,000 in Shanghai in males and from 0.1/100,000 in Shanxi to 49.4/100,000 in Shanghai in females. The national ASIRs attributable to overdiagnosis increased from 2.6/100,000 in 2008–2012 to 5.9/100,000 in 2013–2017 for males and from 9.2/100,000 to 19.1/100,000 for females.
Conclusions:
The incidence rates of TC have considerably increased over the past 25 years in China. Rapidly increasing trends and considerable geographic variations in TC incidence attributable to overdiagnosis highlight the need to adjust TC screening strategies and clinical practices, optimize healthcare resource allocation, and monitor the impacts of TC overdiagnosis on population-level health.
Introduction
In 2022, there were an estimated 206,485 new cases of thyroid cancer (TC) in males and 614,729 new cases in females worldwide, corresponding to age-standardized incidence rates (ASIRs) of 4.6 and 13.6 per 100,000 person-years, respectively. 1,2 Notably, China accounts for more than half of all TC cases worldwide; specifically, 124,907 males and 341,211 females were estimated to be newly diagnosed with TC in 2022, with ASIRs of 13.3 and 36.5 per 100,000 person-years in males and females, respectively. 1,3 Currently, TC has become the most common cancer observed in females and the fifth most common cancer observed in males in China. 1,2
The considerable burden of TC incidence may be related to the high incidence of TC overdiagnosis. 4 TC overdiagnosis refers to the detection of a TC case that is unlikely to cause symptoms or death during a patient’s lifetime if it has gone undetected. 5 Since the 1970s, the introduction of new diagnostic technologies (e.g., ultrasound and medical screening) has played a significant role in the detection of thyroid conditions, thus causing a rapid increase in TC incidence rates (e.g., TC overdiagnosis). 4,6,7 TC overdiagnosis leads to excessive treatment, lifelong medical care, and side effects that can negatively affect quality of life. 8 TC overdiagnosis imposes unnecessary psychological and financial burdens on diagnosed patients and potentially leads to substantial economic costs for healthcare systems. 8,9
Although a recent publication has reported temporal trends in TC incidence from 2003 to 2017 and the estimates of overdiagnosis in 2013–2017 at the national level in China, 10 the epidemiological profile of TC incidence and mortality and the incident burden attributable to overdiagnosis according to geographic region remains only partially understood. Therefore, the current study examines temporal variations in TC incidence and mortality from 1993 to 2017 in China and evaluates the effects of age, period, and birth cohort on TC incidence for a better understanding of the epidemiological profile. Furthermore, we quantify the burden of TC incidence attributable to overdiagnosis in 2013–2017, with a focus on gender differences and geographic variation, as well as evaluating the association between TC overdiagnosis with economic and healthcare factors.
Methods
Data sources
Data regarding TC incidence were obtained from the Cancer Incidence in Five Continents (CI5) Volumes XI–XII and CI5 Plus database, 11 –13 and stratified by sex and 5-year age group. TC mortality data were derived from the China Cancer Registry Annual Report. 14 The CI5 Volume XI included cancer incidence data from 35 cancer registries in China for the diagnosed period of 2008–2012, 12 whereas Volume XII encompassed 157 Chinese cancer registries in 2013–2017. 11 The CI5 Plus included annual cancer incidence data from 1993 to 2017, encompassing cancer registries with at least 15 consecutive years of data. 13 The data from these cancer registries were assessed as high quality in terms of comparability, completeness, and validity. 11 –13 TC incidence was defined according to the International Classification of Diseases for Oncology, Third Edition (ICD-O-3): 8010–8576 (morphology), and C73 (topography). We also retrieved data on TC incidence by histological subtype. Data on the two economic and healthcare indicators (the gross domestic product [GDP] per capita and the number of beds in medical and health institutions) were collected from the China Statistical Yearbook for the year 2015. 16,17
Cancer registry data were pooled to cover the largest geographic area and provide a proxy for national or regional TC incidence and mortality. In China, urban and rural areas are defined as cities and counties, respectively. 16,17 The 157 cancer registries include 110 in urban areas and 47 in rural areas (Supplementary Table S1). In addition, we categorized 157 cancer registries into seven geographical regions (Supplementary Table S2) and 25 provincial administrative regions (Supplementary Table S3) based on the division of the Ministry of Civil Affairs of China. 17
Ethical approval was not required for this study because it used existing non-identifiable data that were aggregated and population-level and were extracted from a publicly available database.
Statistical Analysis
The ASIRs and age-standardized mortality rates (ASMRs) per 100,000 person-years were calculated via the direct method based on the world standard population. 18
Joinpoint regression analysis
To examine temporal ASIR trends from 1993 to 2017, we performed joinpoint regression analysis by fitting a series of straight lines to the ASIRs over time to identify significant changes in the slopes of overall ASIR trends; to achieve this, we tested from zero up to a maximum of three joinpoints by using the Monte Carlo permutation method. 19 The joinpoint annual percent change (JAPC) for each trend segment and the average annual percent change (AAPC) across all segments, along with the 95% confidence intervals (CIs), were calculated to quantify the changes in ASIRs over time. 19 The ASIRs were considered to denote a significantly increasing trend if the 95% CI of the corresponding JAPC or AAPC >0 and to be a significantly decreasing trend if the 95% CI <0; moreover, they were considered to be stable if the 95% CI included 0.
Age-period-cohort (APC) analysis
We constructed an APC model to evaluate the changes in age, period, and birth cohort effects on TC incidence.
20,21
yapc
and napc
were defined as the number of incident cases and person-years at risk, respectively, in age group a = 15–19, …, 80–84, and period p = 1993, …, 2017. Synthetic and overlapping birth cohorts were extracted by subtracting the mid-year of the 5-year age bands from the year of diagnosis. It was assumed that the incidence of TC follows a Poisson distribution and is conditional on the observed rates. Specifically,
In this equation, the interest resides in the modeling log (Rapc
). Then,
Where Rapc refers to the incidence rate, and αa , βp, and γc represent the age (a), period (p), and birth cohort (c) effects, respectively. Herein, age effects reflect accumulated carcinogenic exposure with aging, period effects represent changes in artificial factors (e.g., changes in diagnostic practices and the introduction of screening) related to a temporary simultaneous influence on all age groups, and cohort effects indicate generational changes in the prevalence of causal factors (e.g., specific lifestyles and environmental carcinogens). 22 Given that these three effects cannot be simultaneously estimated within the model due to their inherent linear dependence and the impact of diagnostic practice on TC incidence, 4,23 we present the period effects as incidence rate ratios (IRRs) relative to the reference period (1993) by constraining the linear component of cohort effects to zero on average. 24 –26
The multistage model of carcinogenesis
A previous study revealed that the incidence of cancer exponentially increases with age.
27
Essentially, young people rarely develop cancer, and the incidence rate rapidly increases with increasing age, thereby indicating that cancer is an age-related disease. Before the 1970s, ultrasound technology, and other new diagnostic techniques had not yet been introduced for tumour screening.
28
Historical data from long-term cancer registries in various countries, including Nordic countries, Canada, the United States, Israel, and India, demonstrate that the incidence of TC increases with age according to a power law, which is consistent with the multistage carcinogenesis model.
23
According to the multistage carcinogenesis model, the incidence of cancer is proportional to the age raised to the power of k, where the exponent k for TC can be estimated from cancer registries with long-term data.
23
The relationship between the logarithm of the incidence rate and the logarithm of age is linear and is expressed by the following formula:
Where rate represents the expected incidence rate, age refers to the age of the patients, and b is a constant. 23 Such a relationship on the arithmetic scale implies a linear relationship between the incidence rates and age on a log-log scale. 23
Estimation of TC overdiagnosis
A previous study revealed that the incidence rates among older individuals were generally similar across different time periods and birth cohorts. 29 In contrast, the increase in incidence rates was more pronounced among younger age groups. 29 The expected incidence rate of TC for each cancer registry was derived by assuming that the age curve of the disease would retain the historical shape observed in long-term cancer registries in Nordic countries before the 1970s. 29 This method has been shown to perform robustly in previous studies. 4,15,23,29
We estimated the number of TC cases attributable to overdiagnosis by comparing the observed age-specific incidence rates with the expected age-specific incidence rates by the 10-year age group. 15 We calculated the ASIRs attributable to overdiagnosis for urban/rural areas, seven geographic regions, 25 provinces, and 157 cancer registries for the population aged 15–84 years based on the world standard population. We calculated the correlation coefficients between the ASIRs attributable to overdiagnosis and both the GDP per capita and the number of hospital beds via Spearman’s rank correlation and presented their relationship on a scatter diagram with a log-log scale by using the cancer registry data. Furthermore, we calculated the percentage changes in the ASIRs attributable to overdiagnosis for 17 cancer registries with 10 consecutive years of data from 2008 to 2017.
A two-sided p value less than 0.05 was considered to be statistically significant. Joinpoint regression models were constructed with the Joinpoint Regression Program (version 5.3.0). 30 The APC model was constructed using the Epi package in R (version 4.3.1), 31 whereas remaining data analyses and graph plotting were conducted via R (version 4.3.1). 31
Results
In 2013–2017, a total of 37,862 and 117,979 new TC cases occurred in males and females, with papillary TC accounting for 97.1% (29,934/37,862) and 98.0% (94,353/117,979) of total cases in China, respectively (Supplementary Fig. S1). The ASIRs of TC increased by 102.9% in males (from 3.4 per 100,000 in 2008–2012 to 6.9 per 100,000 in 2013–2017) and by 95.4% in females (from 10.8 per 100,000 in 2008–2012 to 21.1 per 100,000 in 2013–2017), whereas the ASMRs increased by 0.2% in males (from 1.2 per 100,000 in 2008–2012 to 1.4 per 100,000 in 2013–2017) and increased by 0.1% in females (from 2.0 per 100,000 in 2008–2012 to 2.2 per 100,000 in 2013–2017) (Table 1). Notably, there were significant upward trends of annual ASIRs from 1993 to 2017 (Fig. 1), with the AAPC being 14.7% (95% CI: 12.2–17.4, p < 0.001) for males and 16.2% (95% CI: 14.4–17.9, p < 0.001) for females (Table 2). Interestingly, the increases in annual ASIRs have decelerated since 2014. In addition, temporal ASIR trends of papillary TC followed a similar pattern to overall TC (Fig. 1).
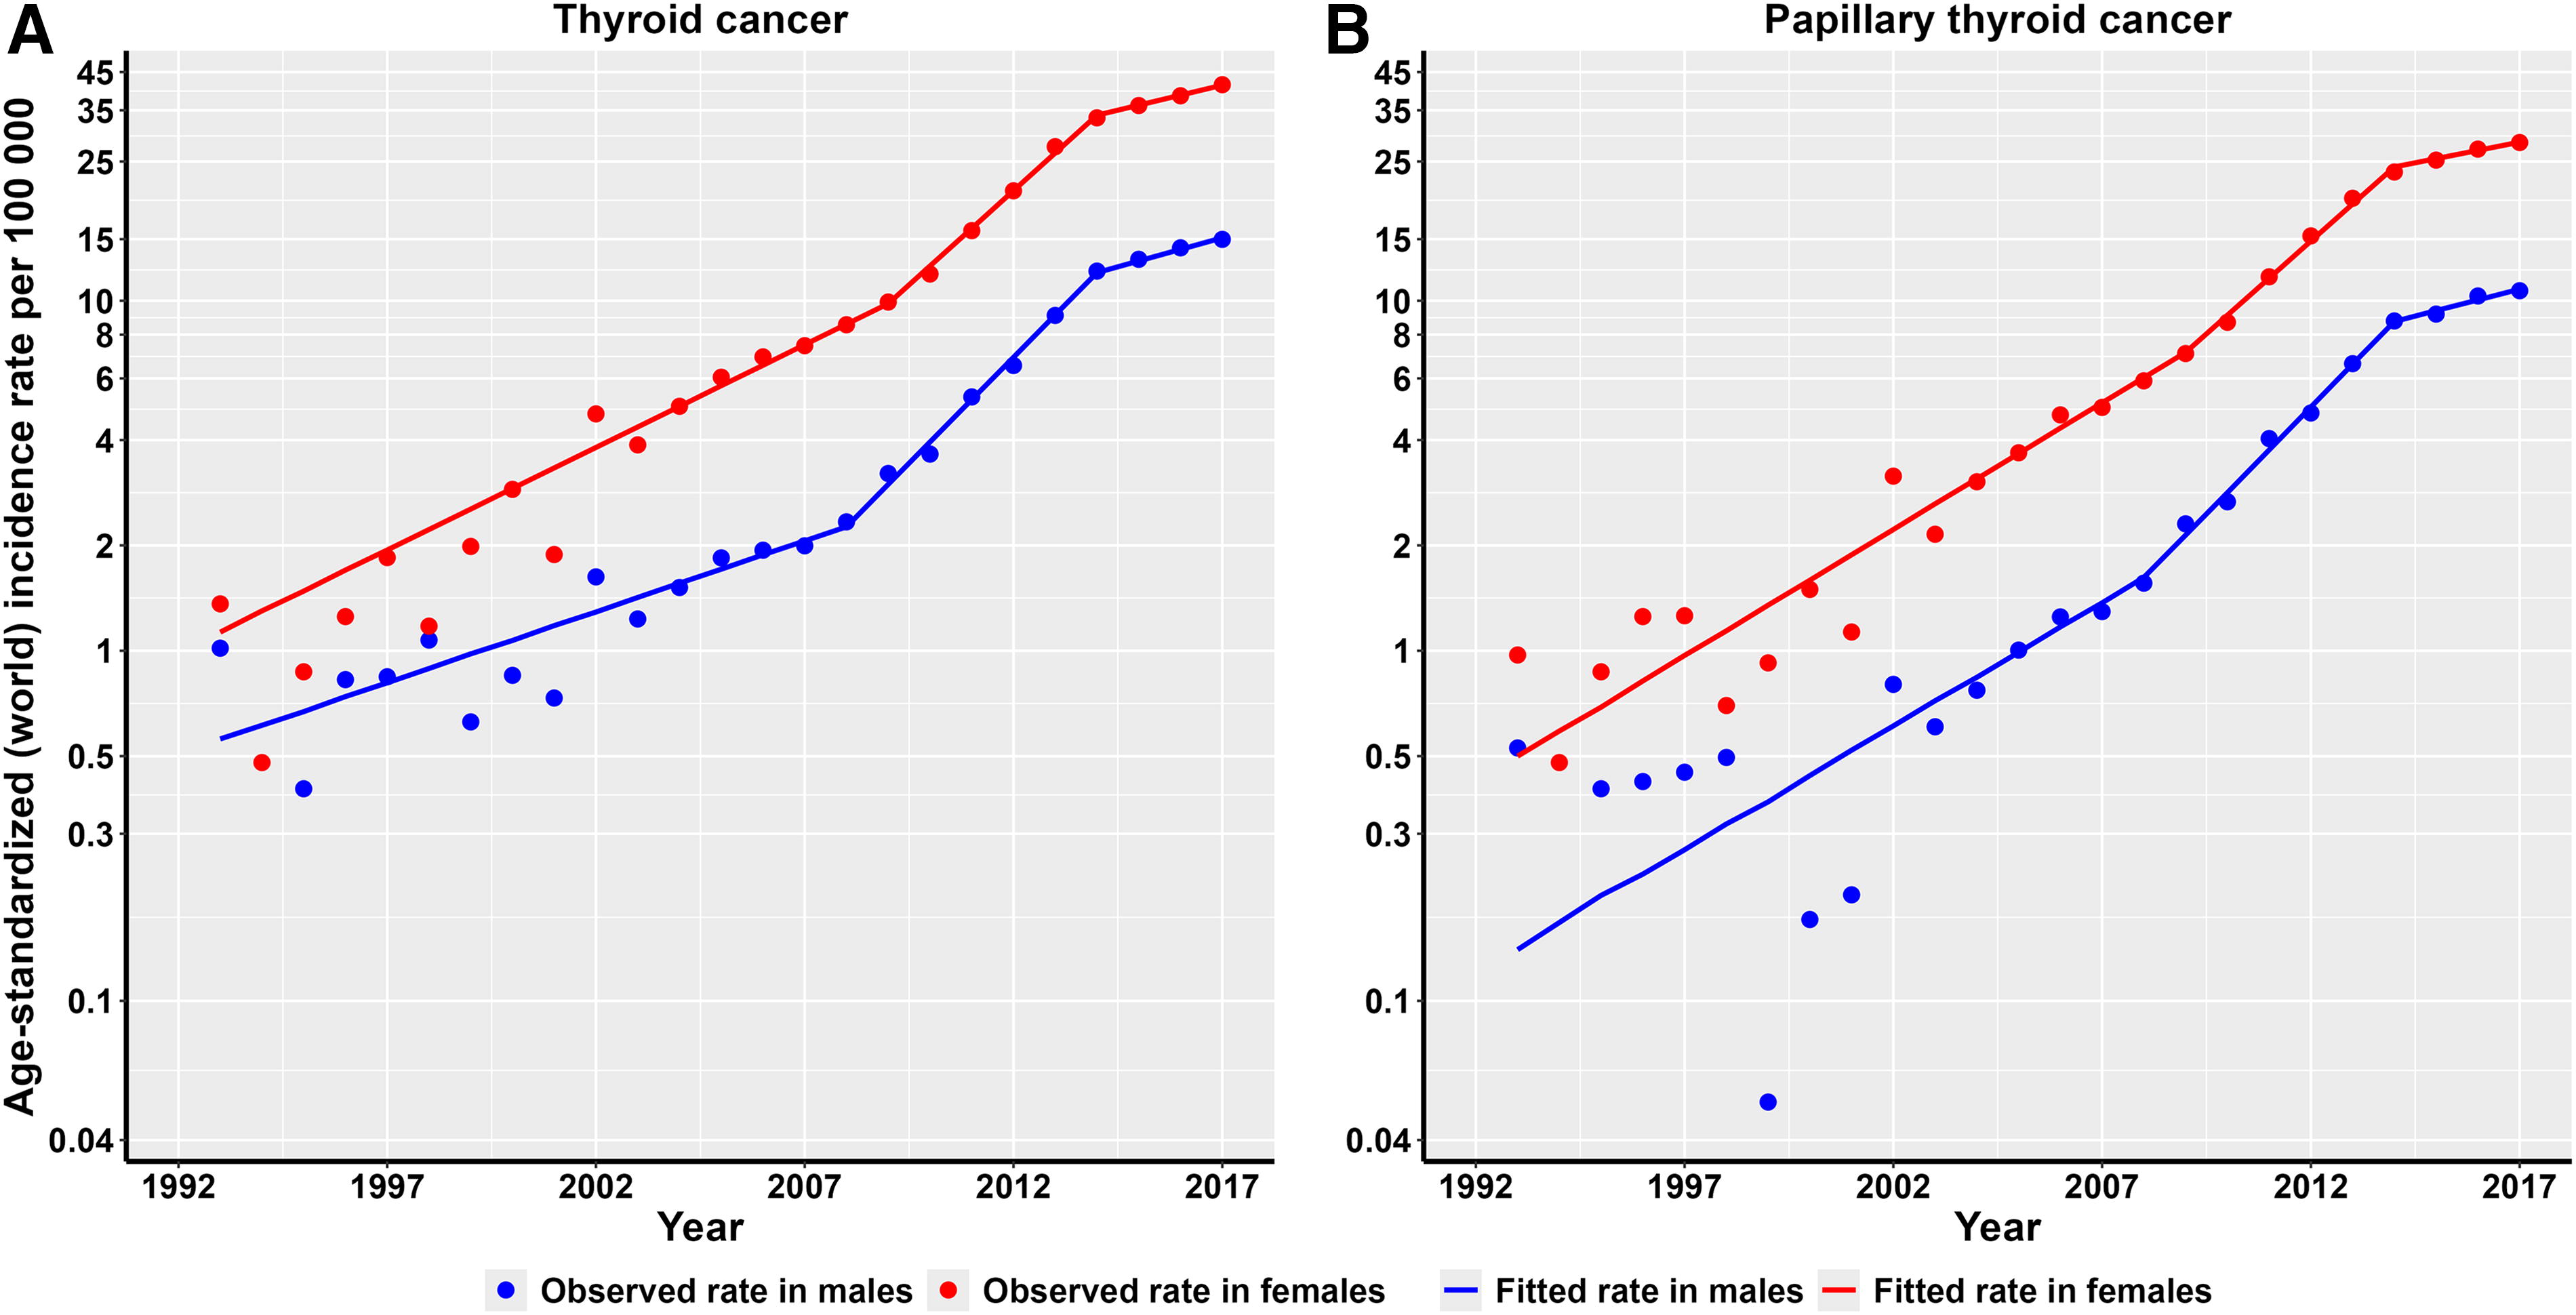
Trends in age-standardized incidence rates (ASIRs) of thyroid cancer
Differences in Age-Standardized Incidence Rate and Age-Standardized Mortality Rate of Thyroid Cancer for Individuals Aged 0–85+ Years in 2008–2012 and 2013–2017 and the Percentage Change of Rates from 2008–2012 to 2013–2017
Per 100,000 person-years.
ASIR, age-standardized incidence rate; ASMR, age-standardized mortality rate.
Estimated Annual Percent Change and Average Annual Percent Change of Thyroid Cancer and Papillary Thyroid Cancer in China from 1993 to 2017
CI, confidence interval; JAPC, joinpoint annual percent change; AAPC, average annual percent change.
The APC analysis revealed distinct patterns across age, period, and cohort effects (Fig. 2). The age effect exhibited a quasi-inverted V-shaped trend, with higher IRRs observed in females than males across all age groups and the IRRs peaking at 50–54 years for both sexes. The period effect demonstrated a rapid upward trend from 1993 to 2014, during which IRRs increased from 1.0 to 54.4 for males and from 1.0 to 36.3 for females; moreover, these increases have subsequently decelerated, with IRRs reaching 61.8 for males and 42.9 for females in 2017. The cohort effect exhibited a quasi-V-shaped pattern, with the IRRs in the 1911–1961 birth cohorts decreasing from 16.8 to 0.5 for males and from 2.6 to 0.7 for females and subsequently increasing to 3.1 for males and to 1.4 for females in cohorts born in 2000. The observed trends for papillary TC closely mirrored those of TC, thereby exhibiting similar patterns across age, period, and cohort effects (Fig. 2).
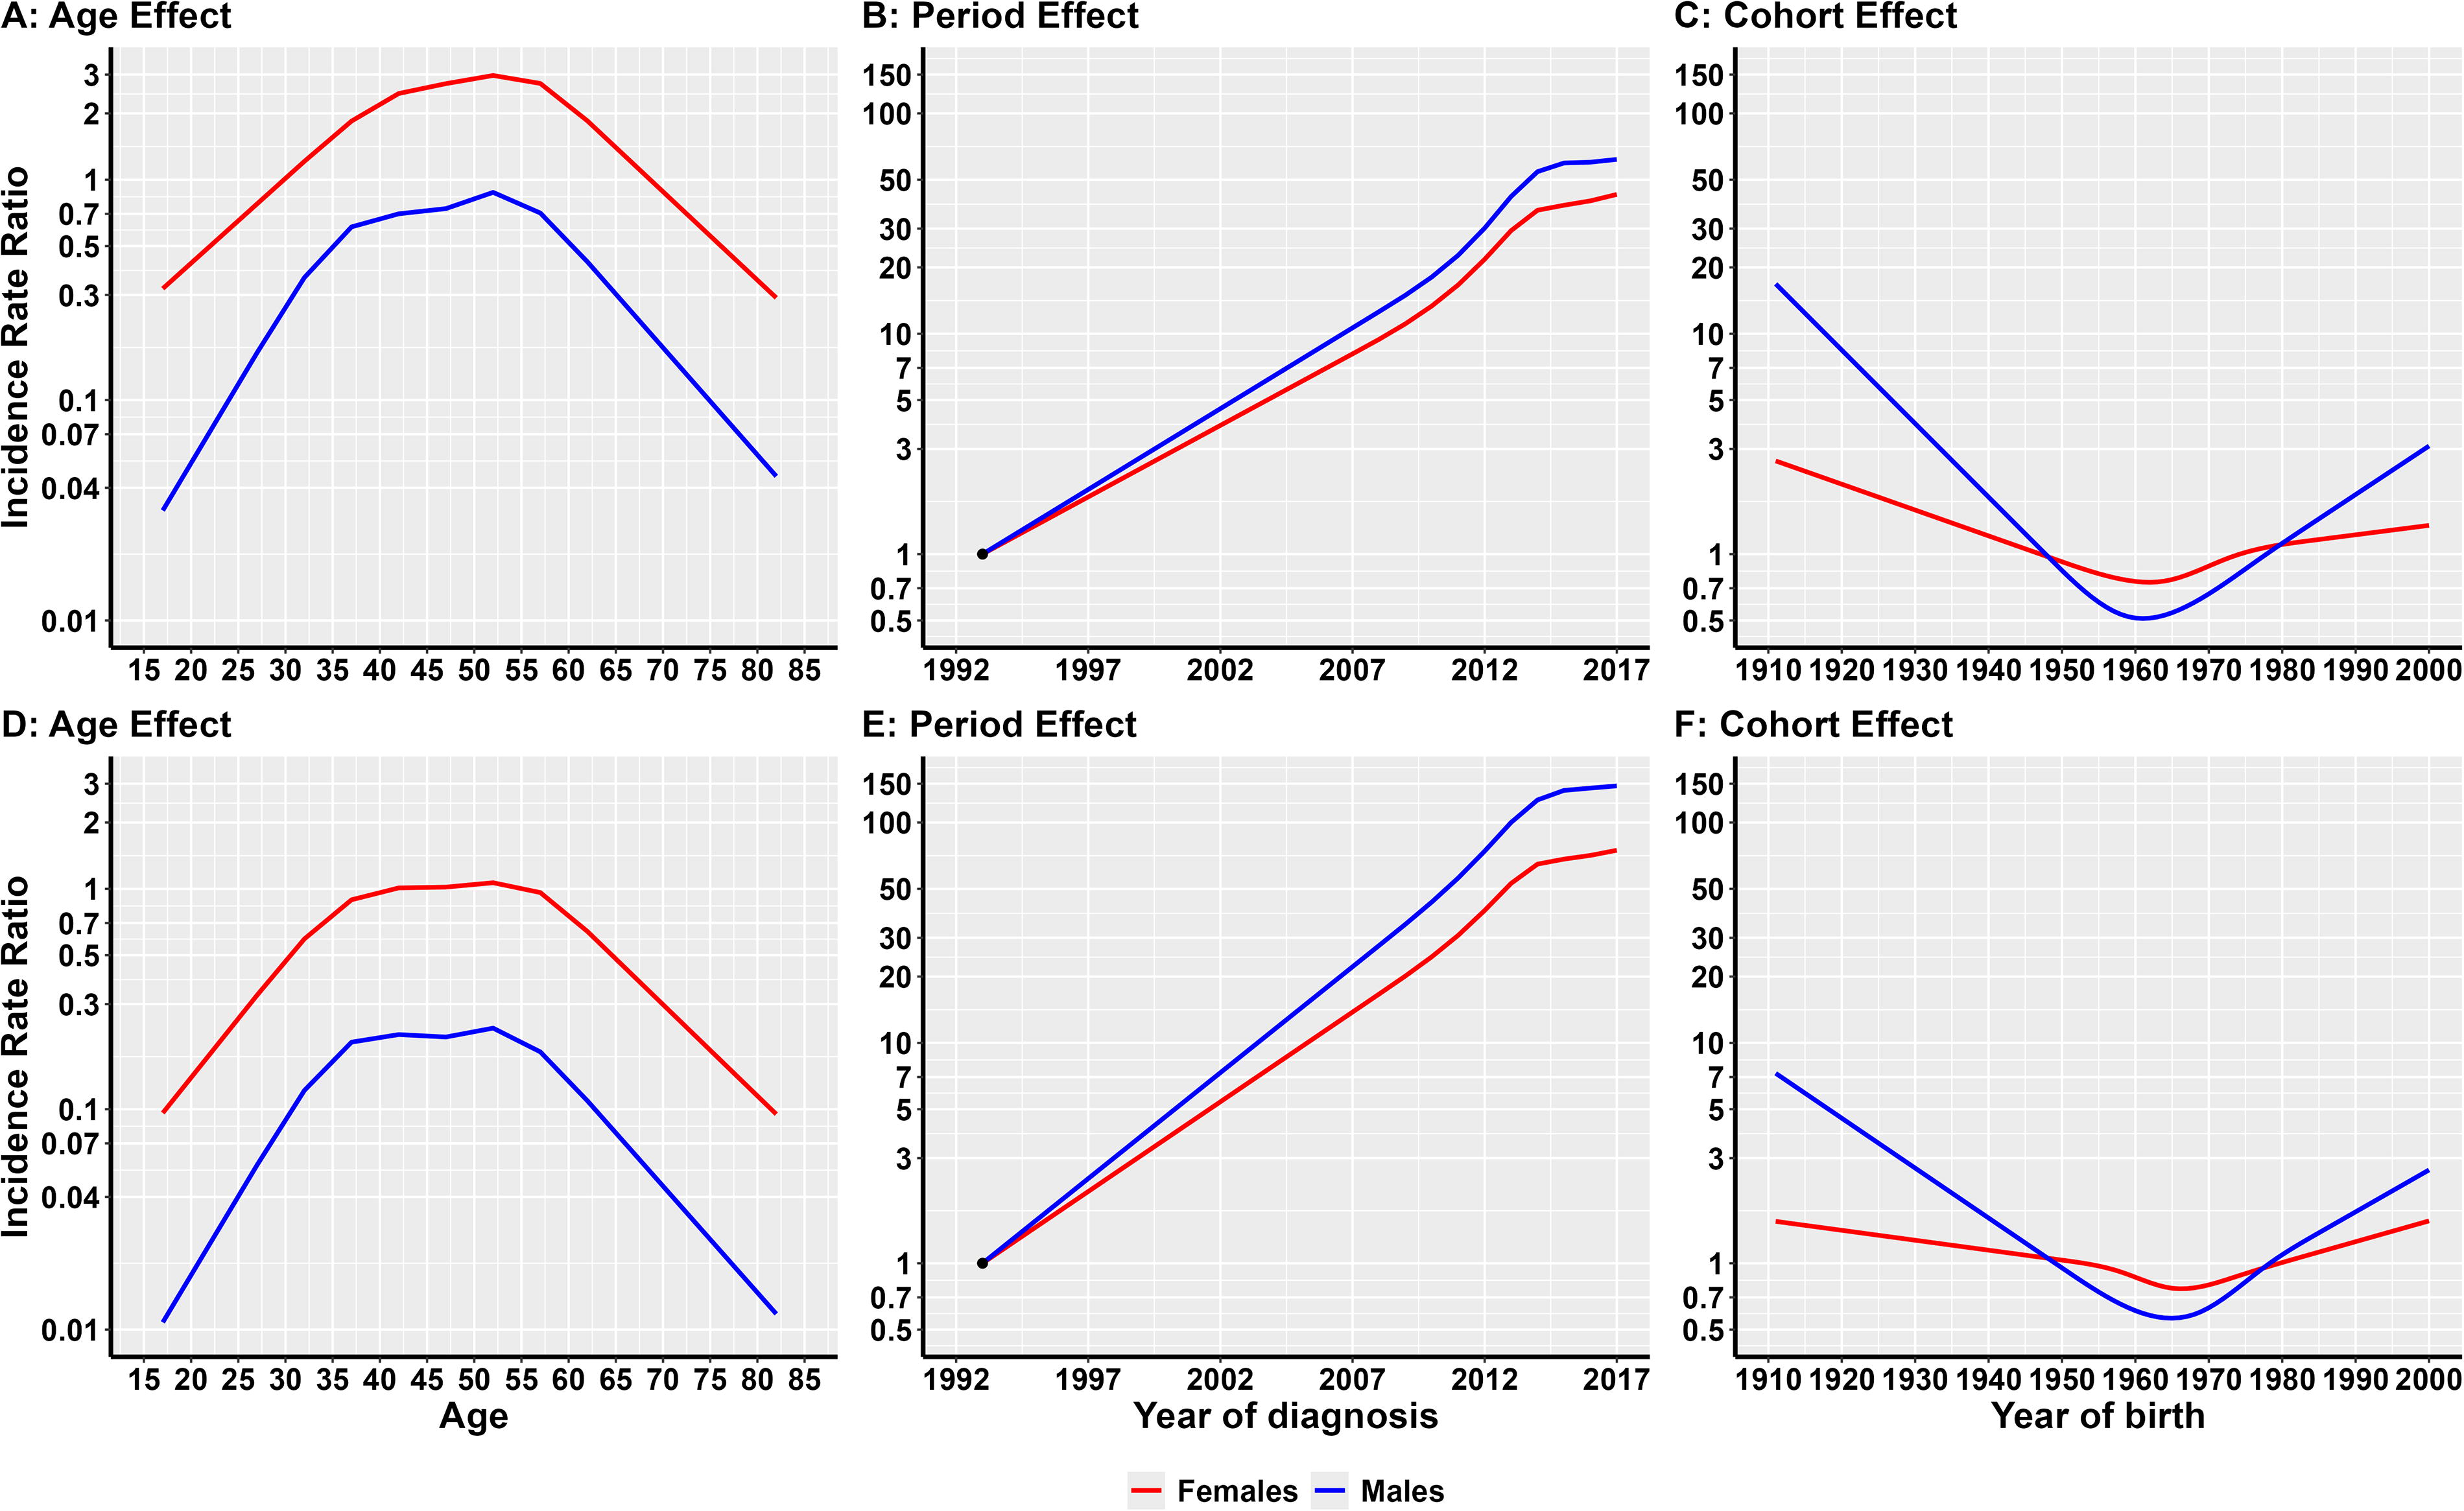
Age-period-cohort (APC) analysis of thyroid cancer and papillary thyroid cancer incidence. Panels
We estimated that 83.1% (31,455/37,685) and 88.3% (104,222/117,509) of all cases aged 15–84 years were attributable to overdiagnosis in males and females in 2013–2017, respectively, with corresponding ASIRs of 5.9 and 19.1 per 100,000 (Table 3). A sex-related difference in the ASIRs attributable to overdiagnosis was noted, with a male-to-female ratio of 3.2. The incidence rates of TC by age group demonstrated quasi-inverted V-shaped trends, with the largest burden of TC incidence attributable to overdiagnosis occurring in male individuals aged 35–44 years and in female individuals aged 45–54 years (Supplementary Fig. S2).
The Number of New Cases, Cases Attributable to Overdiagnosis, Age-Standardized Incidence Rates, and Age-Standardized Incidence Rates Attributable to Overdiagnosis of Thyroid Cancer Aged 15–84 Years Among the Seven Regions and 25 Provinces in China in 2013–2017
Per 100,000 person-years. The symbol “—” indicates cases attributable to overdiagnosis, the proportion of total cases, and ASIRs attributable to overdiagnosis could not be estimated.
ASIRs, age-standardized incidence rates.
For urban and rural regions, the ASIRs attributable to overdiagnosis in the urban population (6.9 and 21.7 per 100,000 in males and females, respectively) were significantly higher than those in the rural population (1.3 and 6.4 per 100,000 in males and females, respectively) (Supplementary Fig. S3). Among the seven geographical regions, the ASIRs attributable to overdiagnosis ranged from 1.6 per 100,000 in Southwest China to 7.1 per 100,000 in East China in males and from 3.4 per 100,000 in Northwest China to 23.8 per 100,000 in Northeast China in females (Table 3 and Supplementary Fig. S4).
Among the 25 provinces, the proportion of TC cases attributable to overdiagnosis varied from 16.7% in Sichuan Province to 90.6% in Zhejiang Province for males and from 7.9% in Shanxi Province to 94.9% in Heilongjiang Province for females (Table 3). The ASIRs attributable to overdiagnosis varied from 0.3 per 100,000 in Sichuan Province to 18.5 in Shanghai Province for males and from 0.1 in Shanxi Province to 49.4 in Shanghai Province for females (Table 3, Fig. 3 and 4). Sex-related disparities in the ASIRs attributable to overdiagnosis were also noted across the 25 provinces, with the male-to-female ratio ranging from 2.7 in Shanghai to 9.0 in Sichuan (data not shown). With respect to the age groups, the highest incidence rates of TC attributable to overdiagnosis occurred in males aged 35–44 years in Beijing, Guangdong, Gansu, Guangxi, Hubei, Heilongjiang, Jiangsu, Jiangxi, Liaoning, Shanghai, Shandong, Sichuan, and Yunnan Provinces and in males aged 45–54 years in Anhui, Fujian, Henan, Hunan, Inner Mongolia, Ningxia, and Qinghai Provinces. The highest incidence rates of TC attributable to overdiagnosis occurred in females aged 35–44 years in Guangdong and Yunnan Provinces and in females aged 45–54 years in Anhui, Beijing, Chongqing, Fujian, Gansu, Guangxi, Henan, Hubei, Hunan, Hebei, Heilongjiang, Inner Mongolia, Jilin, Jiangsu, Jiangxi, Liaoning, Qinghai, Shanghai, Shanxi, and Shandong Provinces (Fig. 5).
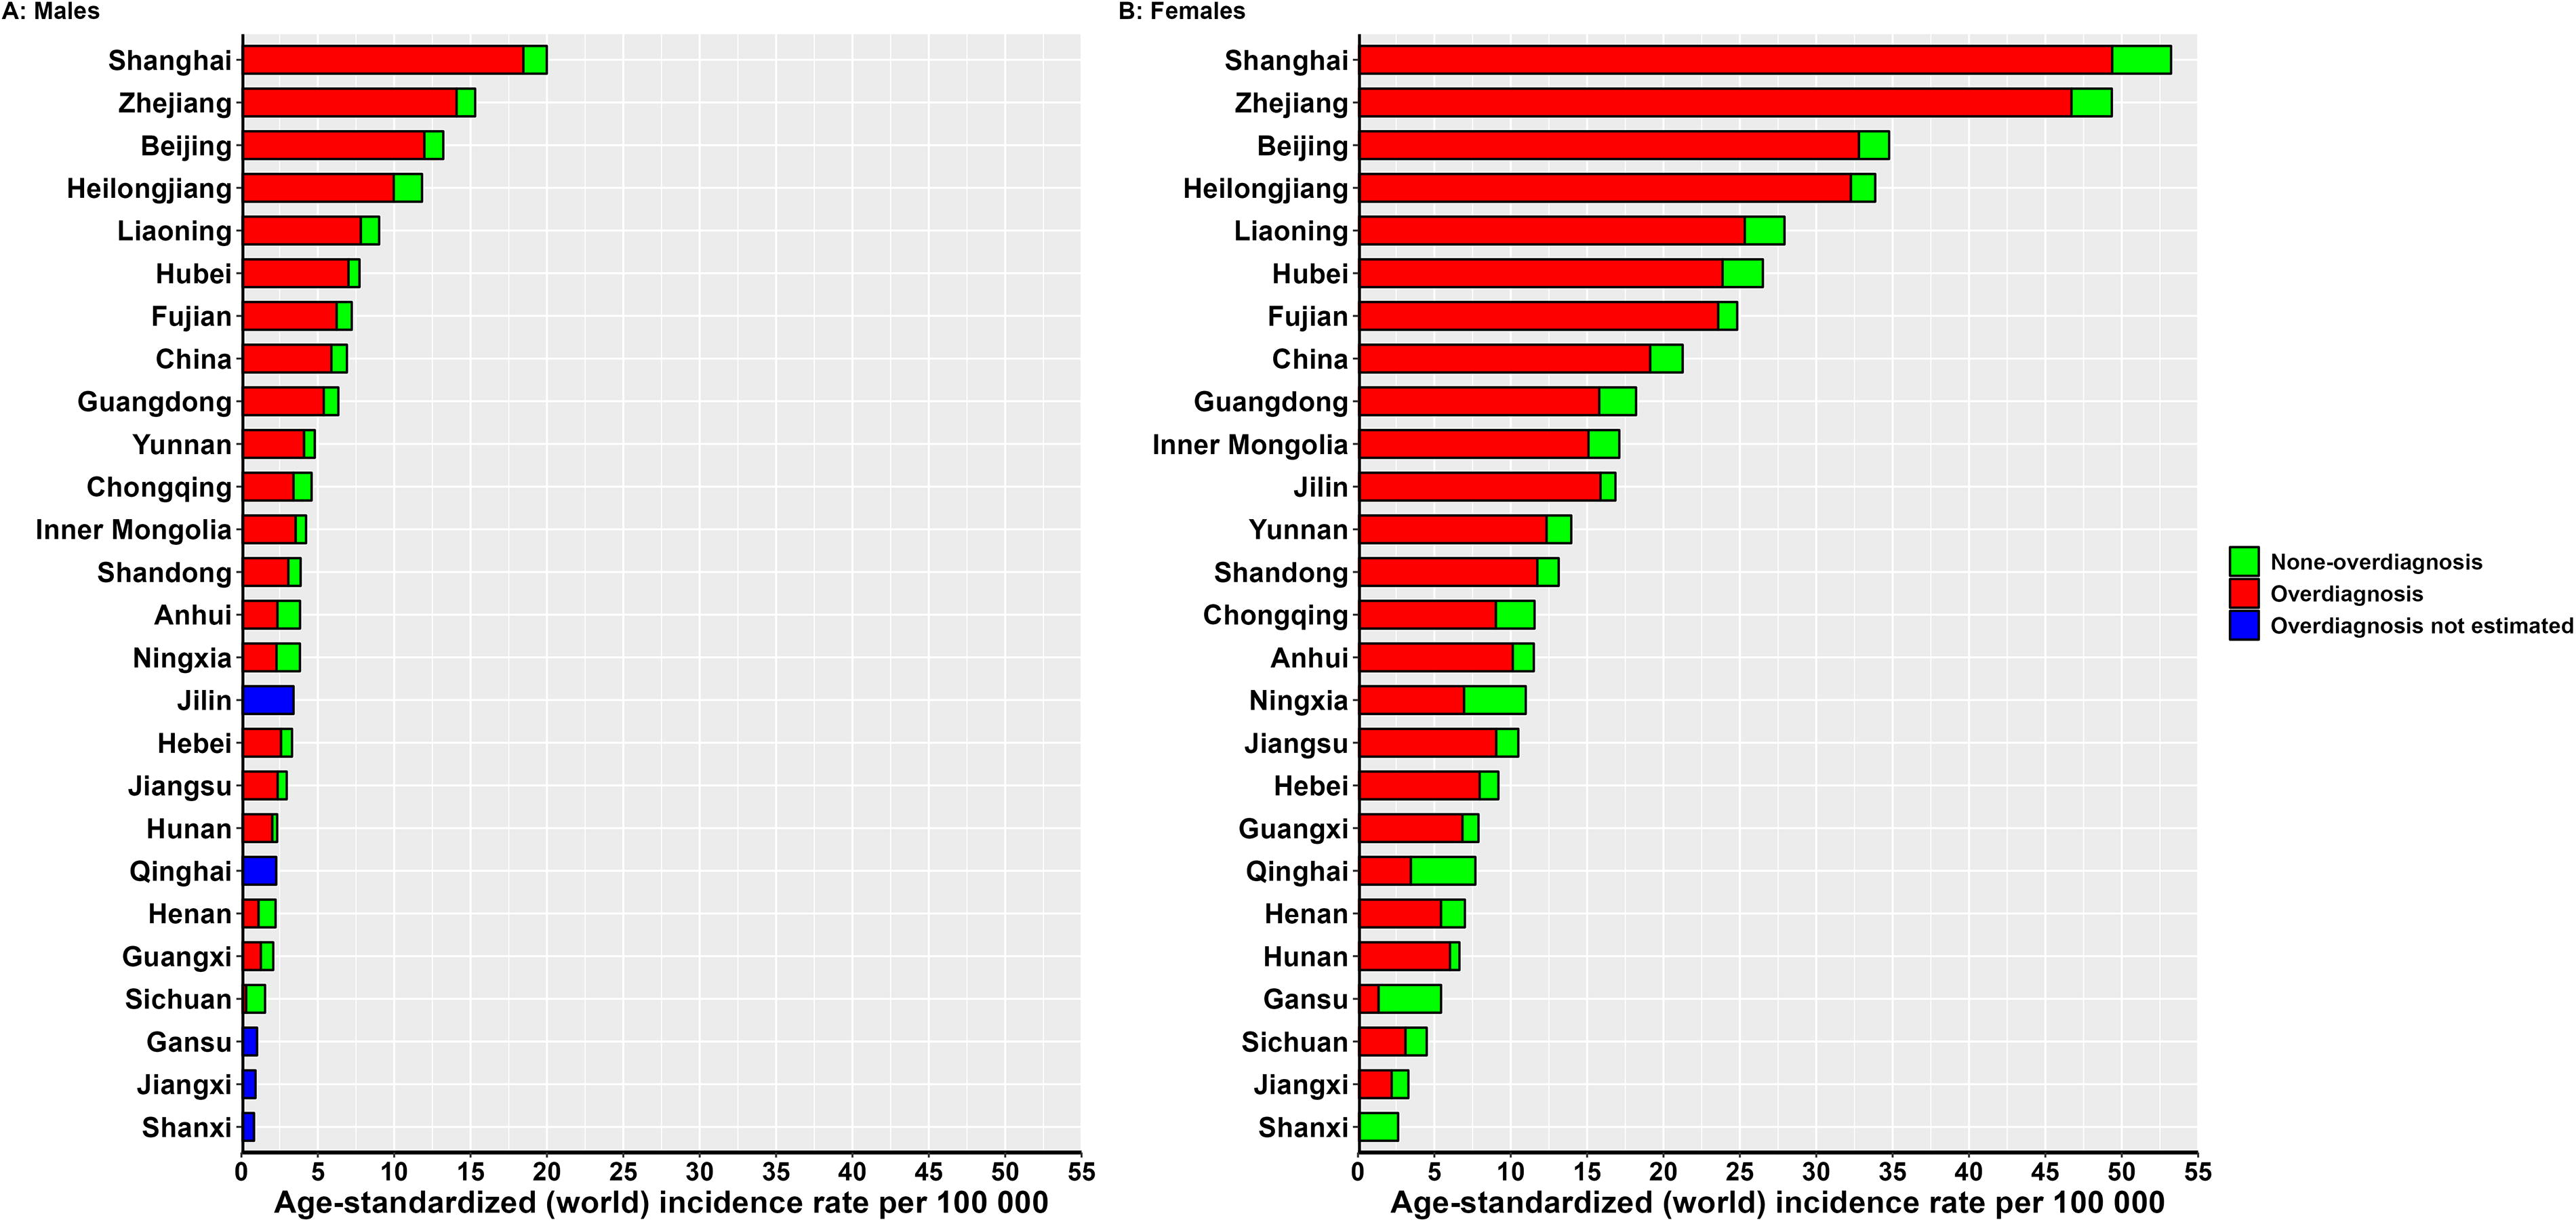
Age-standardized incidence rates of thyroid cancer in males
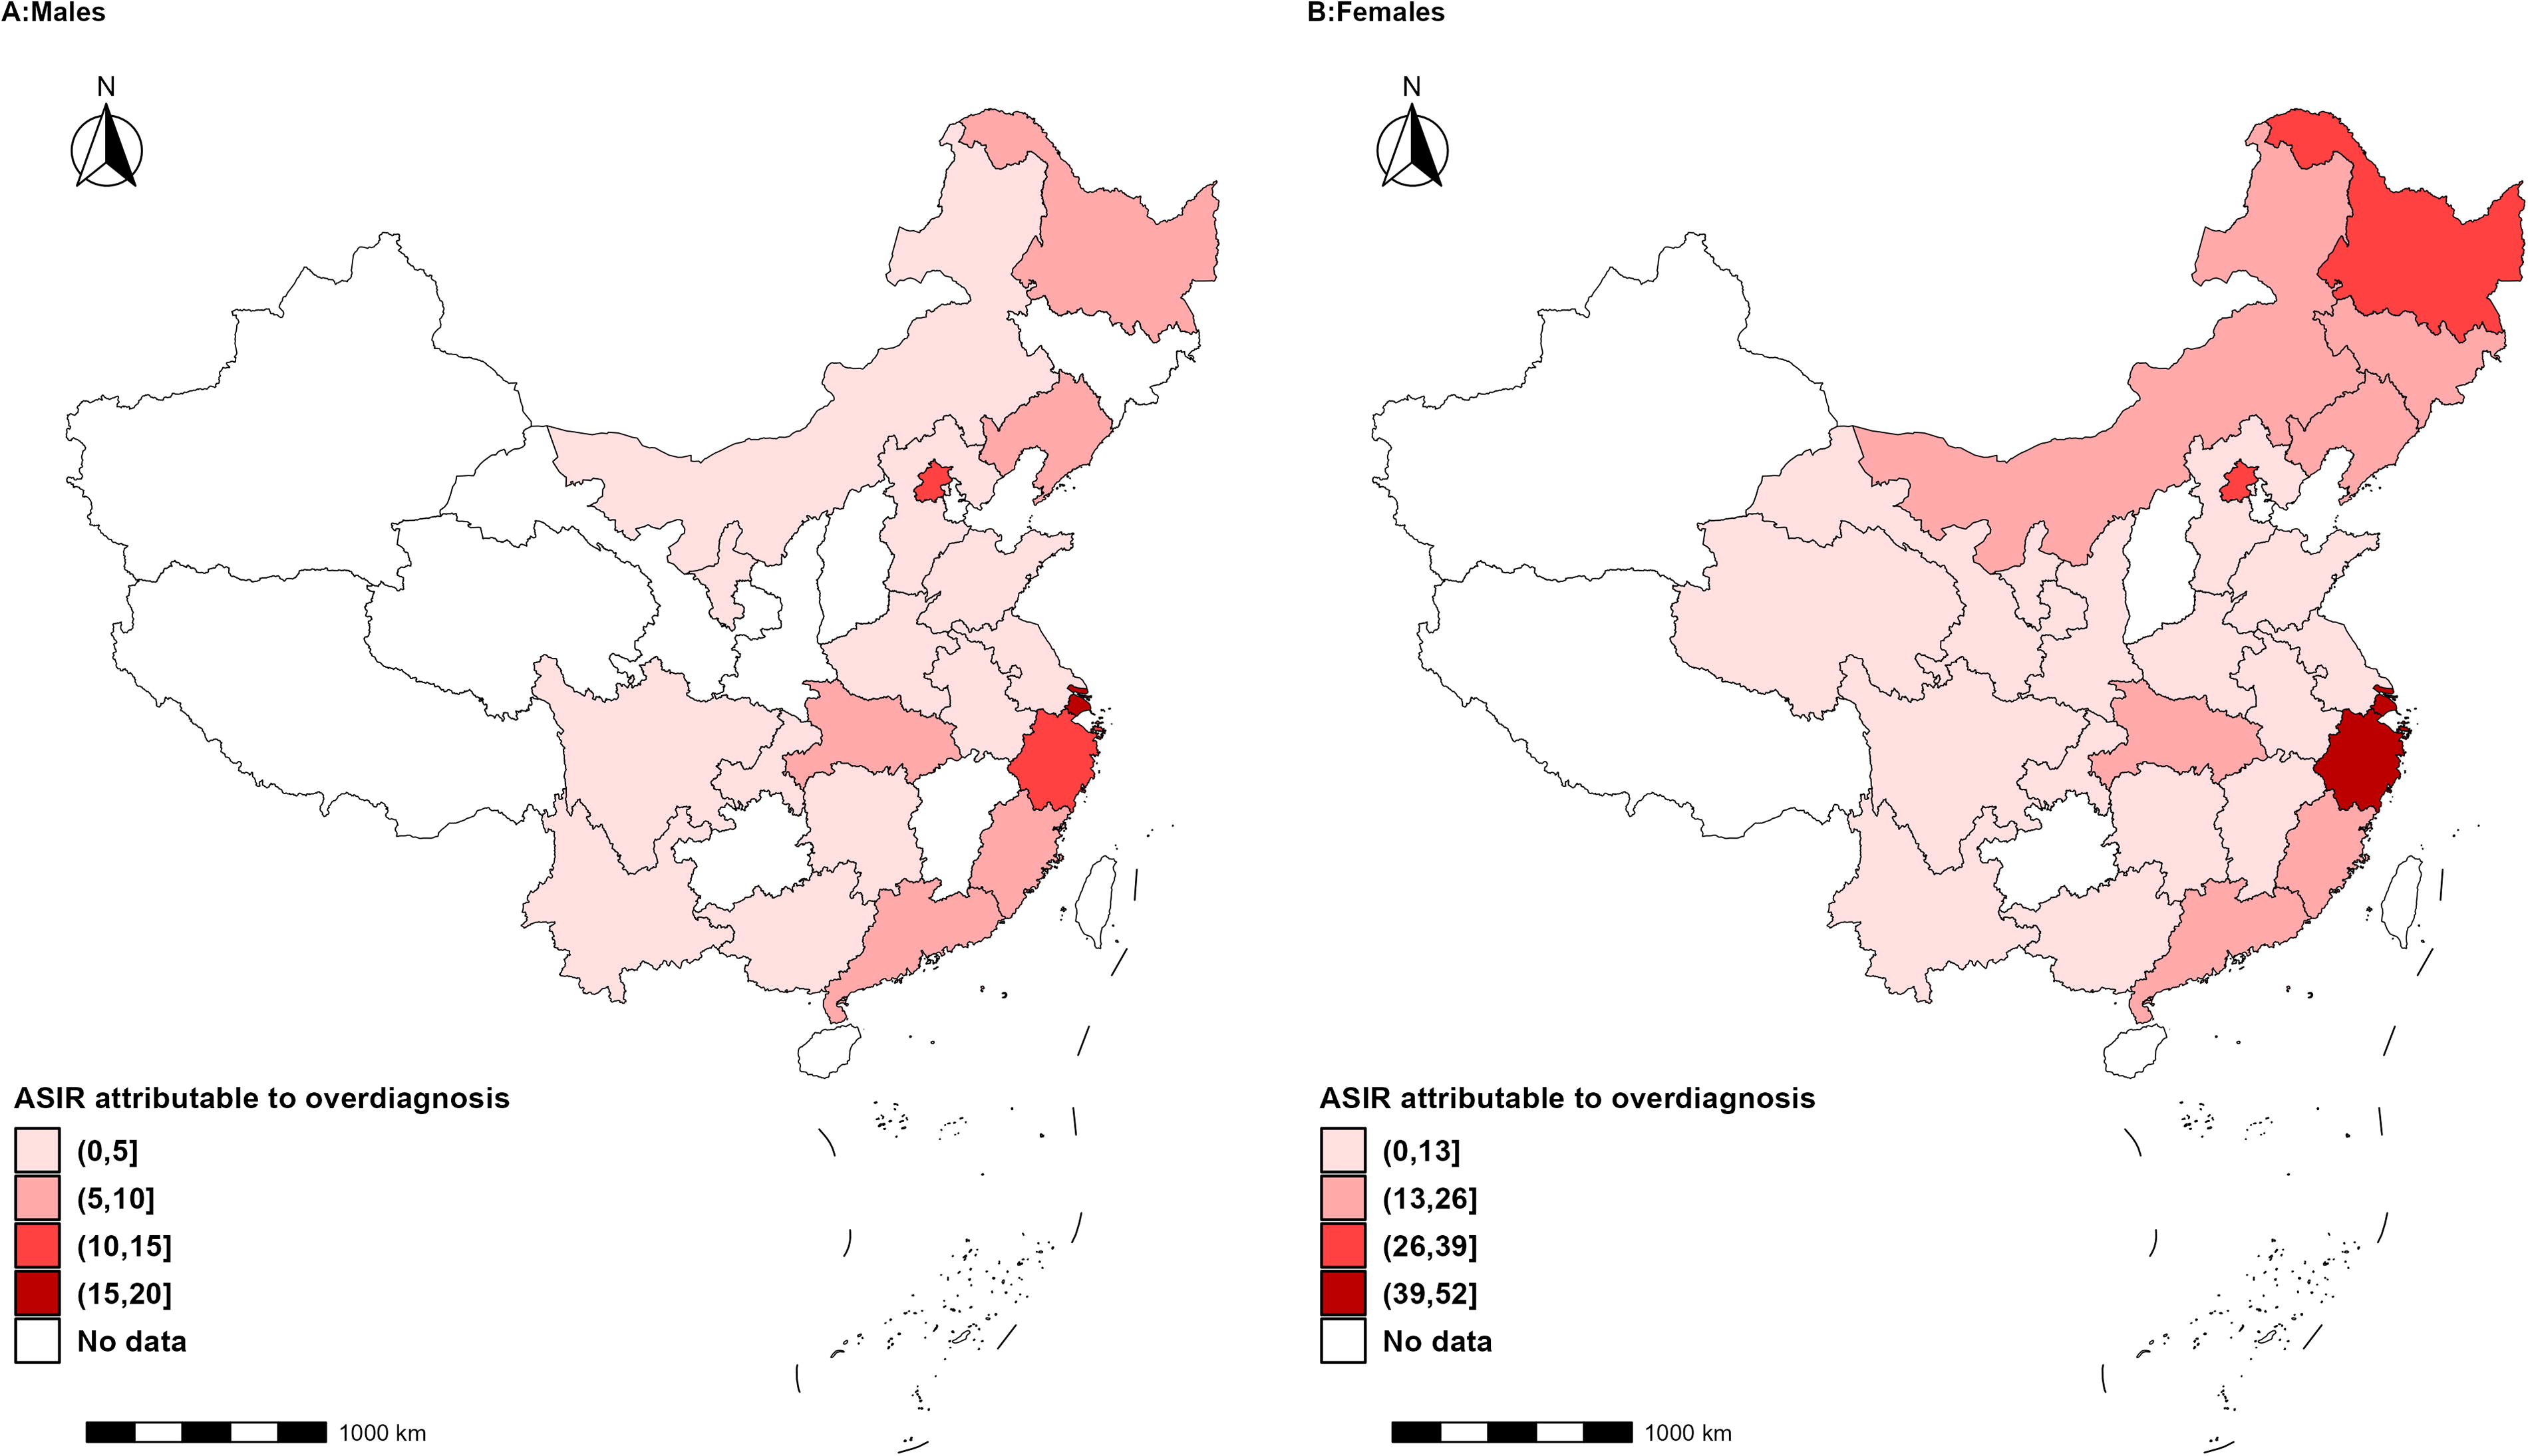
Map of age-standardized incidence rates (ASIRs) of thyroid cancer attributable to overdiagnosis in males
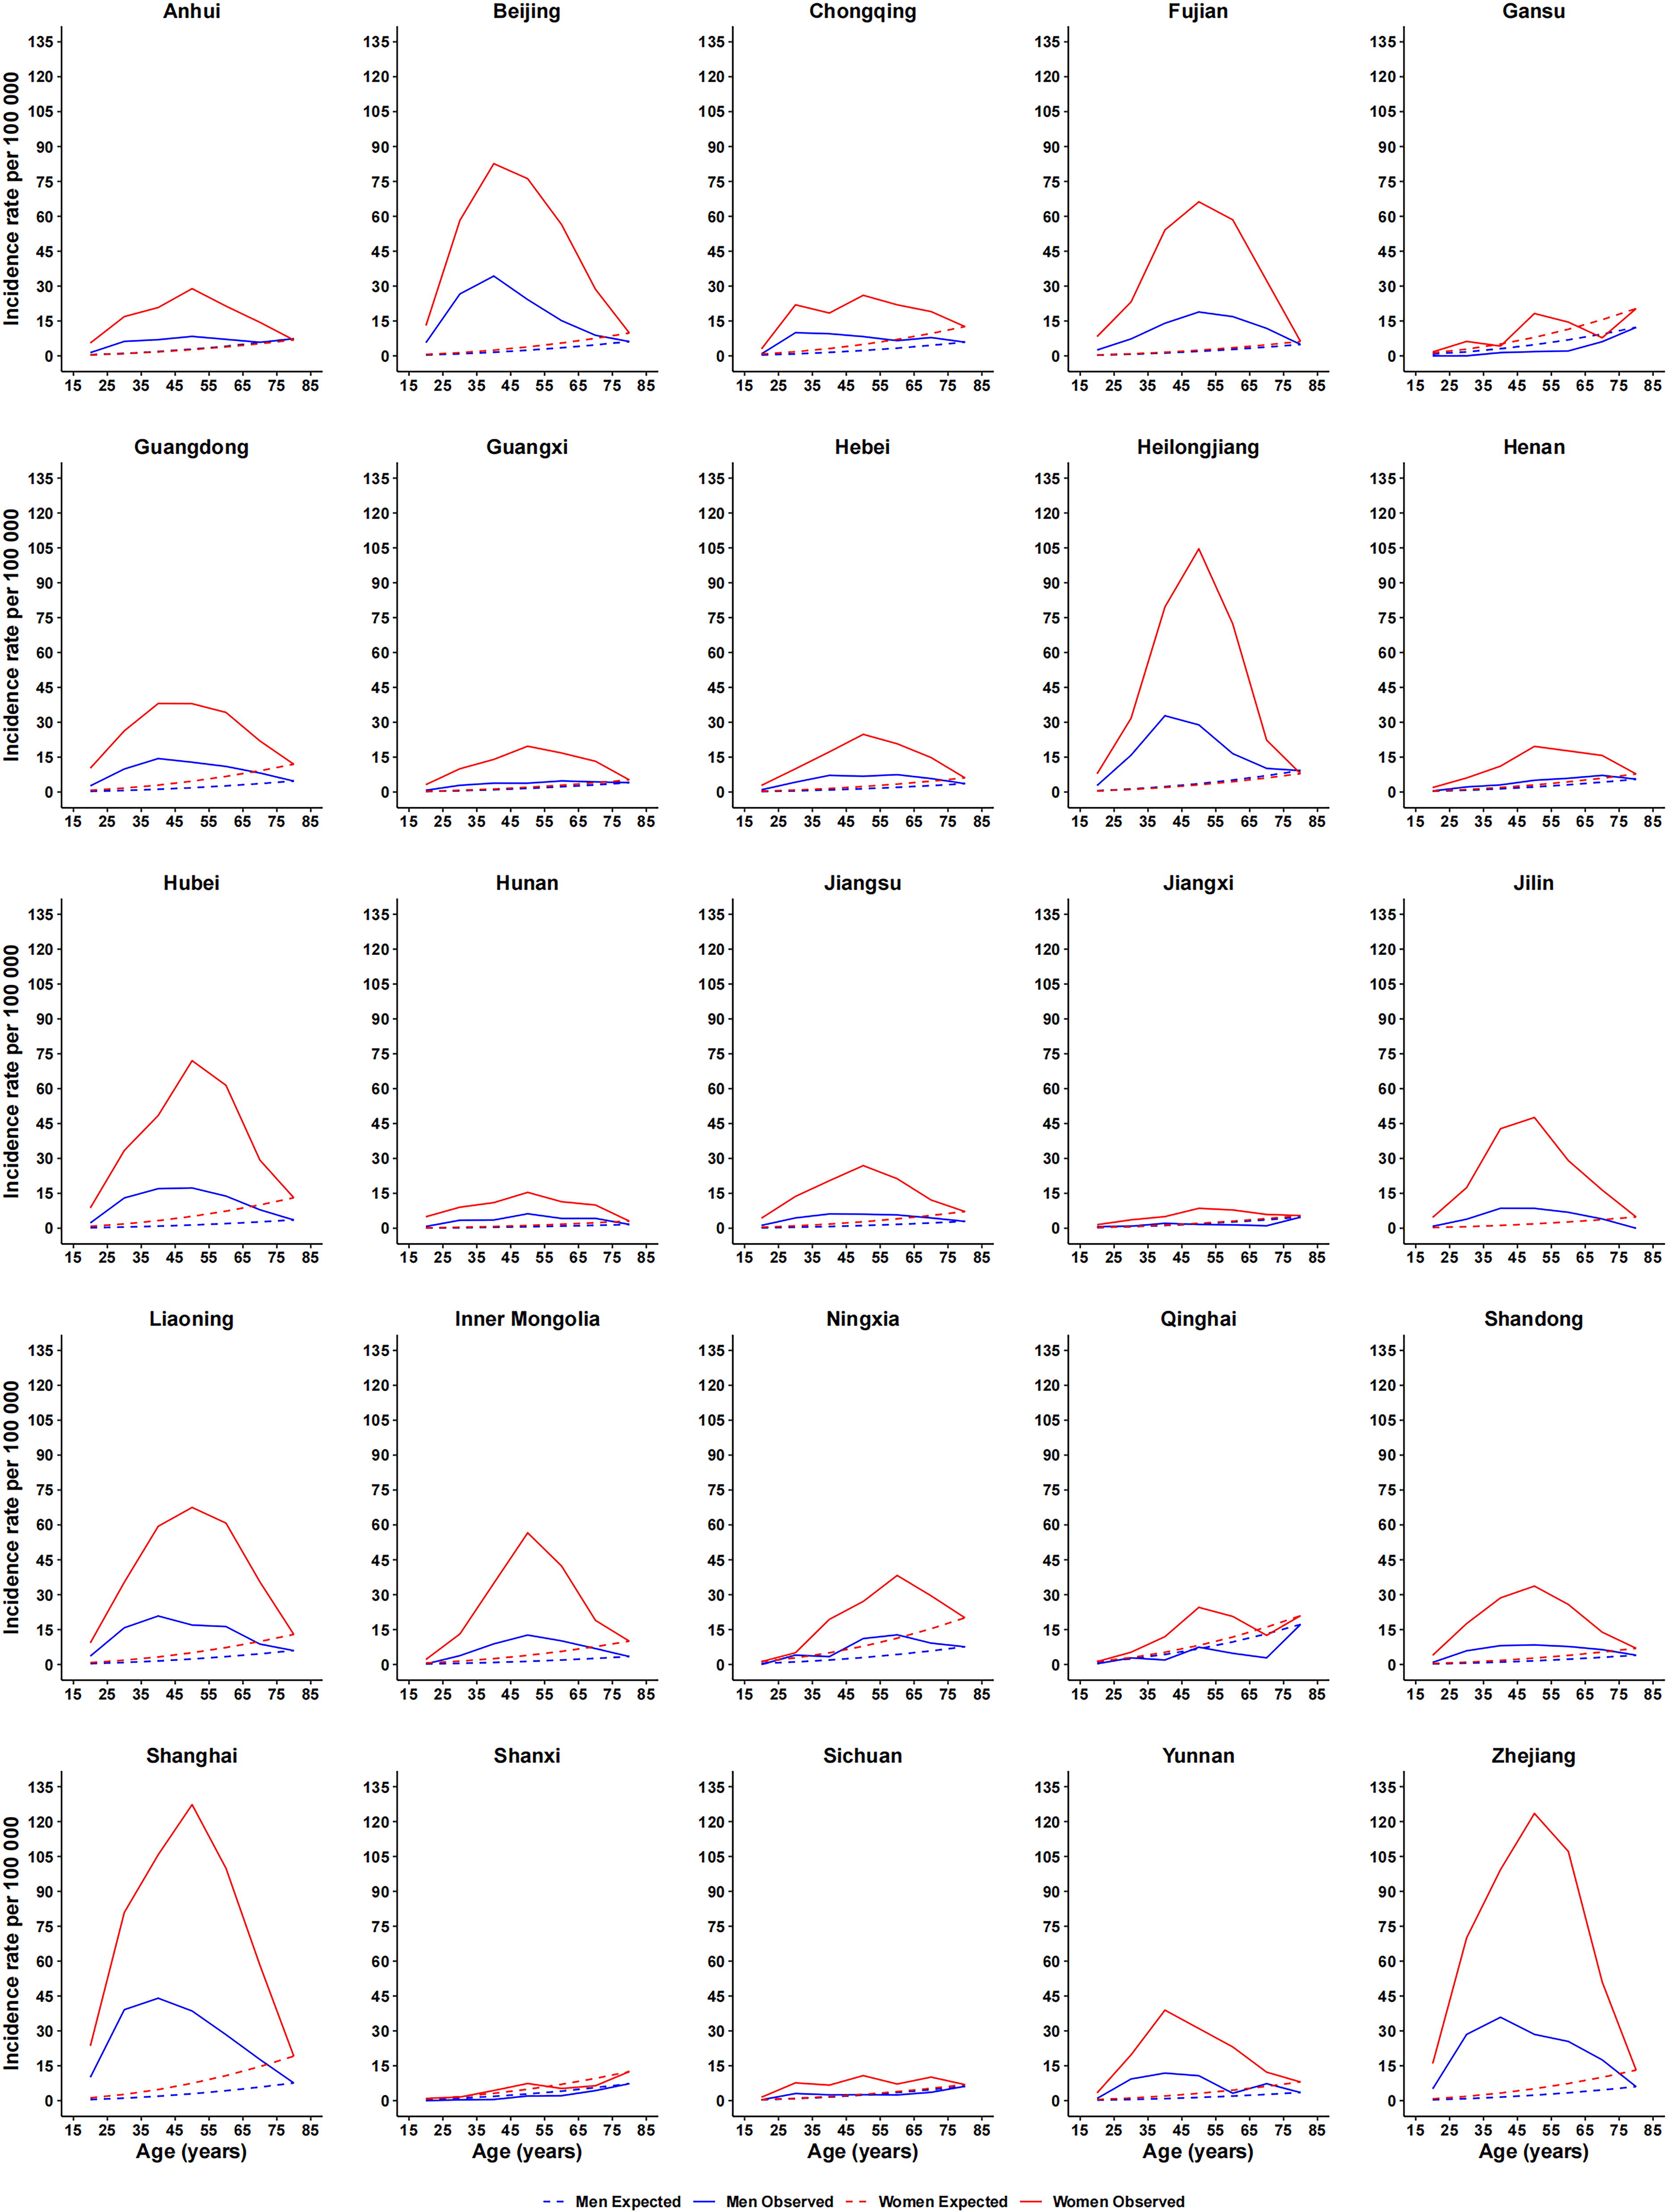
Age-specific incidence rates of thyroid cancer by sex among the 25 studied provinces in China. The blue solid and dashed lines represent the observed and expected age-specific incidence rates in males, respectively, whereas the red solid and dashed lines represent the observed and expected age-specific incidence rates in females.
At the cancer registry level, the ASIRs attributable to overdiagnosis ranged from 0.1 per 100,000 in the Cixian registry to 18.5 per 100,000 in the Shanghai registry for males and from 2.8 per 100,000 in the Cixian registry to 54.9 per 100,000 in the Hangzhou registry for females in 2013–2017, whereas they varied from 0.1 per 100,000 in the Anshan registry to 6.4 per 100,000 in the Shanghai registry for males and from 0.5 per 100,000 in the Yanting registry to 20.5 per 100,000 in the Hangzhou registry for females in 2008–2012 (Supplementary Table S4).
A one-unit (¥10,000) increase in GDP was associated with a 1.16-fold increase (95% CI: 0.80–1.52) in the ASIRs attributable to overdiagnosis in males and a 1.02-fold increase (95% CI: 0.74–1.30) in the ASIRs attributable to overdiagnosis in females on a log-log scale (Fig. 6). The corresponding Spearman correlation coefficients were 0.53 (p < 0.05) for males and 0.52 (p < 0.05) for females (Fig. 6). A one-unit (10,000 beds) increase in the number of hospital beds was associated with a 0.38-fold increase (95% CI: 0.21–0.55) in the ASIRs attributable to overdiagnosis in males and a 0.36-fold increase (95% CI: 0.23–0.50) in the ASIRs attributable to overdiagnosis in females on a log-log scale (Fig. 6). The corresponding Spearman correlation coefficients were 0.36 (p < 0.05) for males and 0.38 (p < 0.05) for females (Fig. 6).
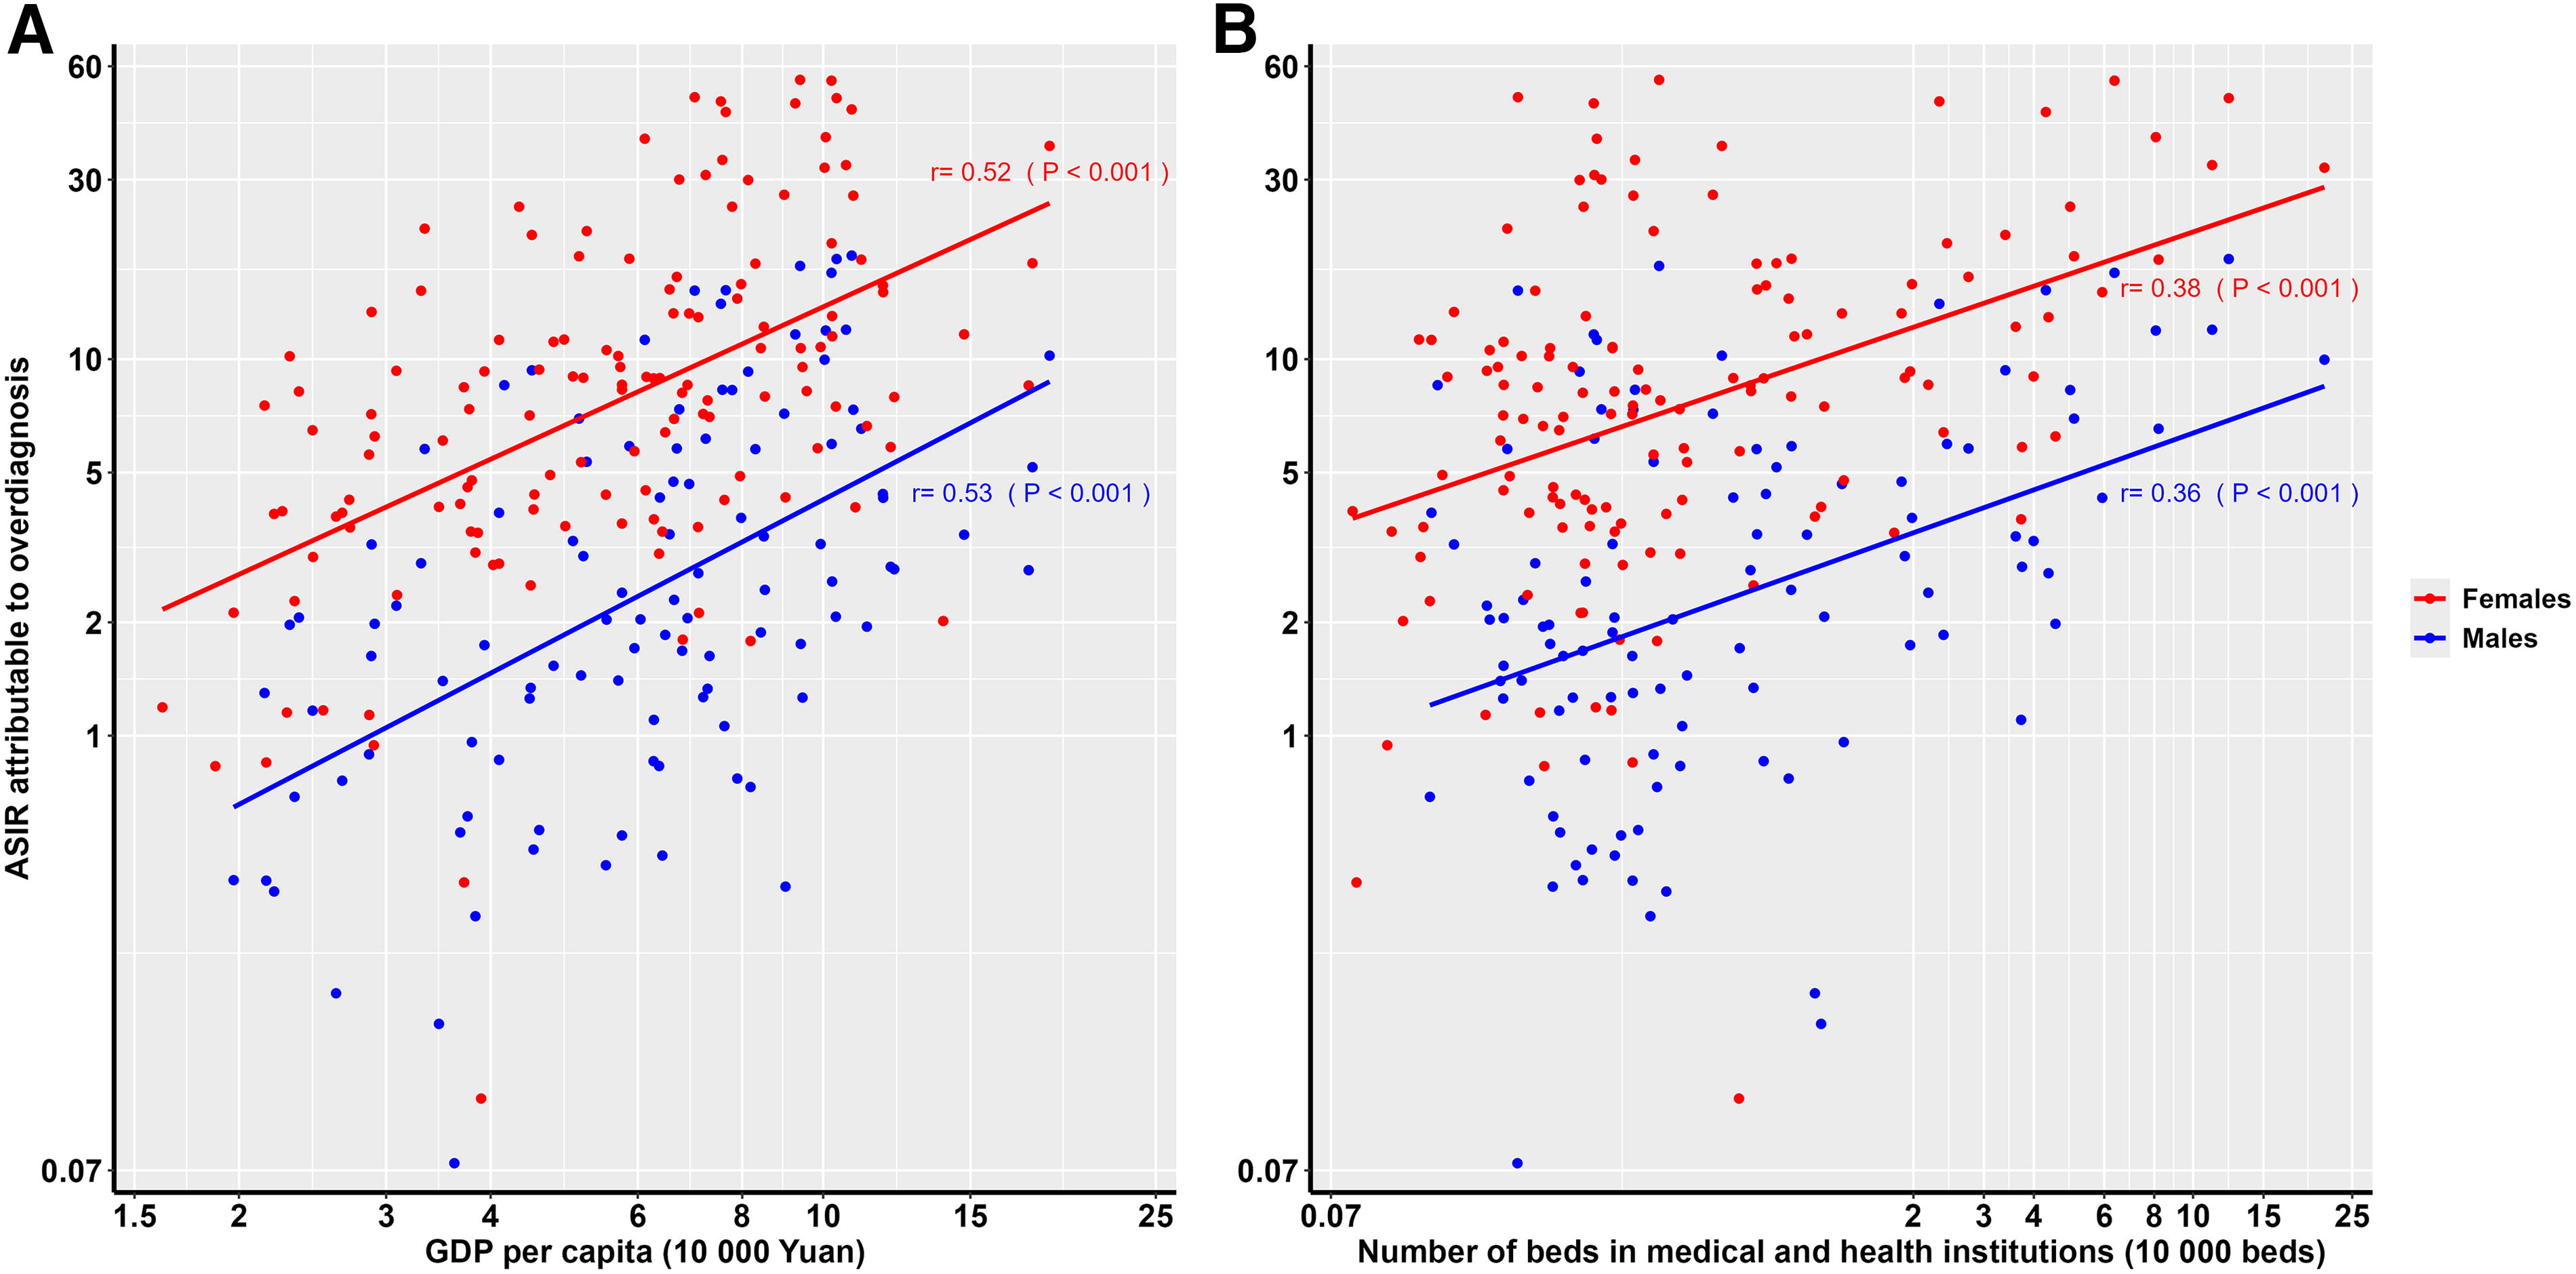
Scatter plots between age-standardized incidence rates (ASIRs) of thyroid cancer attributable to overdiagnosis in 2013–2017 and GDP per capita
For temporal variations, the ASIRs attributable to overdiagnosis of TC increased by 126.9% in males (from 2.6 per 100,000 in 2008–2012 to 5.9 per 100,000 in 2013–2017) and by 107.6% in females (from 9.2 per 100,000 in 2008–2012 to 19.1 per 100,000 in 2013–2017) at the national level (Supplementary Table S4). Notably, the increases in the ASIRs attributable to overdiagnosis of TC from 2008 to 2017 were considerably greater than the increases in the ASIRs not attributable to overdiagnosis of TC in both sexes (especially in females) at the national level and at the urban/rural level (especially in the urban population) (Supplementary Fig. S3). The large increases in the ASIRs attributable to overdiagnosis of TC were driven by the changing patterns of the ASIRs attributable to overdiagnosis of papillary TC, as the ASIRs attributable to overdiagnosis of this subtype considerably increased from 2.2 per 100,000 in 2008–2012 to 5.1 per 100,000 in 2013–2017 in males and from 6.3 per 100,000 in 2008–2012 to 16.1 per 100,000 in 2013–2017 in females (Supplementary Fig. S5).
Among the 17 cancer registries with 10 consecutive years of data, 13 cancer registries in males demonstrated that the ASIRs attributable to overdiagnosis of TC increased by more than 100.0% from 2008 to 2017, whereas those in females were observed in 10 cancer registries (Supplementary Table S4). The largest increase in the ASIRs attributable to overdiagnosis occurred in the Guanyun registry in males (from 0.4 per 100,000 in 2008–2012 to 2.8 per 100,000 in 2013–2017, thus yielding a 600.0% increase) and in the Ma’anshan registry in females (from 0.6 per 100,000 to 8.9 per 100,000, thus yielding a 1383.3% increase) (Supplementary Table S4).
Discussion
Our study demonstrated a considerable disparity between the ASIRs and the ASMRs of TC in 2013–2017 for both sexes in China, as well as between the markedly increasing ASIRs and the unchanged ASMRs over the past decade. The APC analysis revealed a quasi-inverted V-shape pattern of the age effect, a rapidly increasing trend of the period effect, and a quasi-V-shaped trend of the cohort effect for both sexes. These findings collectively suggest that overdiagnosis may be a major contributor to the increasing TC incidence in China. Indeed, our further analysis indicated that the vast majority of TC cases were attributable to overdiagnosis in China in 2013–2017. Specifically, the ASIRs attributable to overdiagnosis in females were approximately 3-fold higher than that in males. The incidence of TC attributable to overdiagnosis was mainly detected among young males and middle-aged females. The ASIRs attributable to overdiagnosis exhibited considerable geographical disparities, with the highest burden occurring in urban areas for both sexes at the urban/rural level, in East China for males and Northeast China for females among the seven geographical regions, and in Shanghai Province for both sexes across the 25 provinces. In addition, the ASIRs attributable to overdiagnosis were positively correlated with GDP per capita and the number of hospital beds per 10,000 beds. Notably, the ASIRs attributable to overdiagnosis have significantly increased over the past 10 years at the national and registry levels.
With rapid economic development in China, people have more access to healthcare, thus leading to a rapid increase in the TC detection rate. 6,32,33 In China, ultrasound and fine-needle aspiration (FNA) biopsy are the primary diagnostic modalities for evaluating all known or suspected thyroid nodules, thus facilitating the detection and assessment of TC. 34 Whilst our study demonstrated the rapidly growing discrepancy between TC incidence and mortality, a recent population-based study showed that TC had the highest 5-year relative survival rate among all cancers over the past decade in China, with survival rates of 90.9% (95% CI: 90.1–91.8) in males and 93.5% (95% CI: 93.0–94.0) in females in 2019–2021. 35 As demonstrated via joinpoint regression and APC models, the marked increase in TC incidence observed from 2008 to 2014 is likely driven by artificial factors. The pronounced period effect (demonstrated by a rapid increase in IRRs) suggests that advancements in medical diagnostics (particularly the widespread use of high-resolution ultrasound) played a crucial role in detecting previously unknown cases. 36 This diagnostic expansion coincided with an increase in routine health examinations, thus promoting the identification of subclinical or indolent cases, particularly regarding papillary TC. 15,36 Thus, these findings largely reflect the impact of overdiagnosis on TC incidence.
A key assumption in quantifying TC overdiagnosis in our data analysis is that the carcinogenic risks of TC have remained unchanged over time. For example, increasing obesity levels may increase TC incidence, but the associations of obesity with TC risk are weak. 37,38 Indeed, our APC analysis indicated that the changing trends of the period effect are more pronounced than those of the cohort effect in both sexes (especially in females). Hence, despite the potential influence of TC risk factors, overdiagnosis remains the predominant driver of the marked increase in TC incidence. Specifically, the stable mortality rates, coupled with the disproportionate increase in incidence rates, underscore the significant role of enhanced diagnostic practices in detecting subclinical and indolent TC cases. Furthermore, a critical methodological assumption in this study was that the expected incidence of TC followed the historical age curve observed before the introduction of ultrasound technology and other new diagnostic techniques. 29 This assumption was supported by the long-term stability of age-specific incidence patterns in Nordic cancer registries with high-quality data, which were unaffected by diagnostic advancements. 4,15,23 This historical reference can provide a reliable benchmark for distinguishing true changes in incidence from those driven by overdiagnosis, such as the increased use of high-resolution ultrasound. By applying this validated method, our study ensured a robust framework for quantifying overdiagnosis and interpreting deviations in observed incidence rates. The last assumption in our data analysis is that the observed and expected incidence rates at the oldest age were the same. If not all of the TC cases at older ages were diagnosed, the “expected” incidence would be artificially low. Specifically, a large number of underdiagnosed cases would be needed to invalidate our findings because the peak of the inverted V-shaped age-specific incidence curve is so high.
Previous studies have shown that TC overdiagnosis is associated with mass screening for TC in the population. 6 No organized TC screening program has been performed in China; however, thyroid ultrasound has been included in the physical examination list in some regions (e.g., Beijing, Guangzhou, and Shanghai). 39 Our findings indicated that the highest incidence rates of TC attributable to overdiagnosis were observed in male individuals aged 35–44 years and in female individuals aged 45–54 years in China, underscoring the need to reduce screening for asymptomatic TC in these populations.
Our findings showed that TC incidence attributable to overdiagnosis had distinct sex differences, with higher incidence rates in females than in males. A previous study indicated that the proportion of TC cases attributable to overdiagnosis was 72.0% (4853/6739) in males and 82.0% (17,295/21,103) in females in 2008–2012 in China based on data from 35 cancer registries. 15 Similar findings have been reported in other countries. In South Korea, overdiagnosis accounted for 70% of TC cases in males and 90% of TC cases in females from 2003 to 2007. 6 In India, no evidence of overdiagnosis was observed in males, whereas overdiagnosis accounted for 51% of TC cases in females. 40 The sex differences may be attributable to women having more opportunities to obtain access to medical examinations, such as X-rays and ultrasounds. 23 An increase in imaging has led to increases in the detection and treatment rates of papillary TC. 41,42 Moreover, many newly diagnosed papillary TCs are incidentally discovered during imaging for other health issues. 43 Pregnancy, contraception, and perimenopausal symptoms lead to more frequent and earlier medical monitoring for females than for males. 23 However, most papillary TCs are indolent and unlikely to cause significant health problems. 32,44
The geographic variations in TC incidence attributable to overdiagnosis may be largely related to the availability of medical resources across regions. In areas with greater availability of medical resources, overdiagnosis of TC is more common, thus leading to a higher TC incidence attributable to overdiagnosis. 45,46 The higher TC incidence attributable to overdiagnosis in urban areas could be explained by the inclusion of thyroid ultrasound procedures in basic medical insurance plans for employees. 15 There is a significant imbalance in the distribution of medical resources in China, which is mainly reflected in medical facilities and medical personnel. Hospitals in large cities (e.g., Beijing, Shanghai, and Hangzhou, where we observed substantial TC overdiagnosis) and coastal areas (e.g., Dalian and Zhuhai, where we observed substantial TC overdiagnosis) have more advanced medical equipment and facilities, whereas hospitals in the central and western regions and inland areas often have outdated equipment. 47 Large cities and coastal areas have more doctors with better medical expertise, whereas central and western regions and inland areas have fewer doctors and lower medical standards. 47 Overall, medical resources are concentrated in large cities and coastal areas, whereas central and western regions and inland areas have relatively fewer medical resources. 47
A previous study revealed a positive correlation between TC incidence and GDP, as well as between TC incidence and the number of hospital beds. 15 Furthermore, our study revealed that TC incidence attributable to overdiagnosis was strongly correlated with GDP and the number of hospital beds. Regions with higher GDPs also have higher TC incidences attributable to overdiagnosis (e.g., Beijing, Shanghai, and Hangzhou). Conversely, people in these areas with high GDPs are also highly educated, thereby indicating that they possess more health consciousness and focus more attention on their own health. 14,15 Frequent visits to the hospital may lead to higher rates of TC detection. This may also explain why TC incidence attributable to overdiagnosis is correspondingly high in regions with high GDPs. The number of hospital beds in inland areas is significantly lower than that in coastal cities and some major cities. 47 A similar phenomenon is observed in TC incidence attributable to overdiagnosis. Overall, coastal areas and major cities, which are rich in economic and medical resources, have higher TC incidences attributable to overdiagnosis. Conversely, regions with less developed economic and medical resources have relatively lower TC incidence rates, which is attributable to overdiagnosis.
An analysis of the trends in TC incidence attributable to overdiagnosis across 17 registries spanning 10 years revealed that nearly all registries demonstrated a significant increase in TC incidence attributable to overdiagnosis. In addition, the incidence of TC attributable to overdiagnosis in urban and rural areas in 2013–2017 was higher than that in 2008–2012. This phenomenon may be related to the number of included cancer registries; specifically, there were only 21 urban registries in 2008–2012, in comparison with 110 in 2013–2017, and only 14 rural registries in 2008–2012, in comparison with 47 in 2013–2017. As the number of included registries increases, population coverage also expands, which may contribute to the increase in TC incidence attributable to overdiagnosis. China launched a major healthcare reform in 2009, promising equal access to basic healthcare services for all citizens; 48 consequently, the physical examination rate in adults significantly increased from 28.2% in 2010 to 41.0% in 2018 in China. 49 With the influence of national health policy, people are currently more likely to obtain access to tests for early asymptomatic diseases (including TC), which may partly explain the increase in TC incidence attributable to overdiagnosis in recent decades.
With the increasing detection of asymptomatic TC driven by expanded healthcare access and national health policies, attention has transitioned to the appropriate management of low-risk cases to avoid overtreatment. Although surgery remains the standard treatment for TC in China, the indolent nature of most papillary TC suggests that immediate surgical intervention may not be necessary for all patients, particularly those with extremely low-risk disease. 34,50 Active Surveillance (AS) is a management strategy for low-risk TC, particularly papillary thyroid microcarcinoma (PTMC), that involves regular monitoring of the tumor through imaging and clinical evaluation without immediate surgical intervention. AS aims to identify disease progression early while avoiding overtreatment and its associated risks. Japanese guidelines suggest that AS of low-risk PTMC is a safe management strategy offering favorable outcomes and preserves quality of life at low cost if applied properly, 51 while the 2015 American Thyroid Association guidelines discuss consideration of AS of PTMC without clinically evident metastases or local invasion. 52 However, in China, AS research is limited, with the Guidelines for the Diagnosis and Management of Thyroid Nodules and Differentiated Thyroid Cancer (2nd Edition) prioritizing surgery as the primary treatment. 34 This emphasis on surgical intervention reflects the prevailing approach in clinical practice, particularly for managing thyroid nodules with suspicious features. For further diagnostic evaluation of thyroid nodules, particularly for those <1 cm in diameter, the Chinese Guidelines for the Diagnosis and Management of Thyroid Nodules and Differentiated Thyroid Cancer (2nd Edition) provide clear guidance to identify cases where FNA biopsy is necessary under specific conditions: (1) if the physician plan to perform surgery or provide ablation therapy for the patient, (2) if suspicious nodules are multifocal or located near the thyroid capsule, trachea, and recurrent laryngeal nerve, (3) if suspicious cervical lymph node metastasis is detected, (4) if serum calcitonin levels are elevated, (5) if there is a family history of TC or a personal history of TC syndromes. 34 However, the 2015 American Thyroid Association guidelines do not specifically recommend FNA biopsy of suspicious thyroid nodules <1 cm in size. 52 Despite the preferences for surgical intervention according to Chinese Guidelines, AS presents a promising alternative for low-risk TC in China. Its potential for mitigating the burden due to overtreatment by improving management underscores the need for further research and tailored implementation within the Chinese healthcare context.
To the best of our knowledge, this study is the first to provide a comprehensive and recent epidemiological profile of TC incidence and estimates of overdiagnosis in China using the most up-to-date CI5 data with the highest levels of accuracy, completeness, and comparability. Specifically, although previous studies have reported TC incidence attributable to overdiagnosis in 2008–2012 using data from 35 cancer registries in China, they only encompassed 4.1% of the national population across 14 provinces; 15,23 although a recent publication has depicted an upward trend of TC incidence rates from 2003 to 2017 and reported the estimates of TC overdiagnosis in 2013–2017 at the national level in China, they did not report the annual percent changes of TC incidence rates over time and examine geographic variations in TC incidence and the incident burden attributable to overdiagnosis at the urban/rural and provincial level. 10 Whilst this recent publication showed that 31,304 (85.6%) of 36,568 cases and 101,198 (88.6%) of 114,197 cases in males and females aged 25–84 years were attributable to TC overdiagnosis in 2013–2017 in China and did not report the detailed figures of TC incidence rates attributable to overdiagnosis, 10 our study presented that 31,455 (83.5%) of 37,685 cases and 104,222 (88.7%) of 117,509 cases in males and females aged 15–84 years were attributable to TC overdiagnosis in the same diagnosed period, with the corresponding rates of 5.9 and 19.1 per 100,000, respectively. In addition, all these publications did not provide evidence to support the key assumption of the existence of TC overdiagnosis in China through the analysis of the epidemiological profile of TC incidence and mortality. 10,15,23 In comparison with the findings of all these publications, 10,15,23 a novel finding of our study is a deeper understanding of TC epidemiology and the evidence for the considerable impact of overdiagnosis on TC incidence in China by demonstrating the rapidly growing discrepancy between TC incidence and mortality over the past decades and the pronounced period effect (compared to the cohort effect). Furthermore, our study demonstrated a 2-fold increase in TC incidence rates attributable to overdiagnosis between 2008–2012 and 2013–2017 and the considerable geographic variations across 25 provinces according to 157 cancer registries in 2013–2017, thus representing 13.2% of the national population, as well as presenting the significant positive correlation between TC overdiagnosis and GDP or the number of hospital beds. Therefore, these novel findings provide deeper insights for China’s National Health Commission to develop national guidelines with the aim of reducing the current and future burden of TC incidence attributable to overdiagnosis.
Some limitations should be acknowledged. First, the population coverage in our study remains insufficient, and data aggregated from multiple cancer registries within each region may not necessarily be representative of the regional profile, which highlights the need for more high-quality cancer registry data in China. Second, the individual records of TC cases are unavailable in the Cancer Incidence in Five Continents databases; in such cases, we were unable to present information regarding the sizes and stages of the tumors. Third, TC incidence attributable to overdiagnosis cannot be estimated in several regions where the small number of TC cases led to random variation in data analysis. Fourth, ethnic disparities may exist in cases when we used the k-value in the multistage model that was derived from population data based on the four Nordic countries prior to the introduction of new diagnostic technologies. Thus, these findings should be interpreted with caution. Finally, we did not examine the burden of TC overdiagnosis at the global level; instead, we focused on the country with the largest burden of TC incidence worldwide. In such cases, our findings could provide early warnings of population health issues due to TC overdiagnosis for developing countries with similar healthcare systems and emerging diagnostic capacities, as well as for countries without appropriate guidelines on TC screening practices and management.
In conclusion, the incidence rates of TC have been considerably increasing over the past several decades in comparison with the low and stable mortality rates in China. The burden of TC incidence attributable to overdiagnosis has become increasingly severe in China in the past decade. Our study identified targeted populations with a high burden of TC incidence attributable to overdiagnosis based on sex, age group, and geographic region in China, which provides clues for cancer specialists and policy makers in adjusting TC screening strategies and clinical practice and optimizing the allocation of healthcare resources accordingly. Specifically, new strategies are needed to discourage opportunistic TC screening practices in asymptomatic general populations lacking specific risk factors, whereas less aggressive guidelines (e.g., watchful-waiting and AS approaches for low-risk lesions) should be developed and applied for the management of thyroid nodules and TC in China. In addition, our findings underscore the need for continued monitoring of the impact of TC overdiagnosis on population health (e.g., side effects due to overtreatment), given the significant burden of TC overdiagnosis and its treatment.
Footnotes
Acknowledgment
The authors gratefully acknowledge all cancer registries and their staff who have contributed to sharing their data needed for this study.
Authors’ Contributions
Y.Z. contributed to the conceptualization, project administration, supervision, methodology, data analysis, data visualization, data interpretation, and writing (original draft, reviewing, and editing) of the article. Q.Z. contributed to data curation, methodology, data analysis, data visualization, data interpretation, and writing (original draft, reviewing, and editing) of the article. J.L. and J.H. contributed to data curation. Y.Z. and Q.Z. have accessed and verified all the data in the study. All authors had full access to all data in the study, reviewed and approved the article, and accepted responsibility for the decision to submit it for publication. Y.Z. had final responsibility for the decision to submit for publication.
Author Disclosure Statement
The authors declare no competing interests.
Funding Information
Y.Z. is supported by the Natural Science Foundation of China Young Scientist Fund (Grant Number: 82404376), the Young Innovative Talents Project of General Universities in Guangdong Province in China (Grant Number: 2023KQNCX023), the Medical Scientific Research Foundation of Guangdong Province in China (Grant Number: A2024152), and the Funds for Researcher of Guangdong Medical University in China (Grant Number: GDMUB2023025). The funders had no role in study design, data collection, data analysis, data interpretation, writing the article, or the decision to publish.
Supplementary Material
Supplementary Figure S1
Supplementary Figure S2
Supplementary Figure S3
Supplementary Figure S4
Supplementary Figure S5
Supplementary Table S1
Supplementary Table S2
Supplementary Table S3
Supplementary Table S4