
Abstract
Background:
Most current guidelines recommend fine-needle aspiration (FNA) biopsy of thyroid nodules based on grayscale ultrasound (GUS) features, but the biopsy rate for benign nodules remains high. Our aim was to construct a new pattern-based microvascular classification (PBMC) for thyroid nodules to develop and validate predictive multimodality US models based on GUS, microvascular flow imaging, and shear wave elastography, and compare FNA decision accuracy with the American College of Radiology Thyroid Imaging Reporting and Data System (ACR TI-RADS).
Methods:
This prospective study included consecutive patients with thyroid nodules who underwent multimodality US examinations from September 2022 to December 2023. Using PBMC, lesions were divided into three categories: malignant signs (convergence sign, piercing sign, and spoke wheel sign), benign signs (ring sign), and other vascular patterns. Univariate and multivariable logistic regression analyses were conducted to determine the odds ratios (ORs) of US features, including vascular signs, and construct predictive models based on multimodality US. Multimodality US models were validated with internal cross-validation and evaluated based on discrimination, calibration, and decision curve analyses.
Results:
Overall, 793 thyroid nodules confirmed using pathological analysis (248 benign and 545 malignant) in 599 participants (mean age, 43 years ±11 [SD]) were included. In univariate logistic regression analyses, malignant vascular signs showed a positive association with malignant nodules (OR: 10.43, 95% confidence interval [CI]: 5.76, 18.88; p < 0.01), whereas benign vascular signs were inversely associated with malignancy (OR: 0.10, 95% CI: 0.06, 0.16; p < 0.01). Four multivariable models incorporated GUS features, Young’s modulus, and PBMC. The highest area under the receiver operating characteristic curve (AUC) was 0.95 (95% CI: 0.82, 0.97) for the multimodality US model, and the lowest AUC was 0.62 (95% CI: 0.57, 0.66) for ACR TI-RADS based on GUS (p < 0.001). At a 71% risk threshold, multimodality US avoided 27% (95% CI: 21, 34) of FNA procedures, compared with 13% (95% CI: 0, 38) with TI-RADS (p < 0.001).
Conclusion:
Visual assessment of microvascular morphology patterns may improve differentiation of benign and malignant thyroid nodules and potentially reduce the risk of unnecessary biopsy of benign thyroid nodules.
Introduction
Thyroid nodules are common with a malignancy rate of 7–15%. 1 Some thyroid nodules are subject to unnecessary biopsy due to the limitation in specificity of grayscale ultrasound (GUS). 2,3 Techniques such as microvascular flow imaging (MVFI) and shear wave elastography (SWE) have been reported to have positive results in diagnostic capabilities, 4,5 and hold promise for integration with GUS to enhance fine needle aspiration (FNA) management.
MVFI is an umbrella term encompassing multiple proprietary manufacturers’ brand names, 6 including Superb Microvascular Imaging and Angio Planewave Ultrasensitive Imaging (Angio PLUS, AP), the latter can visualize microvascular structures smaller than 0.1 mm in diameter or with flow velocities under 1 mm/s without contrast agents. 7 Meanwhile, previous studies have confirmed that microvascular perfusion assessed by contrast-enhanced ultrasound (CEUS) aids in managing FNA, 8,9 but CEUS is invasive and limited by contraindications to the contrast agent. Angio PLUS is a non-invasive alternative to CEUS, which relies on unfocused, or plane waves and 3D wall filtering to enhance the detection and spatial resolution of microvascular blood flow. 5,10 However, current thyroid vascular classification methods, such as Kim’s semi-quantitative method, 11 and Adler’s grade, 12 have not been widely used in clinical practice because their consistency and reliability remain debated. 13,14 In clinical practice, we have observed that thyroid cancer exhibits a discontinuous inward-converging peripheral vascular pattern, which is what we call “convergence” sign. Hence, we aim to construct a particular pattern-based microvascular classification (PBMC) based on Angio PLUS and integrate it into multimodality ultrasound practices.
SWE offers a quantitative analysis of nodule stiffness by measuring elasticity parameters within the region of interest (ROI), providing additional information for nodule assessment. 15 However, SWE has limitations, as calcifications and nonsolid composition are susceptible to a high rate of false-positive diagnoses. 16,17 Previous research has shown that combining MVFI and SWE can enhance diagnostic performance. 18,19 Therefore, by integrating acoustic characteristics, morphological structure, composition, textures, and vascular patterns, we infer that multimodality US can allow for more accurate malignant risk prediction and better FNA management for thyroid lesions.
Methods
Data from this prospective single-center cohort study were collected from patients evaluated at the Fifth Affiliated Hospital of Sun Yat-sen University between September 2022 and December 2023. This research was registered (Clinicaltrials.gov; NCT06530771) and received approval from the Ethics Committee of the Fifth Affiliated Hospital of Sun Yat-sen University (approval no. K01-1 in 2023). Written informed consent was obtained from all participants.
Study participants
Consecutive patients meeting inclusion criteria were enrolled in the study. The inclusion criteria were as follows: (i) age >18 years; (ii) presence of distinct thyroid nodules detected by previous US examinations which were subject to conventional US, SWE, and AP successively in the same session; and (iii) surgical confirmation of the pathological findings.
The exclusion criteria were as follows: (i) pregnancy or a history of neck surgery or cancer; (ii) poor image quality (due to coughing, speaking, and neck movement; intermittent scanning and improper probe compression); (iii) incomplete images or examination reports; and (iv) nodules with coarse calcifications obscured by shadowing. The patients were divided into training and validation sets at a 7:3 ratio using simple randomization (R software, version 4.3.1; randomizr R package).
Examination procedures
Thyroid nodules were examined using a Supersonic Aixplorer system (SuperSonic Imagine, Aix-en-Provence, France) equipped with a 5–14 MHz linear transducer. Two experienced ultrasound radiologists (J.M.C. with 5 years and X.W. with 15 years of experience in thyroid imaging) performed all examinations, recording multimodality ultrasound features simultaneously while remaining blinded to clinical details. Images would be reassessed by an expert (Z.Z.S., with 25 years of experience in thyroid imaging) when a disagreement between two reviewers existed. Postoperative pathology was regarded as the gold standard. For patients with multiple thyroid nodules, lesions must be concordantly identified by both ultrasound and pathology experts.
At the initiation meeting, the protocol regarding the examination methods, image storage, and relevant data upload for the GUS, SWE, and Angio PLUS (Supplementary Appendix) was approved by the principal investigator. Before recruitment, two radiologists conducted 10 training examinations, which were supervised and validated by the quality controller (Y.H.L., with over 15 years of experience in thyroid US) to ensure data reliability.
Evaluation criteria
Conventional US
Each nodule was assessed and scored following the American College of Radiology Thyroid Imaging Reporting and Data System (ACR TI-RADS), including composition, echogenicity, shape, margin, and echogenic foci. We abstracted the US features, including nodule composition (solid or nonsolid), echogenicity (hyperechoic or non-hyperechoic), nodule shape (wider-than-tall or taller-than-wide), nodule margin (irregular or regular), and echogenic foci (the presence or absence of punctate echogenic foci). FNA recommendations were determined based on the TI-RADS level and the largest nodule diameter.
Shear wave elastography
After acquiring GUS images, SWE measurements were performed using the device manufacturer’s quantification tool, “Q-Box,” to position a 3-mm diameter ROI. The parameters measured included the mean (Emean), minimum (Emin), maximum (Emax), and standard deviation (Esd) of the elasticity index (kPa). The nodule ROI was positioned at the hardest part of the nodule, avoiding calcifications, cystic components, and areas with color defects, while the thyroid ROI was placed in the surrounding thyroid parenchyma at the same depth to calculate the elasticity ratio (ER). This allows a comparison between the mean elasticity of the nodule and the parenchyma. Three SWE images were obtained for each target nodule.
Angio PLUS
PBMC of thyroid nodules were categorized into five types in AP mode (Fig. 1): (i) Convergence sign: predominantly peripheral discontinuity vessels, most of which converge from the periphery inward, penetrating the nodule; (ii) Piercing sign: one or two thick vessels penetrating the nodules, where the vessel length exceeds half of the nodule’s diameter, with no discontinuous annular peripheral vessel present; (iii) Spoke wheel sign: at least three vessels radiating from the nodule’s center to its periphery, with or without peripheral flow; (iv) Ring sign: a continuous ring-like blood vessel encircling at least half of the nodule’s margin, with or without internal flow; (v) Other vascular patterns: blood flow patterns in nodules that do not fit any of the categories above. Notably, patterns i to iii indicate malignancy, while pattern iv is typical of benign conditions. As shown in Figure 1, the silhouette map in AP mode enables masking the grayscale imaging of lesions and thyroid parenchyma outside the microvascular area, focusing exclusively on the microvessels within the ROI.
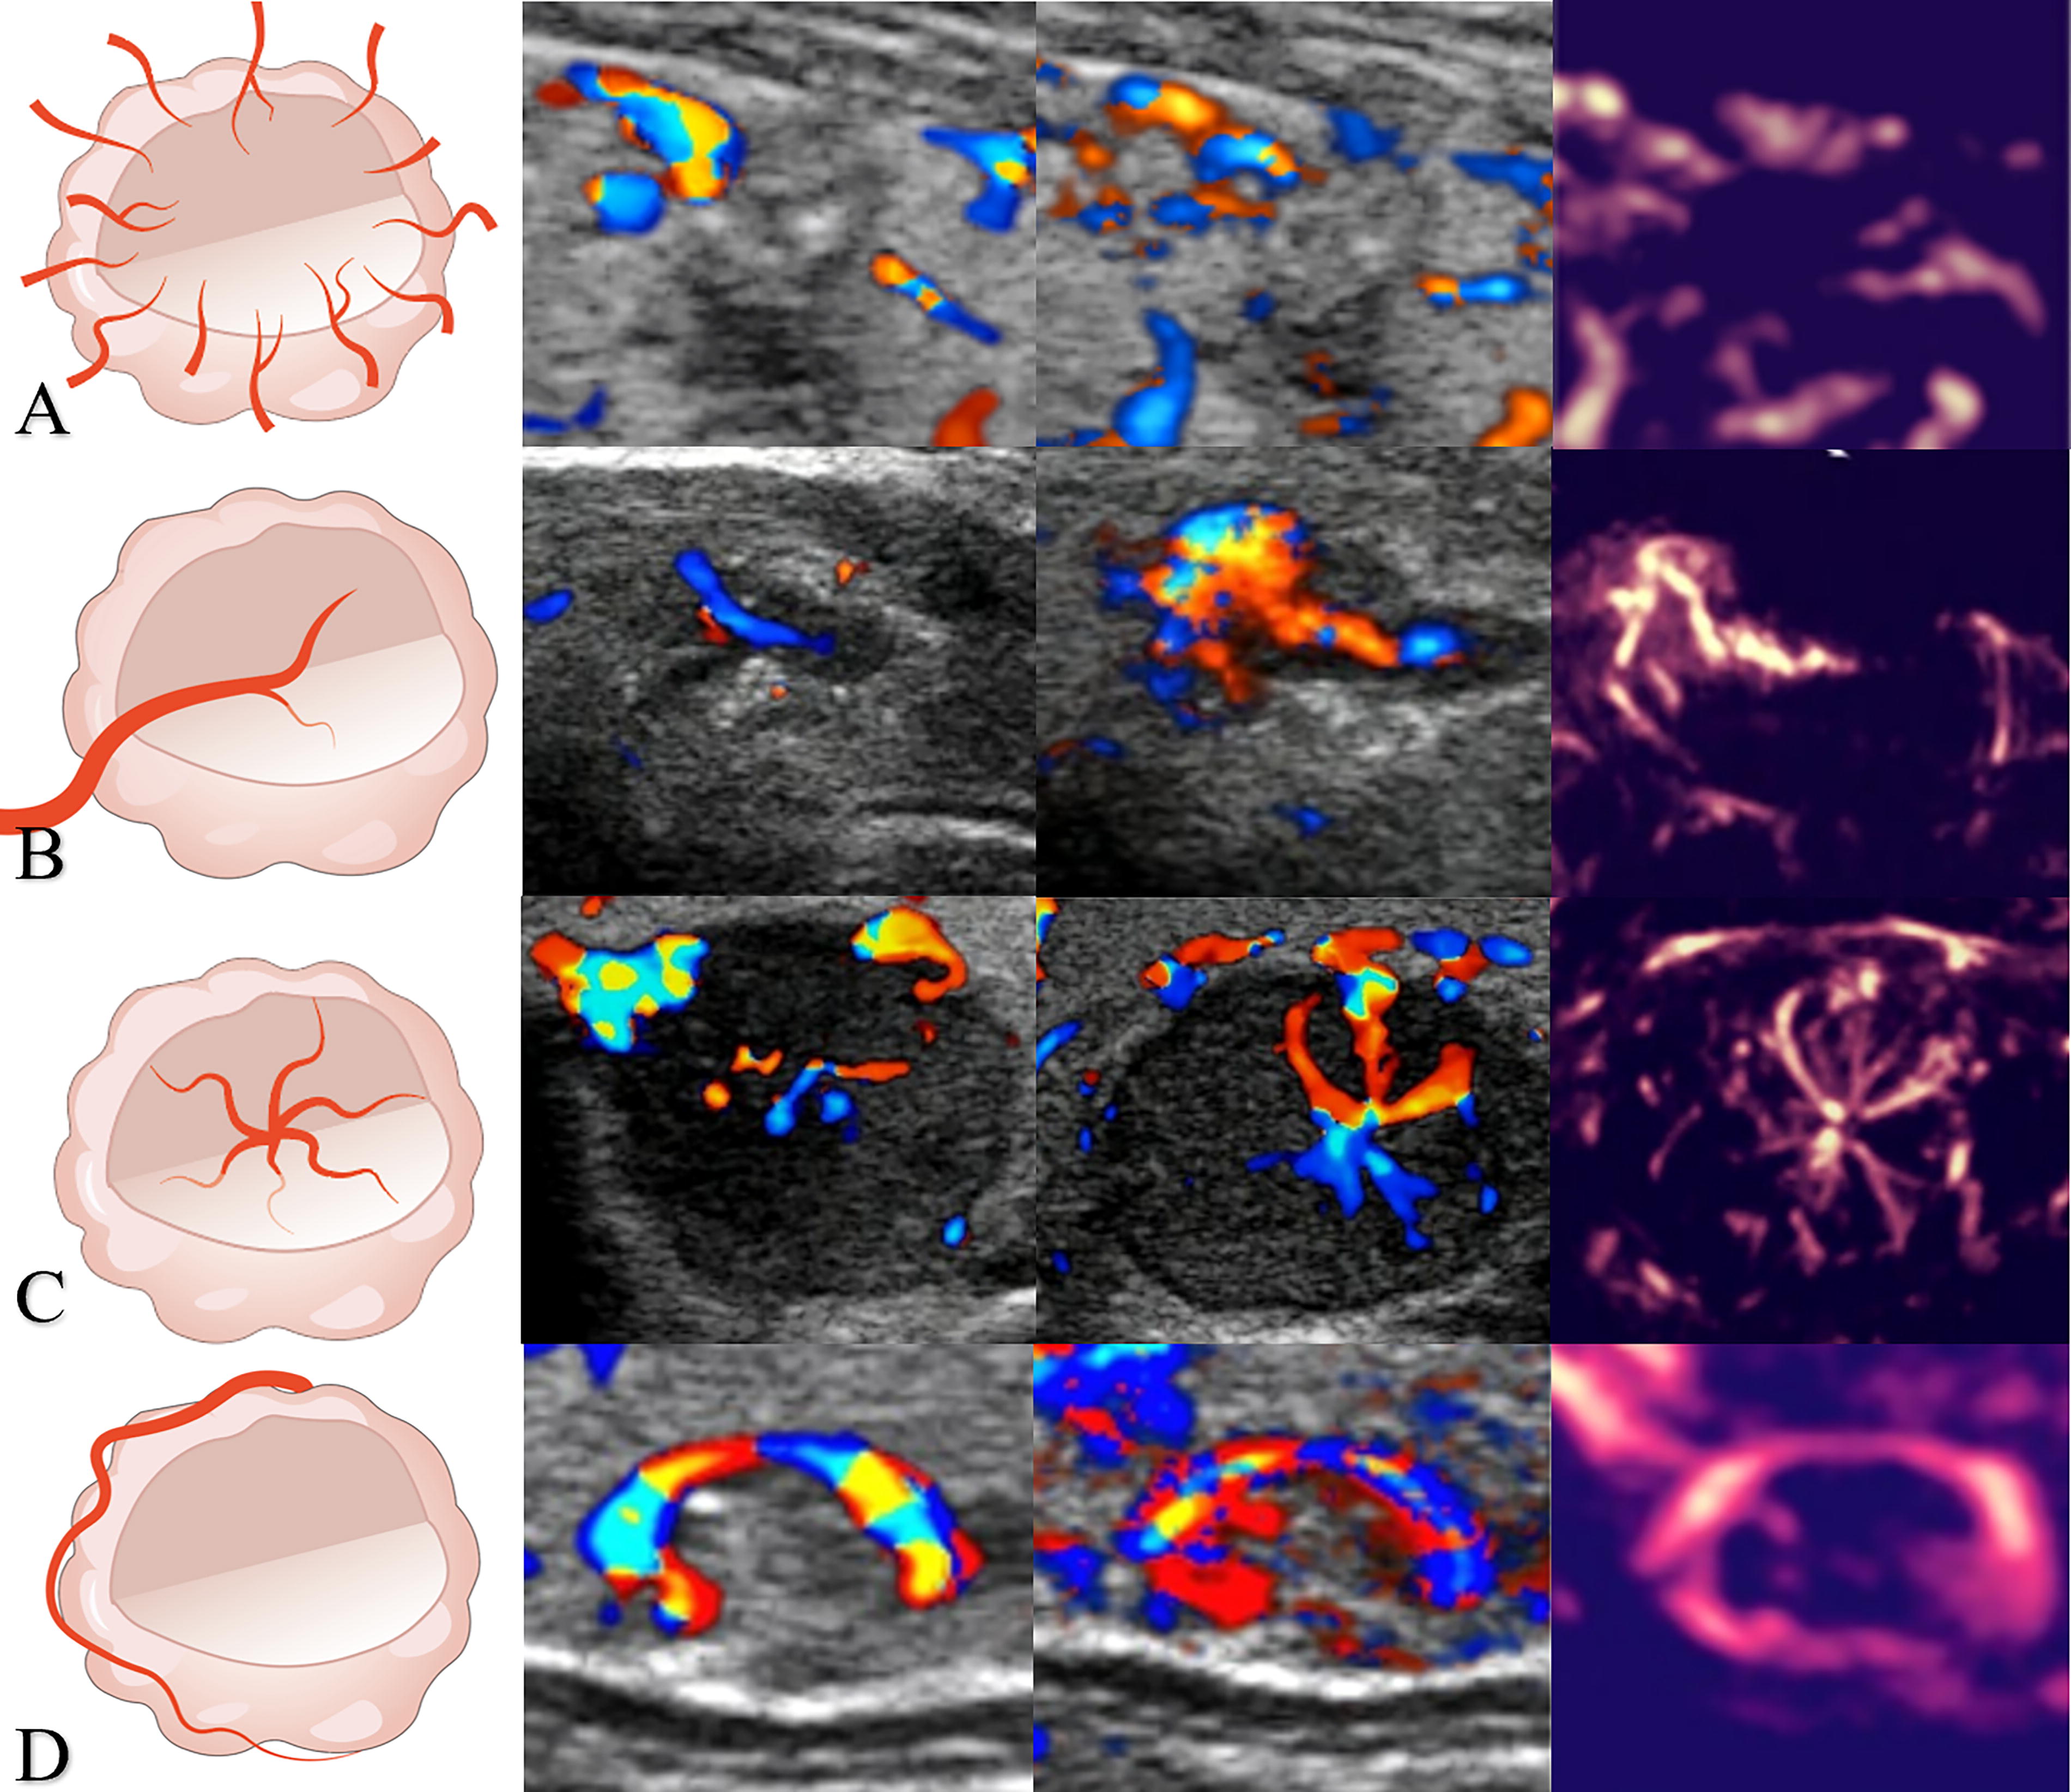
Microvascular morphological signs of thyroid nodules in diagrams. In order of each line is vascular diagram, CDFI, PDI, AP (Silhouette map). Line
Interobserver agreement
Two certified radiologists (X.W. and J.M.C.), blinded to the pathological outcomes, independently evaluated the imaging characteristics at GUS and AP. The intra-class correlation (ICC), along with the proportion agreement test, was applied to assess the inter-observer agreement for each sonographic feature and TI-RADS category for thyroid nodules.
Statistical analysis
Based on a 23% carcinoma prevalence from the KSThR2016 study, 20 and the C indexes from existing prediction models, we planned to include approximately 720 nodules, as Riley et al. 21 indicated.
The patient demographics were analyzed using descriptive statistics. Quantitative data are presented as mean ± standard deviation (SD) and were analyzed using the unpaired t-test. Categorical data were compared using the chi-square test. The thyroid nodules were divided into a training set (70%) and a validation set (30%). Variables associated with thyroid cancer in univariate logistic regression (p < 0.05) were included as candidates for multivariable analyses. The forward stepwise logistic regression models were then applied, allowing variables to enter the model if p < 0.1. Model selection was further optimized by minimizing the Akaike Information Criterion (AIC). The DeLong test was used to determine the area under the receiver operating characteristic (ROC) curve (AUC) for different models. The bootstrapping method, with 1000 samples, was used to calculate the metrics for each evaluation indicator with a 95% confidence interval (CI) for the validation set. The diagnostic performance of models in detecting thyroid cancer was evaluated. The calibration of each model was depicted through calibration curves and Brier scores, while the model fit was assessed and compared using the Hosmer–Lemeshow test and AIC.
Following the statistical design methods of Xiao et al., 9 we similarly plotted decision analysis curves (DCA), net reduction in false-positive rate curves, and proportion of avoided biopsy curves. These visuals help compare the potential net benefits, showcasing the likelihood of detecting thyroid cancer with additional biopsies against the proportion of avoided FNA procedures among models in validation across a range of risk threshold probabilities. 22 A nomogram was developed to estimate the probability of detecting thyroid cancer using FNA.
Statistical analyses utilized two-sided tests, with the level of statistical significance set at p < 0.05. Analyses were conducted using SPSS version 25.0 and R software version 4.3.1.
Results
Participant characteristics
Of 1058 patients with previously detected thyroid nodules in US, 311 were ineligible to participate in our study. Among the remaining 747 participants, 92 declined surgery, and 56 were excluded due to poor image quality, insufficient parameters, coarse calcifications obscured by shadowing, or absence of definitive pathological diagnosis (Fig. 2). Ultimately, data from 793 nodules in 599 participants were collected. The training set consisted of 410 participants (mean ± SD age, 44 ± 12 years) with 555 nodules, while the validation set included 189 participants (mean ± SD age, 43 ± 11 years) with 238 nodules.

Flow diagram of the included patients and number of thyroid nodules. US, ultrasound, Angio PLUS, Angio planewave ultrasensitive imaging.
The baseline characteristics of participants are detailed in Table 1. Participants with benign nodules (mean ± SD age, 49 ± 11 years) were older than those with malignant nodules (mean ± SD age, 42 ± 12 years) (p < 0.001). Benign nodules (mean ± SD size, 16.97 ± 12.24 mm) were larger than malignant nodules (mean ± SD size, 9.51 ± 7.08 mm; p < 0.001). Among the nodules, 102 of 248 benign nodules (41.12%) and 373 of 545 malignant nodules (68.44%) were smaller than 1 cm. There was no statistically significant difference in sex between participants with benign and malignant nodules. The indications for surgery in patients are listed in Supplementary Table S1.
Baseline Data of Training Set and Validation Set
Unless otherwise specified, data are numbers of nodules, with percentages in parentheses. p < 0.05 indicates a significant difference.
Of 793 thyroid nodules in 599 patients, 443 patients had only one thyroid nodule, 118 patients had two thyroid nodules, and 38 patients had three thyroid nodules.
aData are numbers of patients, with percentages in parentheses.
bData are mean ± SDs.
ACR TI-RADS, American College of Radiology Thyroid Imaging Reporting and Data System; FNA, fine-needle aspiration.
Univariate analysis
Malignant nodules exhibited a higher prevalence of several features compared to benign nodules: solid components (99.63% [543 of 545] vs. 54.44% [135 of 248]), punctate echogenic foci (35.23% [192 of 545] vs. 4.84% [12 of 248]), hypoechoic echogenicity (97.61% [532 of 545] vs. 80.24% [199 of 248]), taller-than-wide shape (59.37% [323 of 545] vs. 8.47% [21 of 248]), irregular margins (52.29% [285 of 545] vs. 7.66% [19 of 248]), and malignant vascular signs (59.63% [325 of 545] vs. 5.65% [14 of 248]). In contrast, benign vascular signs were more common in benign nodules (6.06% [187 of 545] vs. 60.48% [150 of 248]; all p < 0.001). Young’s modulus and malignant vascular signs were identified as variables respectively associated with malignancy in univariate analyses. Table 2 details the univariate analysis results. Among the 339 nodules with malignant vascular signs, 325 (95.87%) were malignant. Of the 183 nodules with benign vascular signs, 150 (81.96%) were benign. Malignant nodules displayed malignant vascular signs in 59.63% of cases (325 of 545; OR: 10.43, 95% CI: 5.76–18.88, p < 0.001), including the convergence sign in 272 (83.69%; OR: 40.78, 95% CI: 17.83–93.26, p < 0.001), the piercing sign in 41 (12.61%; OR: 2.03, 95% CI: 1.06–3.88, p < 0.001), and the spoke wheel sign in 13 (4.00%; p = 0.998). Conversely, 60.48% (150 of 248) of benign nodules exhibited benign vascular signs, all of which were ring signs (OR: 0.04, 95% CI: 0.02–0.06, p < 0.001). Notably, 33.87% (84 of 248) of benign nodules and 34.31% (187 of 545) of malignant nodules lacked significant vascular signs and were classified under other vascular patterns. The Young’s modulus values for malignant nodules, including Emax, Emean, Emin, Esd, and ER, were higher than those for benign nodules (all p < 0.001).
The Results of Univariate Analyses Examining Associations with the Presence of Thyroid Carcinoma
Unless otherwise specified, data are numbers, with percentages of participants in parentheses and 95% CIs in brackets. p < 0.05 indicates a significant difference.
aData are numbers of patients, with percentages in parentheses.
bData are mean ± SDs.
OR, odds ratio. PBMC, patterned-based microvascular classification; US, ultrasound; SWE, shear wave elastography.
Multivariable analyses and model construction
Four predictive models were developed using multivariable logistic regression, incorporating variables selected based on statistical significance (p < 0.05) in univariate logistic regression analyses in the training set. Model A incorporated features from the GUS, including solid components, hypoechoic echogenicity, taller-than-wide shape, irregular US margins, and punctate echogenic foci. Model B added Young’s modulus (Emax, Emean, Emin, Esd, and ER) to Model A. Model C combined Model A with PBMC, and Model D integrated both Model B and PBMC. The multivariable analyses of multimodality US features from the training set are shown in Table 3.
Multivariable Analyses Examining the Association of Multimodality Ultrasound Features and the Presence of Thyroid Carcinoma in the Training Set
Data in parentheses are 95% CIs. p < 0.05 indicates a statistically significant difference. Model A included GUS features, Model B integrated Model A with Young’s modules, Model C integrated Model A with PBMC, and Model D combined Model B with PBMC.
AIC, akaike information criterion; CI, confidence interval; NA, not applicable; OR, odds ratio; PBMC, patterned-based microvascular classification; SWE, shear wave elastography.
Discrimination and calibration of each model
The ROC curves with the AUCs of each model are displayed in Figure 3. In the training set, Model D achieved the highest AUC of 0.95 (95% CI: 0.92, 0.97), significantly surpassing the AUCs of the single and dual modality models. The lowest AUC was 0.62 (95% CI: 0.57, 0.66) for TI-RADS management (p < 0.001). The sensitivity, specificity, accuracy, positive predictive value (PPV), and negative predictive value (NPV) for each model in the training and validation sets are detailed in Supplementary Table S2.
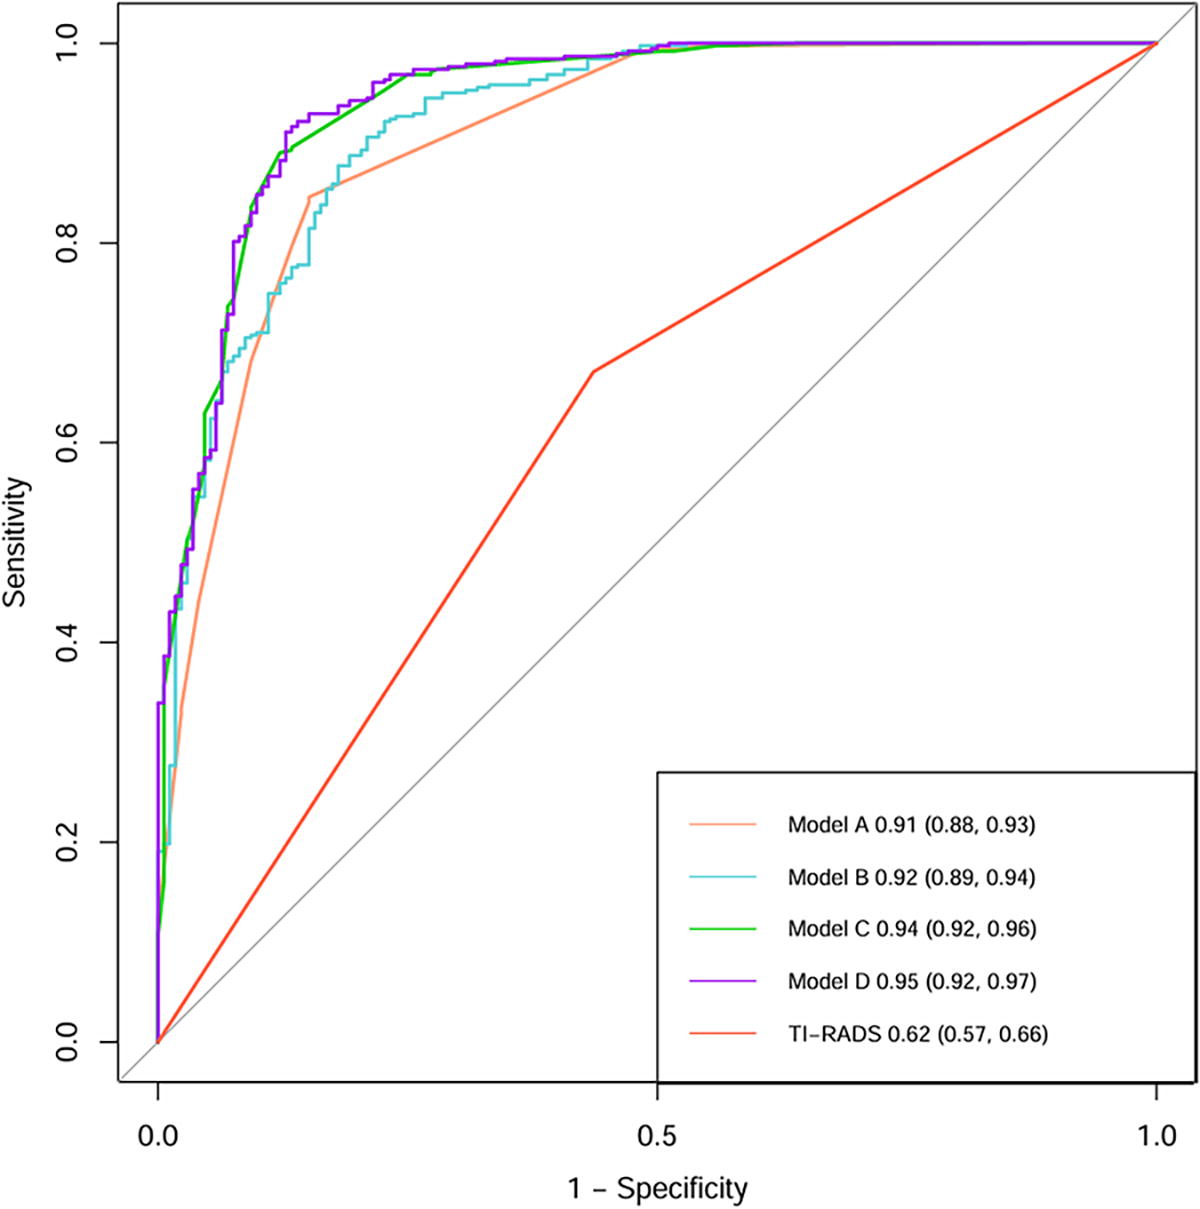
Receiver operating characteristic curves show models for accuracy in recommending fine-needle aspiration biopsy of thyroid nodules according to the presence of malignancy. Model A included GUS features, Model B integrated Model A with Young’s modules, Model C integrated Model A with PBMC, and Model D combined Model B with PBMC. Multimodality US model (model D) performed best. Data in parentheses are 95% CI. GUS, gray ultrasound; PBMC, pattern-based microvascular classification; TI-RADS, Thyroid Imaging Reporting and Data System; CI, confidence interval.
The ROC curves with AUCs of the validation cohort were consistent with those of the training (Supplementary Fig. S1). In addition, the calibration curves from the validation set showed good agreement across the models (Supplementary Fig. S2), with Brier scores indicating better calibration for the four predictive models compared to TI-RADS (Model A: 0.098, Model B: 0.095, Model C: 0.077, Model D: 0.074; TI-RADS: 0.203). The Hosmer–Lemeshow test yielded p-values of 0.01, 0.83, 0.06, and 0.89 for models A, B, C, and D, respectively, demonstrating excellent model fit, except for Model A. A nomogram for Model D was generated (Supplementary Fig. S3), with a free-access online calculator developed for easy calculation (https://musfna.shinyapps.io/dynnomapp/).
Comparison of models
Table 4 demonstrates that all four models significantly outperformed TI-RADS in recommending FNA procedures for thyroid nodules (all p < 0.001). Model A achieved an AUC of 0.91 (95% CI: 0.88, 0.93), Model B an AUC of 0.92 (95% CI: 0.89, 0.94), Model C an AUC of 0.94 (95% CI: 0.92, 0.96), and Model D an AUC of 0.95 (95% CI: 0.92, 0.97). The performance of Model D was better for nodules greater than or equal to 1 cm compared to those smaller than 1 cm, with AUCs of 0.98 (95% CI: 0.96, 0.99) and 0.91 (95% CI: 0.87, 0.94), respectively (Supplementary Table S2).
Comparison of Areas Under the Receiver Operating Characteristic Curve Among Models for Accuracy in Recommending FNA Biopsy of Thyroid Nodules According to the Presence of Malignancy
p < 0.05 indicates a statistically significant difference. Model A included GUS features, Model B integrated Model A with Young’s modules, Model C integrated Model A with PBMC, and Model D combined Model B with PBMC.
ACR, American College of Radiology; FNA, fine-needle aspiration; GUS, grayscale ultrasound; NA, not applicable; PBMC, pattern-based microvascular classification; TI-RADS, Thyroid Imaging Reporting and Data System.
Decision curve analysis
DCA (Fig. 4) demonstrated that Model D provided higher net benefit than TI-RADS across clinically relevant threshold probabilities (0–100%), with the largest difference observed at a 71% threshold (77% [95% Cl: 68, 90] for Model D vs. 20% [95% Cl: 0, 22] for TI-RADS). At a 71% risk threshold, Model D avoided 27% (95% CI: 21, 34) of FNA procedures, compared to 13% (95% CI: 0, 38) with TI-RADS. Moreover, Model D significantly reduced unnecessary FNA, performing 88 per 100 participants without negative findings, versus 53 for TI-RADS at a 50% risk threshold. Overall, Model D achieved greater reductions in false positives and unnecessary biopsies, as shown in Supplementary Figures S4-S5 and Supplementary Table S3.

Graph showing the estimated net benefit of each model in recommending fine-needle aspiration for thyroid nodules. All four built models had higher net benefits than the management with the American College of Radiology (ACR) Thyroid Imaging Reporting and Data System (TI-RADS). All indicates FNA to all thyroid nodule models; Model A included GUS features, Model B integrated Model A with Young’s modules, Model C integrated Model A with PBMC, and Model D combined Model B with PBMC, none indicates no FNA to all thyroid nodules model. GUS, gray ultrasound; PBMC, pattern-based microvascular classification; TI-RADS, Thyroid Imaging Reporting and Data System.
Interobserver agreement
All ICCs were greater than 0.40 (all p < 0.001). The level of agreement among models was moderate for punctate echogenicity (ICC: 0.57 [95% Cl: 0.40, 0.71]) of nodules and for the convergence sign was high (ICC: 0.81 [95% Cl: 0.69, 0.87]) (Supplementary Table S4).
Discussion
Current guidelines based on GUS, such as ACR TI-RADS, exhibit limited accuracy in guiding FNA decisions for thyroid nodules. 3 Although multimodality US combining CEUS and strain elastography shows potential to improve specificity, its clinical application may be constrained by the high cost and reliance on contrast agents for CEUS. 9 However, as a non-invasive alternative, MVFI lacks specific microvascular classification for thyroid nodule vascularity. 23,24 Besides, previous studies have indicated that malignant nodules typically exhibit a higher Young’s modulus in SWE. 5,25 Hence, we developed a novel PBMC and subsequently constructed a multimodality US model that incorporated features of GUS, the PBMC, and Young’s modulus of SWE. In our study, the AUC of the multimodality US model was 0.95 (95% CI: 0.92, 0.97) compared to 0.62 (95% CI: 0.57, 0.66) for TI-RADS (p < 0.001). Moreover, when applying a 71% risk threshold, the model could prevent 27% (95% CI: 21, 34) of FNA procedures while still recommending FNA for 89% (95% CI: 83, 93) of malignant thyroid nodules. In contrast, TI-RADS would only avoid 13% (95% CI: 0, 38) of procedures, recommending 67% (95% CI: 0, 100) of malignant nodules to FNA (p < 0.001). The observed net benefit advantage of Model D at clinically relevant thresholds (e.g.,71%) suggests potential utility in reducing unnecessary invasive procedures, though external validation is required. Notably, PBMC was first established and validated for its correlation with benign and malignant nodules.
Participants with malignant thyroid nodules were younger than those with benign nodules (mean age 42 vs. 49 years; p < 0.001). Benign nodules typically require long-term follow-up before surgical intervention is considered, whereas suspected malignant nodules are more likely to undergo early biopsy or surgery. This might explain why benign nodules were larger than malignant ones (mean size 16.97 mm vs. 9.51 mm; p < 0.001). Although there were more female participants than males (436 vs. 163, p < 0.001), gender was not a significant factor in the presence of malignant nodules (p > 0.691).
Our study introduces a novel microvascular classification method based on vascular travel patterns, categorizing them as malignant vascular signs (including convergence sign, piercing sign, and spoke wheel sign), benign vascular signs (ring sign), and other vascular patterns. Univariate regression analyses demonstrated that the convergence sign and penetrating sign were associated with malignant nodules, while the ring sign was associated with benign nodules (all p < 0.001). Among them, the convergence sign resembles crab claw-like blood flow patterns identified by Li et al. 23 and penetrating vascularity reported by Zhao et al, 18 while the piercing sign has been validated in Jiang et al.’s study on penetrating branching vascularity. 26 Although the ring sign has not been previously reported, Ruan et al. found that benign nodules generally present ring enhancement in CEUS. 8 The spoke wheel sign was not a significant predictor in our analysis (p = 0.998), but Xue et al. 27 confirmed its diagnostic utility for malignant nodules, and all the nodules with the spoke wheel sign in our study were malignant.
Overall, malignant vascular signs are independently associated with the presence of thyroid cancer, with an OR of 4.41 (95% CI: 1.92, 10.14), which is higher than all GUS features except solid composition in the multivariable logistic regression of model D. This suggests a clinical value comparable to well-recognized grayscale malignant features. Conversely, the OR for benign vascular signs is 0.16 (95% CI: 0.08, 0.34), suggesting that the ring sign may be interpreted as excluding the presence of thyroid cancer. The discovery of vascular signs is largely attributed to the clinical application of MVFI. Based on AP, we observed that peripheral blood flow in many malignant nodules appeared discontinuous, vertically distributed, and converged outside the nodules, hence the term “convergence sign.” However, in CDFI, the convergence sign often presents an unclear wraparound vascular pattern at the nodule margin due to aliasing and signal noise. 28 Therefore, PBMC under MVFI provides greater diagnostic value. However, the PBMC used a pattern-based approach, not a point-based method, making some vascular patterns challenging to classify. Hence, approximately one-third of the nodules fall into the “other vascular patterns” category, which leads us to develop multimodality models incorporating MVFI, SWE, and GUS to enhance practical applications.
SWE measures the stiffness of thyroid nodules, influenced by their composition and cellularity. Consistent with other researchers, 15,17 our study found that combining quantitative elastic parameters with GUS features (Model B) results in better diagnostic performance compared to using single-modal US (Model A), as indicated by the AUC values (0.92 [95% CI: 0.89, 0.94] vs. 0.91 [95% CI: 0.88, 0.93], p < 0.05). Nevertheless, Yi et al. reported that qualitative color pattern SWE had superior diagnostic performance compared to quantitative SWE parameters, particularly in ACR TI-RADS Category 4–5 nodules ≤10 mm. 28 Further research is required to resolve these discrepancies.
The increasing incidence of thyroid cancer is primarily attributed to the increased detection of papillary thyroid microcarcinomas. 29 Notably, 68.44% (373 of 545) of malignant nodules in our study were smaller than 1 cm. In addition, the performance of this multimodality model for nodules <1 cm was lower than that for overall nodules (AUC: 0.91 (95% Cl: 0.87, 0.94) vs. 0.95 (95% Cl: 0.92, 0.97), p < 0.05), primarily due to a lower PPV of 0.67 (95% CI: 0.59, 0.75), while the NPV remained high at 0.95 (95% CI: 0.92, 0.97). Thus, we do not recommend FNA when Model D’s predicted value for nodules <1 cm is below the cutoff (0.757), even though Xiao et al. 9 suggested that a definitive FNA diagnosis is necessary for thyroid nodules suspected of cancer, regardless of size. Practically, this is challenging due to the limitations imposed by the size and location of nodules on FNA procedures. Therefore, for nodules <1 cm with Model D predicted values reaching the cutoff, the recommendation for FNA should be considered in conjunction with the presence of high-risk factors. Meanwhile, nodules ≥1 cm with a predicted risk of reaching the cutoff value at 0.541 are also recommended for FNA. Further research on the multimodality US model for predicting higher-risk thyroid cancer is necessary.
Our study faced several limitations. First, this was a single-center study and lacked external validation. Second, we included only nodules with surgical pathology, and the lack of preoperative pathological confirmation resulted in a relatively high proportion of malignant nodules, which impacted the models’ positive and negative predictive values and minimized differences among them. Third, selection bias among patients was present in our study, as we excluded nodules with anterior coarse calcifications, patients who had FNA without subsequent surgery, and those with only follow-up data. This inevitably led to the omission of some benign nodules. Fourthly, the majority (68.44%) of the thyroid cancers included in this study were microcarcinomas, for which biopsy is questionable. Furthermore, we did not examine whether our model was associated with the presence of higher-risk cancers.
Conclusion
This innovative PBMC, akin to GUS malignant features, demonstrates significant diagnostic efficacy and clinical utility. Unlike ACR TI-RADS, our non-invasive multimodality US model combines acoustic characteristics, morphological structure, composition, textures, and microvascular patterns. Our proposed technique may potentially reduce the risk of unnecessary biopsy of benign thyroid nodules, but this requires prospective evaluation.
Footnotes
Acknowledgments
The authors wish to thank Feile Ye, MS, for her efforts in drawing vascular diagrams. The authors also thank Dr. Zhuozhong Wang and Kangqiang Weng, MD, for their assistance in statistical analysis.
Authors’ Contributions
X.W. and J.M.C.: Guarantors of the integrity of the entire study. J.M.C., J.Z., Y.Z., B.X.D., and J.Y.H.: Literature research. Y.H.L., J.M.C., and X.W.: Imaging and clinical data collection. J.M.C.: Data analysis. J.M.C. and X.W.: Article writing and editing. Y.H.L. and Z.Z.S.: Visualization and validation. J.M.C. and X.W.: Study concepts/study design or data acquisition or data analysis/interpretation. X.W. and Z.Z.S.: Conceptualization. All authors approved the final version of the submitted article and agreed to ensure that any questions related to this work are appropriately resolved.
Author Disclosure Statement
No competing financial interests exist.
Funding Information
China National Science Foundation (82202168); Fundamental Research Funds for the Central Universities, Sun Yat-sen University (89000-31610006).
Supplementary Material
Supplementary Appendix
Supplementary Figure S1
Supplementary Figure S2
Supplementary Figure S3
Supplementary Figure S4
Supplementary Figure S5
Supplementary Table S1
Supplementary Table S2
Supplementary Table S3
Supplementary Table S4