
Abstract
Background:
The prevalence of thyroid nodules is increasing globally. This study explored the association between residential greenness and thyroid nodule prevalence.
Methods:
Data were collected from a national cross-sectional survey of 73,728 participants across 31 provinces in mainland China. Residential greenness was assessed with the normalized difference vegetation index (NDVI) and the enhanced vegetation index (EVI). Thyroid nodules >10 mm in diameter were diagnosed via ultrasound. We used quartile comparisons of the NDVI and EVI to compare nodule prevalence and employed logistic regression and restricted cubic spline analyses to examine nodules’ associations with greenness. Interaction and sensitivity analyses were performed to test robustness.
Results:
A total of 73,728 participants were included in this study. The prevalence of 10 mm thyroid nodules decreased across NDVI500 quartiles: Q1: 7.99% (7.59–8.39%), Q2: 10.04% (9.60–10.48%), Q3: 6.59% (6.23–6.95%), and Q4: 5.20% (4.88–5.52%) (p for trend <0.001). The prevalence was 5.25% (95% confidence interval [CI]: 5.02–5.49%) in males and 9.09% (CI: 8.80–9.39%) in females. Logistic regression analysis showed that greater residential greenness was associated with a lower prevalence of thyroid nodules after adjusting for all covariates. This association was observed for both continuous greenness measures (NDVI500: odds ratio [OR] = 0.20, CI: 0.16–0.25; EVI500: OR = 0.08, CI: 0.06–0.12) and across quartiles (NDVI500 Q4: OR = 0.53, CI: 0.48–0.58; EVI500 Q4: OR = 0.55, CI: 0.51–0.60; both compared to Q1). Multiple sensitivity analyses confirmed this negative association, including the use of an alternative thyroid nodule definition (5 mm threshold), exclusion of individuals with cysts on ultrasound, and subgroup analyses excluding individuals with autoimmune thyroid antibody positivity, goiter, or both. In all these sensitivity analyses, NDVI and EVI data were assessed using both 500 m and 1000 m buffers.
Conclusion:
Our study is the first to identify an association between higher levels of residential greenness and a lower prevalence of thyroid nodules.
Introduction
Recent studies have reported an increasing prevalence of thyroid nodules, ranging from 2% to 65% in the general population, with an average of 20%. 1 –4 Approximately 5% of thyroid nodules cause compressive symptoms, while the remainder consist of colloid nodules, cysts, thyroiditis, and benign follicular neoplasms. 5 –8 In China, the prevalence of thyroid nodules among adults is approximately 20%.2 Research identifying the environmental factors that may influence the risk of developing thyroid nodules is needed.
China’s rapid urbanization has increased building density and reduced green spaces, deteriorating urban ecological environments. 9 Factors such as population concentration, industrial development, and intensified transportation have also exacerbated environmental pollution, particularly air pollution. 10 While urbanization drives economic and social development, it has also been associated with increased prevalence rates of various diseases. 11,12
In recent years, residential greenness has been reported to be negatively associated with hypertension, 13 type 2 diabetes mellitus, 14 obesity, 15 hyperuricemia, 16 and cardiovascular health. 17,18 Furthermore, a higher degree of greenness has also been associated with a reduction in mortality rates. 19,20 Residential greenness is believed to reduce harm caused by environmental factors (e.g., high temperatures, noise, and air pollution), alleviate mental and physiological stress, and promote exercise and social interactions. 21,22 Additionally, exposure to nature may increase contact with microorganisms such as bacteria and protozoa, which play crucial roles in the immune system and help regulate inflammatory responses. 23
The aim of this study was to explore the relationship between residential greenness and the prevalence of thyroid nodules. Such information could be used to inform regional environmental policymaking.
Materials and Methods
Study population, sampling, and data entry
Our study population was comprised of participants in the Thyroid Disorders, Iodine Status, and Diabetes Epidemiological Survey (TIDE), which was conducted across 31 provinces in mainland China from 2015 to 2017. The research protocols were approved by the Medical Ethics Committee of China Medical University (2013-115). Written informed consent was obtained from all participants following a comprehensive explanation of the research procedures.
The inclusion criteria for the TIDE project were as follows: aged ≥18 years, residing locally in the included regions for at least five years, not using iodine-containing medications or contrast agents in the three months prior to participation, and not being pregnant. A multistage stratified sampling method was used to select a nationally representative sample, with a detailed sampling strategy described in previously published papers. 24 The survey’s implementation featured centralized training for provincial investigation teams and adherence to a standardized protocol in each province to ensure consistency across the study. Data entry was subjected to a double-check process. Initially, 80,937 participants were included in the survey.
Thyroid ultrasonography
Ultrasonography was performed on all 73,728 participants with a portable device (LOGIQ 100 PRO, GE, Milwaukee, WI, USA) equipped with 7.5 MHz linear transducers. Thyroid ultrasonography was conducted by qualified observers who had undergone training and passed examinations at the project center. Prior to the survey, sonographers underwent standardized training, with trainers serving as the reference. Only those with a kappa value greater than 0.8 and an agreement rate greater than 90% performed the measurements. After the survey, we randomly selected 100 respondents for consistency analysis, resulting in a kappa value of 0.8186 and an agreement rate of 95%. 2 Thyroid nodules were defined as those with a diameter greater than 10 mm. 25 The thyroid volume was calculated using the equation recommended by the WHO: V = V left lobe (0.479 × length × width × thickness) + V right lobe (0.479 × length × width × thickness). A thyroid volume exceeding 22.50 mL in females and 25.40 mL in males was considered indicative of a goiter. 26 Ultrasound further identifies thyroid cysts as lesions with an anechoic internal structure.
Assessment of residential greenness and PM2.5
To assess the level of greenery in residential areas, we employed the normalized difference vegetation index (NDVI) and the enhanced vegetation index (EVI). Both indices are widely used in global vegetation monitoring and research. 27,28 The NDVI is calculated by analyzing the surface reflectance of near-infrared and visible red light, allowing it to sensitively capture changes in vegetation cover, land use types, and seasonal biophysical conditions. 27,29,30 The EVI, an improved version of the NDVI, incorporates atmospheric correction and surface feature considerations, providing higher accuracy in complex environments. 30 NDVI and EVI data were obtained from the Moderate Resolution Imaging Spectroradiometer (MODIS) on the Terra satellite, corresponding to the year of thyroid ultrasonography for TIDE project participants. The data cover a 500-m buffer zone around participants’ residences (NDVI500 and EVI500) (https://modis.gsfc.nasa.gov/data/dataprod/mod13.php), and the data within a 1000-m buffer around participants’ residences (NDVI1000 and EVI1000) were further employed as part of the sensitivity analysis.
PM2.5 refers to fine particulate matter in the air with a diameter of 2.5 µm or smaller. PM2.5 data were derived from a combination of aerosol optical depth data from multiple satellites (Moderate-Resolution Imaging Spectroradiometer [MODIS], Visible Infrared Imaging Radiometer Suite [VIIRS], Multi-angle Imaging SpectroRadiometer [MISR], and Sea-Viewing Wide Field-of-View Sensor [SeaWiFS]) and their respective retrieval methods (Dark Target, Deep Blue, Multi-Angle Implementation of Atmospheric Correction [MAIAC]), along with simulation data (Goddard Earth Observing System Chemistry model [GEOS-Chem]). More details and data sources can be found at https://sites.wustl.edu/acag/datasets/surface-pm2-5/#V5.GL.02.
PM2.5 data were obtained via satellite remote sensing, corresponding to the year of thyroid ultrasonography for TIDE project participants. The PM2.5 concentrations were classified into low (1.60–37.90 µg/m3), medium (38.00–58.70 µg/m3), and high (58.80–118.90 µg/m3) categories on the basis of tertiles.
Demographic and behavioral assessment
All demographic and behavioral data were collected by trained interviewers. These factors included age, sex (male, female), ethnicity (Han, other), residential location (urban, rural), annual household income (≤30,000 yuan, >30,000 yuan), educational level (less than high school, high school and above), smoking status (nonsmokers: individuals who smoked fewer than 100 cigarettes in their lifetime; smokers: individuals who smoked at least 100 cigarettes in their lifetime), history of thyroid cancer, and family history of thyroid diseases.
Anthropometric, clinical, and biochemical assessments
Trained health professionals measured body weight and height according to standardized protocols. Body mass index (BMI) was calculated by dividing body weight (kilograms) by the square of height (meters) and categorized as <25 kg/m2, 25 kg/m2 to <30 kg/m2, and ≥30 kg/m2.
The collected serum and urine samples were stored at −20°C and transported via a cold chain system to the central laboratory for further processing after the investigation and specimen collection were completed. As previously reported, 2,31 serum thyroid-stimulating hormone (TSH), thyroid peroxidase antibodies (TPOAb), and thyroglobulin antibodies (TgAb) were measured using an electrochemiluminescence immunoassay on a Cobas 601 analyzer (Roche Diagnostics, Switzerland). For participants whose TSH levels were less than 0.27 mIU/L, TSH receptor antibodies (TRAb) levels were checked. The reference ranges for TSH, TPOAb, and TgAb were 0.27–4.2 mIU/L, <34.0 IU/mL, and <115.0 IU/mL, respectively, as per by the test kit manufacturers. Autoimmune thyroid antibody positivity (AIT) was defined as either TPOAb or TgAb being higher than the upper limit of the reference range. The urinary iodine concentration (UIC) was determined using inductively coupled plasma–mass spectrometry (ICP-MS) (Agilent 7700x, Agilent Technologies, USA). UICs are categorized as deficient (<100 µg/L), sufficient (100–300 µg/L), or excessive (≥300 µg/L). 24 Fasting blood glucose levels and two-hour blood glucose levels after the oral glucose tolerance test were measured in serum samples. HbA1c was measured by high-performance liquid chromatography (Bio-Rad VARIANT II Hemoglobin Analyzer). Diabetes was diagnosed if any of the following criteria were met: FBG ≥7.0 mmol/L, OGTT2H ≥ 11.1 mmol/L, or HbA1c ≥ 6.5%. 24
Statistical analysis
The greenness index was divided into quartiles to examine the distribution of baseline characteristics and the prevalence of thyroid nodules across different greenness index quartile groups. Continuous variables are reported as medians (interquartile ranges [IQRs]), and categorical variables are presented as percentages (numbers). Differences among groups for continuous variables were assessed using the Wilcoxon rank sum test, whereas differences for categorical variables were assessed with the Wilcoxon rank sum test and reanalyzed with Pearson’s chi-square test. The p value for trends was calculated using a linear regression model without any adjustments.
A logistic regression model was used to explore the relationship between residential greenness and the prevalence of thyroid nodules. In Model 1, no adjustments for confounders were made. In Model 2, adjustments were made for age, sex, BMI, and ethnicity; in Model 3, further adjustments were made for residential location, educational level, annual household income, smoking status, UIC, PM2.5 concentration, family history of thyroid disease, history of thyroid cancer, TSH, AIT, and diabetes. Restricted cubic splines (RCSs) with five knots were used to detect the nonlinear relationship between the NDVI and the prevalence of thyroid nodules, adjusting for all aforementioned covariates. Multiplicative interaction terms were used to analyze the interactions between greenness and corresponding covariates, and interaction effects were considered present if significant cross-product terms were included in the regression model.
We performed several sensitivity analyses to evaluate the robustness of our findings. First, these analyses incorporated the use of NDVI and EVI data within 500-m and 1000-m buffers, with the data further categorized into quartiles for detailed analysis. Second, based on prior research from TIDE, 32 we adopted a 5-mm threshold as the diagnostic criterion for thyroid nodules. Given the high prevalence of thyroid nodules under this criterion, modified Poisson regression 29 was employed in the relevant models. Third, we additionally excluded individuals with purely cystic nodules identified on ultrasound. Fourth, sensitivity analyses were conducted in subpopulations by excluding individuals with AIT, excluding those with goiter, and excluding both conditions. To ensure the robustness of the results, the subsequent four sensitivity analyses also utilized NDVI500, EVI500, NDVI1000, and EVI1000 data. Additionally, we applied the Bonferroni correction and the Benjamini–Hochberg method (false discovery rate [FDR] method) to perform multiplicity correction on the p values from the sensitivity analyses, minimizing the risk of false positives and ensuring the robustness of our findings.
All of the statistical analyses were performed in R version 4.3.3. A p value <0.05 was considered to indicate statistical significance. Except for counts, all data were reported to two decimal places. However, p values <0.001 were presented directly.
Results
Baseline characteristics
For our analysis, we excluded 167 individuals due to missing sex/age information, 1,303 individuals lacking thyroid nodule-related information, 3,914 individuals with missing home address information, and 1,825 individuals due to missing baseline information (such as income, education level, BMI, etc.), resulting in a final sample size of 73,728 individuals (Fig. 1). The median (IQR) of the NDVI500 was 0.27 (0.21, 0.40), and the median (IQR) of the EVI500 was 0.16 (0.12, 0.24). The NDVI500 and EVI500 indices were stratified into quartiles for further analysis. The quartile ranges for NDVI500 were defined as follows: quartile 1 (Q1: <21.22 × 10⁻²), quartile 2 (Q2: 21.22 × 10⁻² to <27.31 × 10⁻²), quartile 3 (Q3: 27.31 × 10⁻² to <39.61 × 10⁻²), and quartile 4 (Q4: ≥39.61 × 10⁻²). For EVI500, the quartile ranges were specified as follows: Q1 (<11.80 × 10⁻²), Q2 (11.80 × 10⁻² to <16.04 × 10⁻²), Q3 (16.04 × 10⁻² to <23.71 × 10⁻²), and Q4 (≥23.71 × 10⁻²). The detailed baseline characteristics of the population based on the quartiles of the NDVI500 are presented in Table 1. The distributions of the baseline characteristics according to the EVI500 quartiles can be found in Supplementary Table S1.
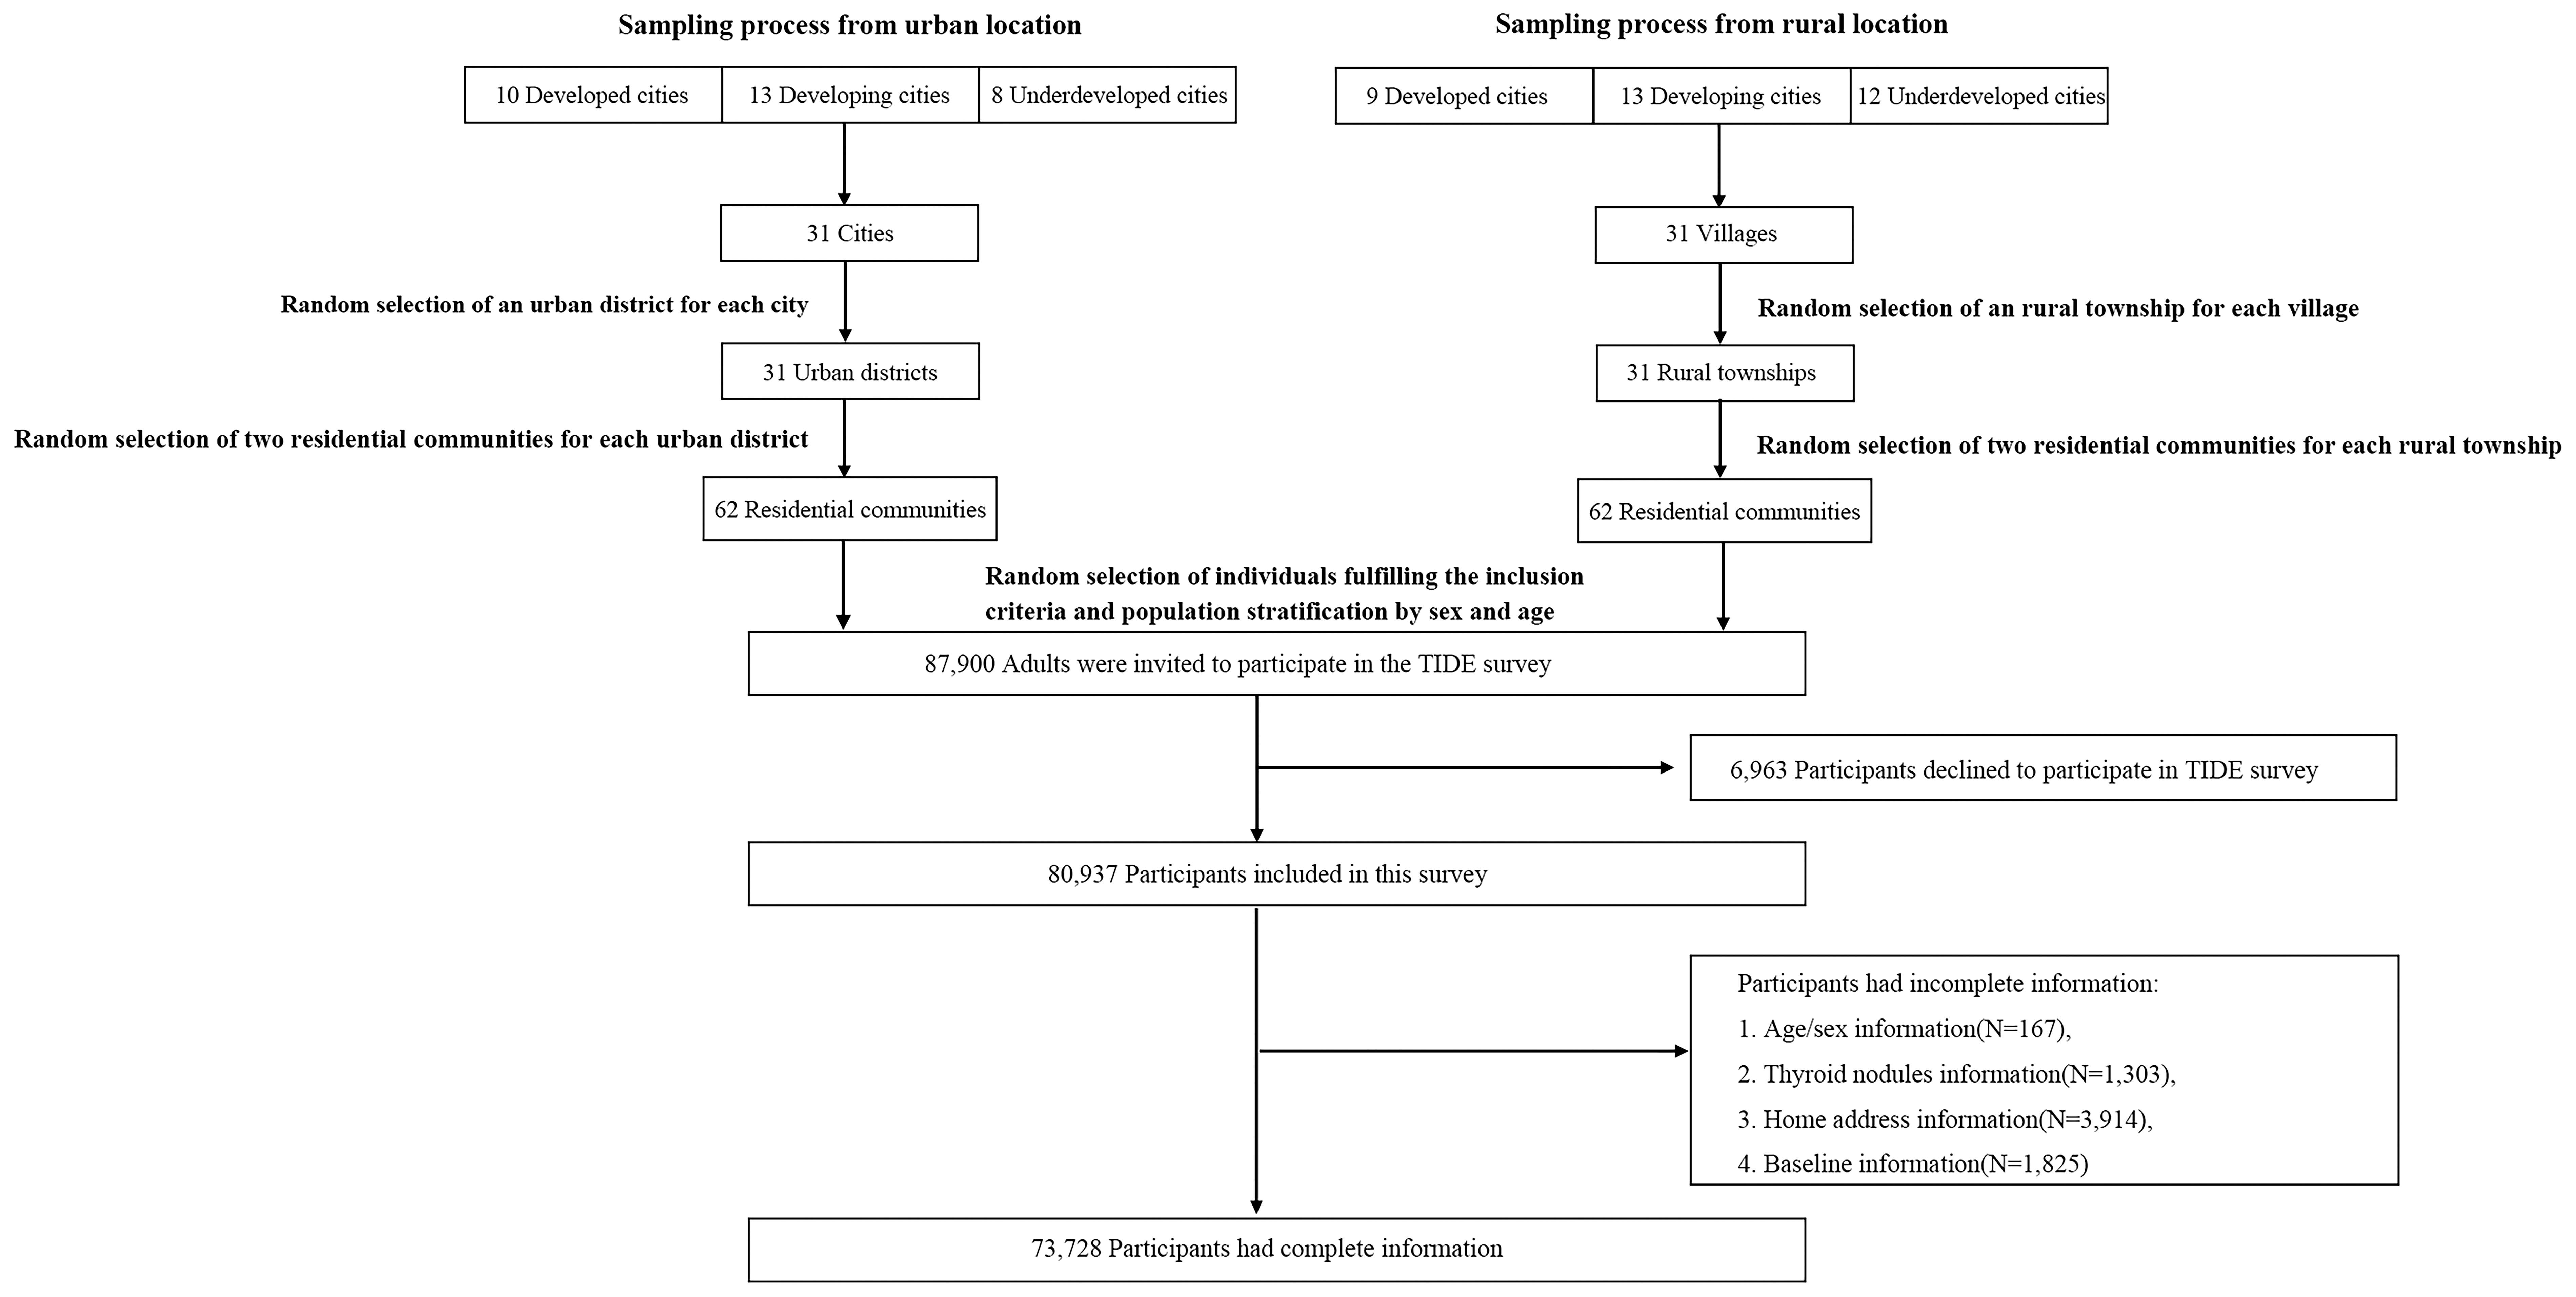
Participant Flow Chart.
Baseline Characteristics of the Participants Based on NDVI500 Quartiles
Q1 (<21.22 × 10⁻²), Q2: (21.22 × 10⁻² to <27.31 × 10⁻²), Q3 (27.31 × 10⁻² to <39.61 × 10⁻²), Q4 (≥39.61 × 10⁻²).
Median (interquartile range) for non-normally distributed continuous variables: The p value was calculated by the Wilcoxon rank sum test.
Percentage (number) for categorical variables: The p value was calculated by Pearson’s Chi-squared test.
The p for trend was calculated through unadjusted linear regression.
AIT, Autoimmune thyroid antibody positivity; BMI, body mass index; EVI, enhanced vegetation index; NDVI, normalized difference vegetation index; PM2.5, particulate matter with aerodynamic diameters ≤2.5 μm; UIC, urinary iodine concentration; Q1, the first quartile group; Q2, the second quartile group; Q3, the third quartile group; Q4, the fourth quartile group; UIC, urinary iodine concentration.
Supplementary Figure S1 illustrates the geographical coverage of the TIDE survey area and the corresponding greenness levels. The dots on the map represent the NDVI500 and EVI500 values for each region, with the greenness level increasing as the color intensifies. The overall distribution shows a trend of increasing greenness from west to east and from north to south (Fig. 2).
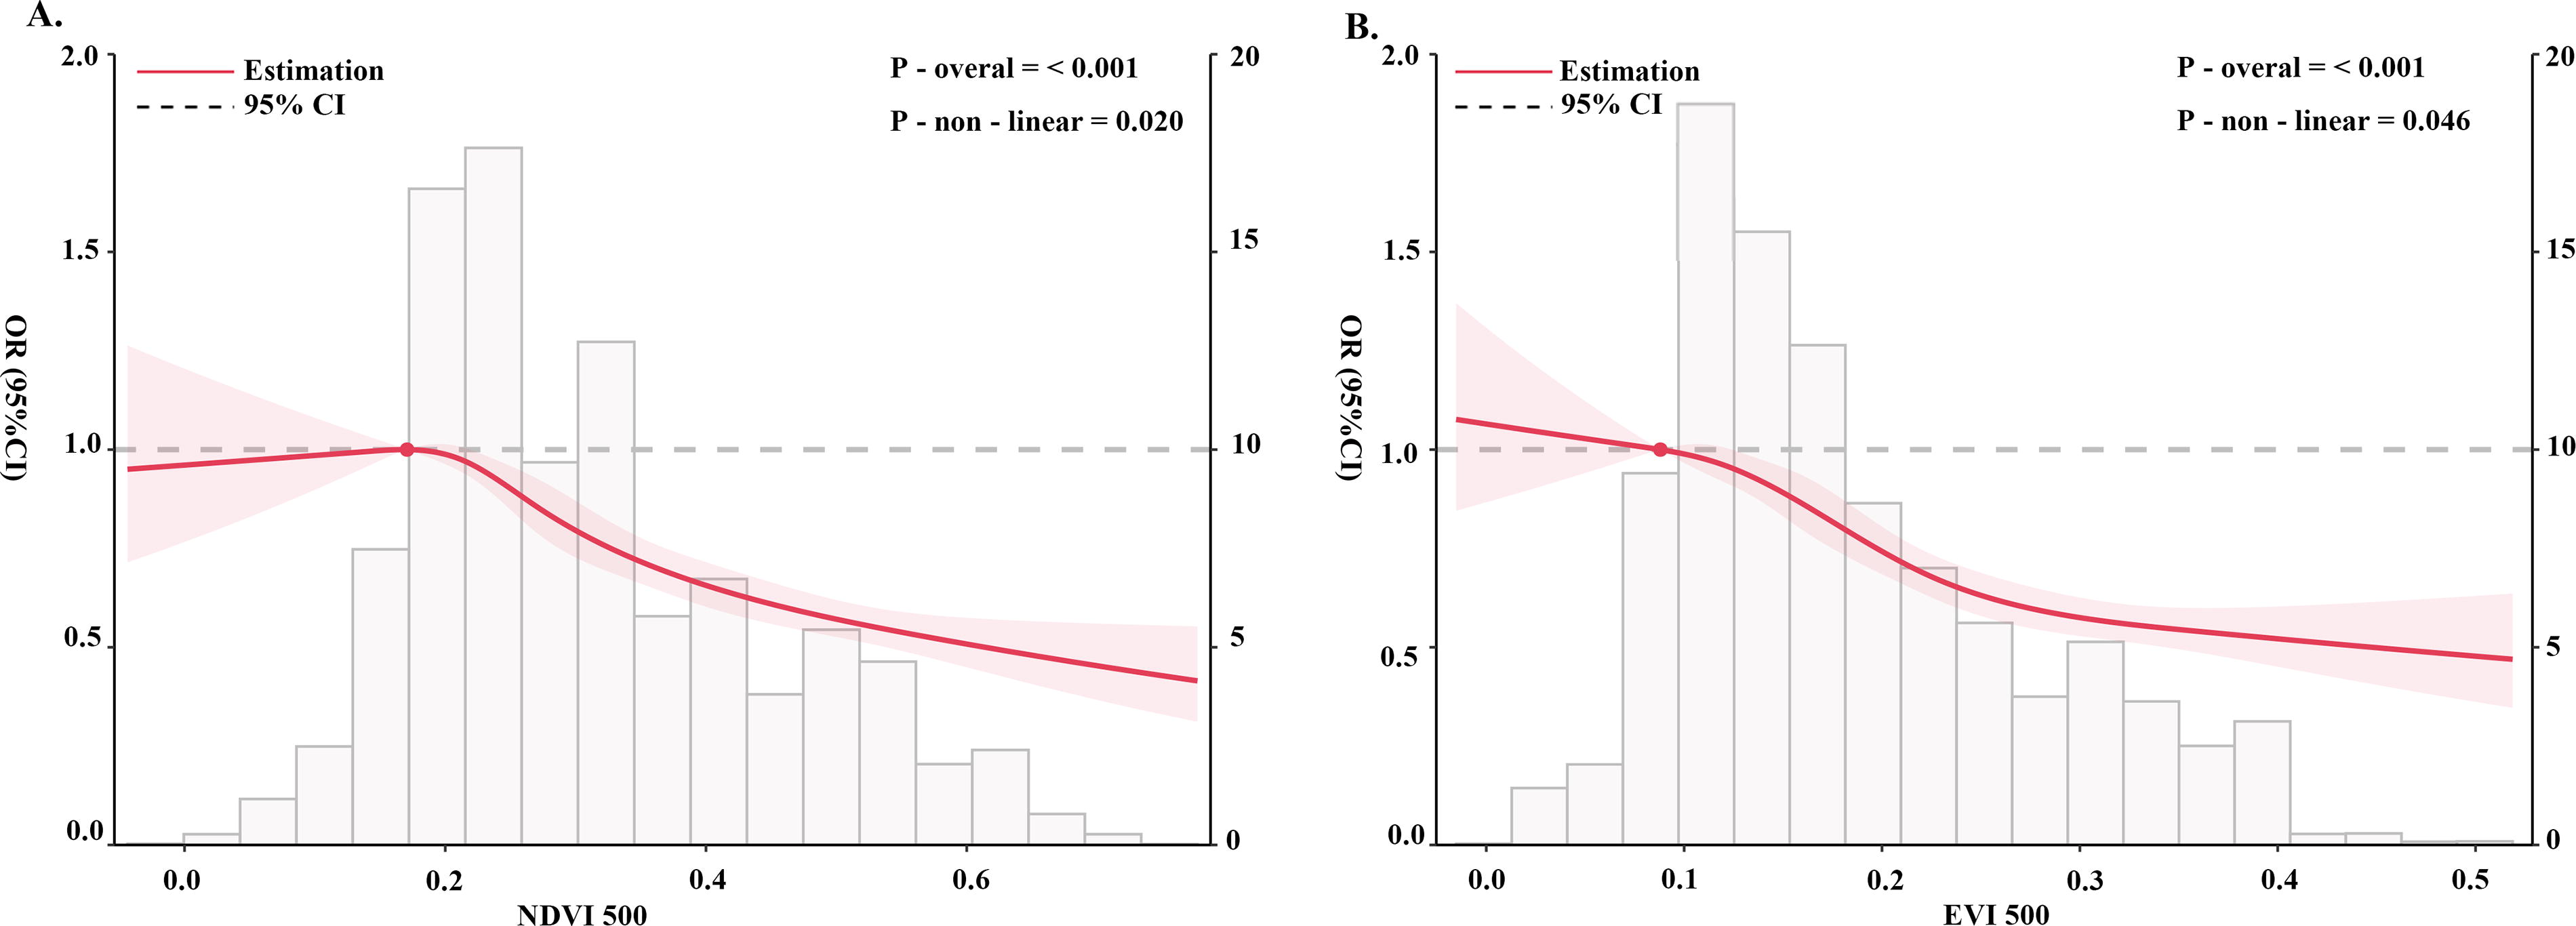
Dose–response Relationship Between Residential Greenness and Thyroid Nodule Prevalence Analyzed Using Restricted Cubic Splines.
Association between residential greenness and thyroid nodule prevalence
The prevalence of thyroid nodules in the general population is 7.43% (7.24–7.62%) when a 10-mm threshold is used for diagnosis and 21.04% (20.75–21.33%) when a 5-mm threshold is used. The prevalence of 10-mm thyroid nodules showed a decreasing trend across the quartiles of both NDVI500 and EVI500: for NDVI500, Q1 was 7.99% (7.59–8.39%), Q2 was 10.04% (9.60–10.48%), Q3 was 6.59% (6.23–6.95%), and Q4 was 5.20% (4.88–5.52%) (p for trend <0.001); for EVI500, Q1 was 8.82% (8.40–9.24%), Q2 was 8.46% (8.07–8.85%), Q3 was 6.80% (6.44–7.16%), and Q4 was 5.64% (5.30–5.98%) (Supplementary Table S1 and S2: p for trend <0.001). The results of the logistic regression analysis between greenness level and the prevalence of thyroid nodules are presented in Table 2. The results based on continuous values indicated that increased greenness was associated with a decreased prevalence of thyroid nodules after adjusting for all covariates (Model 3: NDVI500: OR = 0.20, CI = 0.16–0.25; EVI500: OR = 0.08, CI = 0.06–0.12). Furthermore, based on quartiles of greenness levels, with the lowest quartile (Q1) as the reference, higher levels of greenness (particularly Q3 and Q4) were significantly associated with a lower prevalence of thyroid nodules for NDVI500 (Model 3: Q3: OR = 0.74, CI = 0.68–0.80; Q4: OR = 0.53, CI = 0.48–0.582) and for EVI500 (Model 3: Q3: OR = 0.76, CI = 0.70–0.8; Q4: OR = 0.55, CI = 0.51–0.60).
Logistic Regression Analysis of the Associations Between Greenness Levels and the Prevalence of Thyroid Nodules
NDVI 500 quartiles: Q1 (<21.22 × 10⁻²), Q2: (21.22 × 10⁻² to <27.31 × 10⁻²), Q3 (27.31 × 10⁻² to <39.61 × 10⁻²), Q4 (≥39.61 × 10⁻²).
EVI 500 quartiles: Q1 (<11.80 × 10⁻²), Q2: (11.80 × 10⁻² to <16.04 × 10⁻²), Q3 (16.04 × 10⁻² to <23.71*10−2), Q4 (≥23.71 × 10⁻²).
Model 1: This model was not adjusted for any covariates.
Model 2: This model was adjusted for age, sex, BMI, and ethnicity.
Model 3: This model was adjusted for age, sex, BMI, ethnicity, residential locations, education levels, annual household income, smoking status, TSH, thyroid volumes, urinary iodine concentration, PM2.5 concentration, history of thyroid cancer, diabetes, autoimmune thyroid antibody positivity, family history of thyroid diseases.
BMI, body mass index; EVI, enhanced vegetation index; NDVI, normalized difference vegetation index; CI, 95% confidence interval; PM2.5, particulate matter with aerodynamic diameters ≤2.5 μm; TSH, thyroid-stimulating hormone.
Associations between residential greenness and the prevalence of thyroid goiter and AIT
The prevalence rates of thyroid goiter were 1.23%, 1.77%, 1.37%, and 1.08%, respectively (p for trend = 0.10), whereas the prevalence rates of AIT were 14.07%, 15.65%, 14.59%, and 12.81%, respectively (p for trend = 0.001), in the NDVI500 Q1, Q2, Q3, and Q4 groups. However, on the basis of the results from logistic regression analysis, in the final model (Model 3) adjusted for all variables, greenness was not associated with thyroid goiter (Supplementary Table S3, NDVI500: OR = 0.82, CI = 0.49–1.36; EVI500: OR = 0.58, CI = 0.69–1.28) or AIT (Supplementary Table S4, NDVI500: OR = 0.80, CI = 0.62–1.02; EVI500: OR = 0.73, CI = 0.50–1.07).
Restricted cubic spline analyses
The dose–response relationships between the NDVI and the prevalence of thyroid nodules based on RCSs are presented in Figure 2. The RCS results demonstrated a nonlinear decreasing trend in the prevalence of thyroid nodules with increasing levels of greenness. This trend was consistent across NDVI500 (Fig. 2A, p overall <0.001, nonlinearity p = 0.020) and EVI500 (Fig. 2B, poverall <0.001, nonlinearity p = 0.046).
Interaction and subgroup analyses
The results of interaction and subgroup analyses based on the NDVI and EVI at 500-m buffers are presented in Figure 3. No significant interaction effects were found between greenness and variables such as sex, age, BMI, ethnicity, smoking status, residential location, UIC, PM2.5, family history of thyroid disease, diabetes, and AIT. Further subgroup analyses revealed a consistent negative association between greenness and the prevalence of thyroid nodules across all groups.

Forest Plot of Interaction and Subgroup Analyses. This image combines subgroup and interaction analyses and uses logistic regression to examine the relationship between greenness values and the prevalence of thyroid nodules across different subgroups of categorical variables. The odds ratios (ORs) and 95% confidence intervals (CIs) for each subgroup are represented by dots and horizontal lines, respectively. The p value tests the interaction between the grouping variable and greenness values in relation to the prevalence of nodules. For each subgroup variable, all covariates except for the subgroup variable were adjusted. For example, when exploring the relationship between greenness and thyroid nodules in different sexes, the adjusted variables included age, BMI, ethnicity, annual household income, educational level, residential location, smoking status, TSH, thyroid volume, urinary iodine concentration, PM2.5 concentration, and history of thyroid cancer, diabetes, and autoimmune thyroiditis.
Sensitivity analysis
In addition to the consistency observed in the subgroup analyses mentioned above, sensitivity analyses were performed on the basis of the NDVI and EVI data within the 1000-m buffer (Supplementary Table S5: all p values <0.001). Furthermore, Supplementary Table S6, which used 5 mm as the diagnostic standard for thyroid nodules, as well as the results after excluding individuals with cysts on ultrasound and the sensitivity analyses in different populations—excluding AIT, excluding goiter, and excluding both—consistently revealed a decreasing trend in thyroid nodule prevalence with increasing greenness, demonstrating robust consistency across all analyses (all p values <0.001). After applying the Bonferroni correction and the FDR method, all p-values from the sensitivity analyses remained highly significant, further confirming the aforementioned negative association (Supplementary Table S7).
Discussion
Our study is the first to investigate the association between residential greenness and thyroid nodule prevalence. Initially, we categorized the population on the basis of the quartiles of the NDVI500 and observed a decreasing trend in thyroid nodule prevalence with increasing levels of greenness. Logistic regression analysis revealed a significant negative association between increasing residential greenness levels and thyroid nodule prevalence. Additionally, we employed RCS and reported a statistically significant nonlinear relationship between greenness values and thyroid nodule prevalence. In the sensitivity analysis, we further validated the results using data from a 1000-m buffer zone. In addition to using 10 mm as the diagnostic threshold for thyroid nodules, we also referred to previous studies from the TIDE project, 32 which employed 5 mm as the diagnostic standard for thyroid nodules. On the basis of the higher thyroid nodule prevalence under these criteria, we performed the analysis using modified Poisson regression. 29 Furthermore, to reduce the impact of pure cystic nodules, we excluded individuals with cysts on ultrasound from the analysis. All the results of the sensitivity analyses remained robust, further supporting the negative correlation between increased greenness and decreased thyroid nodule prevalence. None of the interaction analyses yielded significant results, and the negative association between greenness and thyroid nodule prevalence remained robust across subgroups of each categorical variable.
The results of sensitivity analyses for thyroid nodules with a maximum diameter exceeding 5 mm further support the negative association between higher levels of greenness and a lower prevalence of thyroid nodules. Nodules less than 10 mm in size can be used to detect previously undiagnosed thyroid nodules, potentially leading to an overestimation of their prevalence. 4 Nodules with diameters between 5 mm and 10 mm may have less clinical significance than those larger than 10 mm. However, our results suggest that both larger and smaller nodules are negatively associated with greenness. The Bonferroni correction and the FDR method were applied to assess the multiplicity of p values in the sensitivity analyses to minimize the risk of false positives, and the p values remained highly significant after adjustment.
In this study, sensitivity analyses excluding individuals with cysts and different subpopulations (excluding those with AIT, goiter, or both) further strengthened the robustness of the inverse association between greenness and thyroid nodule prevalence. The consistent results in populations excluding AIT and goiter suggest that negative association between residential greenness and the prevalence of thyroid nodules may be independent of these known thyroid disorders. However, molecular-level research is still needed to elucidate the specific biological pathways involved.
Previous studies 33 have reported a higher prevalence of thyroid nodules in females than in males, which is consistent with our results. As shown in Supplementary Table S8, the prevalence of thyroid nodules in males and females was 5.25% (5.02–5.49%) and 9.09% (8.80–9.39%), respectively. However, our analysis indicated that the effect of greenness on thyroid nodules may be independent of sex. In particular, the interaction and subgroup analyses shown in Figure 3 did not reveal a significant interaction between greenness and sex.
Rapid urbanization leads to an influx of people into urban areas, resulting in increased residential density and relatively less green vegetation, which in turn results in lower levels of greenness in urban areas. 34 Therefore, we further compared the prevalence of thyroid nodules between rural and urban areas, with a prevalence of 6.96% in rural areas and 7.42% in urban areas (Supplementary Table S8). Although the prevalence of thyroid nodules is slightly higher in urban areas, no significant interaction between greenness and residential areas was detected in the analysis of thyroid nodule outcomes. Future research may need to further explore the roles of lifestyle, socioeconomic status, and the accessibility of medical resources in the development of thyroid nodules.
We initially hypothesized that PM2.5 and the NDVI might have an interaction effect on the prevalence of thyroid nodules. Interestingly, our analysis did not find any interaction effect. In all the PM2.5 subgroups, higher greenness was consistently associated with a lower prevalence of thyroid nodules. The potential mechanisms underlying the relationship between residential greenness and thyroid nodule prevalence still need to be explored. However, we can infer some clues from existing publications. First, the association between greater residential greenness and thyroid nodules may be related to physical activity. Green areas are often considered more suitable for exercise because they provide better air quality, natural environments, and spaces for mental relaxation, which may encourage residents to increase the frequency and intensity of outdoor activities. Research indicates that elderly individuals living in areas with higher levels of greenery or having access to natural outdoor environments engage in physical activity for longer durations and with greater intensity. 35 A previous study revealed that a sedentary lifestyle may be associated with the occurrence of thyroid nodules and their further progression to thyroid cancer. 36
Our study has some important strengths. First, this is a novel investigation into the relationship between residential greenness and the prevalence of thyroid nodules, revealing a negative association between greenness and thyroid nodule prevalence. Second, our sensitivity analyses, including validation with multiple indicators, different thyroid diagnosis criteria and detection models, and exclusion of individuals with thyroid ultrasound data showing no echogenicity, consistently support our findings, further emphasizing the robustness of our results. Third, the large sample data covering 31 provinces and municipalities in China supported our stratified analysis and adjustment for covariates.
Our study has several limitations. First, as a cross-sectional study, establishing a causal relationship between exposure to residential greenness and thyroid disease prevalence is not feasible, and further evidence from longitudinal studies, randomized controlled trials, and clinical experiments is required to establish a relationship. Second, despite the use of two different indicators to assess greenness levels, specific information regarding vegetation type was lacking. Third, while adjustments were made for multiple confounders, the presence of unknown confounders remains a possibility. For example, the absence of data on participants’ alcohol consumption, physical activity levels, and serum insulin levels hindered further adjustments and analysis regarding their potential impacts on the outcomes. Fourth, the inclusion criteria required participants to have lived in the study area for at least five years to minimize the impact of migration on the results, and migration-related confounding factors that could not be fully controlled still exist. For example, some participants may need to travel between different regions for work or other reasons or may need to live in multiple provinces/regions at different life stages. Such migration may lead to differences in their living environment, lifestyle, and access to healthcare compared to that in the study area, which could influence the study results.
Conclusions
In conclusion, our study provides the first evidence of an association between greenness level and thyroid nodule prevalence, revealing a statistically significant association between greater residential greenness and a reduced prevalence of thyroid nodules. The robustness of our findings is underscored by multiple sensitivity analyses. Future cohort studies are needed to corroborate the applicability of our findings across diverse populations and to delve deeper into the latent mechanisms underpinning the observed associations. Additionally, future studies should prioritize quantifying the health benefits of green space exposure to provide evidence-based recommendations for urban planning and policy-making.
Footnotes
Acknowledgment
The authors sincerely thank all the investigators of the TIDE study for their support, assistance, and cooperation in data collection and quality control.
Authors’ Contributions
S.L., C.L., Y.L., and T.L. planned, designed the study, and accessed and verified the data. S.L. and C.L. conducted the statistical analysis. S.L. drafted the article. All of the authors contributed administrative, technical, or material support. S.L., C.L., Y.L., L.Z., Z.S., W.T., and T.L. verified the accuracy of the statistical analysis, interpreted the results, and revised the article. All authors had full access to all of the data in the study, reviewed and approved the final article, and were collectively responsible for the decision to submit it for publication. W.T. and T.L. obtained funding for the study and were the guarantors of this work. T.L. had final responsibility for the integrity of the data and the accuracy of the data analysis.
Data Availability Statement
The TIDE data used in the study are available from the corresponding author upon reasonable request. The NDVI and EVI data were derived from MODIS on the Terra satellite, and the PM2.5 data were sourced from the University of Washington.
Author Disclosure Statement
The authors declare that they have no conflicts of interest to disclose.
Funding Information
This work was supported by the Research Fund for Public Welfare from the National Health and Family Planning Commission of China (Grant No. 201402005), Joint Funds of the Liaoning Provincial Natural Science Foundation (Grant No. 2023-MSLH-409), the Liaoning Provincial Science and Technology High-quality Development Project (Grant No. 2023JH2/20200059), and Natural Science Foundation of Liaoning Province (2023010724-JH3/107).
Supplementary Material
Supplementary Figure S1
Supplementary Figure S2
Supplementary Table S1
Supplementary Table S2
Supplementary Table S3
Supplementary Table S4
Supplementary Table S5
Supplementary Table S6
Supplementary Table S7
Supplementary Table S8
Supplementary Table S9