
Abstract
Background:
Performance of thyroid function assays can vary significantly. To address this issue, the Centers for Disease Control and Prevention (CDC) Clinical Standardization Programs conducted an interlaboratory comparison of free thyroxine (fT4) immunoassays (IAs) and laboratory-developed tests (LDTs). This assessment aimed to determine the current performance characteristics of these assays as a first step toward measurement standardization. Thyrotropin (TSH) IAs were also evaluated.
Methods:
Assays measured 41 blinded individual-donor sera, including a sample from a pregnant woman (for fT4 analysis only) and three serum pools, with 11.3–32.1 pmol/L (0.881–2.49 ng/dL) fT4 and 0.337–21.6 mIU/L TSH in duplicate over 2 days. Passing–Bablok regression analysis performed pre-recalibration compared assays performance to the CDC fT4 reference measurement procedure (RMP) or TSH all-lab mean (ALM). Additionally, the impact of linear regression-based recalibration of assays to the CDC fT4 RMP or TSH ALM was estimated. Inter-assay agreement of sample classification according to the assay-specific reference interval (RI) was assessed pre- and post-recalibration.
Results:
A total of 21 fT4 and 17 TSH assays participated. Pre-recalibration, median biases of TSH measurements to the ALM were −1.2% [confidence interval or CI −1.8% to −0.4%], and good classification agreement among TSH assays was observed. fT4 assays all showed a negative median bias to the RMP, with higher bias among IAs (median: −20.3%, CI [−21.5% to −19.4%]) than LDTs (median: −4.5%, [CI −6.1% to −3.2%]). Of the individual-donor sera, only 21 out of 40 samples were classified uniformly by all fT4 assays, indicating poor inter-assay agreement. Post-recalibration, agreement improved to 33 out of 40 individual-donor sera correctly classified by all tested IAs and LDTs. Similar improvement in post-recalibration median percent bias was observed for fT4 IAs (median: −0.2, [CI −1.2% to 0.6%]) and LDTs (median: −0.3%, [CI −2.5% to 1.4%]).
Conclusions:
The comparison among fT4 assays emphasizes the need for measurement standardization to improve accuracy and comparability. This and previous studies demonstrate the possibility to develop common fT4 RIs via standardization, enabling the use of evidence-based clinical guidelines universally in patient care. Recalibration can effectively address high variability in fT4 assays, ensuring consistent diagnostic classification.
Introduction
Thyrotropin (TSH) and free thyroxine (fT4) are the two hormones initially measured in blood to assess hypo- and hyperthyroidism and to guide treatment decisions. 1 –3 Some guidelines and recommendations suggest specific concentrations for these hormones to guide decision making. 4 Therefore, accurate and reliable TSH and fT4 tests are needed to ensure correct patient care, making the standardization of thyroid function tests to assess both thyroid gland function and therapeutic drug monitoring a priority. 5,6
Poor accuracy and comparability of TSH and fT4 tests have been described, 7 and reference systems enabling consistent assay calibration and improving other analytical factors affecting inaccurate results have been established by the International Federation for Clinical Chemistry and Laboratory Medicine (IFCC) Committee on Standardization of Thyroid Function Tests in collaboration with the Centers for Disease Control and Prevention (CDC) Clinical Standardization Programs (CSP). 7 –9 Studies assessing the analytical performance of TSH and fT4 assays after these reference systems became available are very limited. As part of the CDC’s CSP for thyroid hormones, a study was conducted to obtain information about the current analytical performance of TSH and fT4 assays to assess potential improvements and to guide further standardization activities.
Materials and Methods
Materials
Forty individual-donor sera (PS), three serum pools (Pool1–3), and one sample from a pregnant woman (PN) from the third trimester used in this study were collected using protocols described in the Supplementary Data. 10,11 Use of blood by CDC is consistent with the institutional review board approval and donor consent. No personal identifiers were provided to the CDC. The blood samples used in this project were from commercial sources. This activity was reviewed by the CDC, deemed research not involving human subjects, and was conducted consistent with applicable federal law and CDC policy. Information about donors’ medical history and medications was based on self-reporting. Four donors reported taking levothyroxine; however, the dosage information is unknown. The donors were not asked about thyroidectomy, and no donors reported taking biotin.
Concentrations for the PS were 11.3–32.1 pmol/L (0.881–2.49 ng/dL) for fT4 and 0.337–21.5 mIU/L for TSH. Pool1–3 concentrations were 15.0, 16.5, and 16.9 pmol/L for f(1.17, 1.28, and 1.31 ng/dL) and 1.09, 2.26, and 1.65 mIU/L for TSH. The fT4 concentration of PN was 11.4 pmol/L (0.885 ng/dL), but due to volume limitations, TSH was not measured.
Procedures for material shipment, storage, and analysis by assays are described in the Supplementary Data. The fT4 reference values were assigned to all samples using the CDC fT4 reference measurement procedure (RMP) described previously, and details can be found in the Supplementary Data. 12
Assays included in the study
A total of 21 fT4 assays, 4 laboratory-developed tests (LDTs) based on equilibrium dialysis (ED) liquid chromatography–tandem mass spectrometry (LC-MS/MS), and 17 immunoassays (IAs) were included in the study. Among the fT4 IAs, 8 (comprising 15 different platforms) were operated by the independent assay manufacturer and 2 by clinical laboratories. Eight IA manufacturers (comprising 16 different platforms) and 1 clinical laboratory measured TSH. Several independent manufacturers were represented by more than one platform. Further information about the assays used in the study is summarized in Table 1.
List of Assays Included in the Interlaboratory Comparison Study
A total of 22 assays, 4 LDTs and 18 IAs, performed by 14 independent entities (12 manufacturers and 2 clinical laboratories) were included in the interlaboratory comparison. Each assay was analyzed independently. Assay manufacturers that submitted data for more than one platform are indicated as multiple letters in the ID column. Twenty-one of the laboratories measured serum fT4 and 17 measured serum TSH with commercially available IAs. Four of the laboratories performed serum fT4 measurements with LDTs based on ED LC-MS/MS methods.
Assay manufacturer “V” did not submit fT4 data.
ED LC-MS/MS, equilibrium dialysis liquid chromatography–tandem mass spectrometry; fT4, free thyroxine; IA, immunoassay; LDT, laboratory-developed test; TSH, thyrotropin.
Data analysis
The study design was based on the Clinical and Laboratory Standards Institute (CLSI) document EP09-A2. 13 Agreement among LDT and IA manufacturers was assessed using the 40 PS. The concentration of one PS was outside the reportable range for most assays and therefore excluded from TSH analysis. Percent bias of sample replicate means to either the fT4 reference value or the all-lab mean (ALM) for TSH, median bias, confidence interval (CI) of the median bias, and the percent coefficient of variation (CV) for replicate measurements were calculated for each assay. Outliers detected among replicate fT4 or TSH data were removed using the guidelines described in CLSI document EP09-A2. 13 Suspected transcription errors (with biases to the ALM of 585–609%) for replicate TSH measurements of the same study sample by assay “O” were removed prior to analysis. Analysis of Pool1–3 or PN sera assessing the impact of serum pooling and pregnancy on fT4 measurement was performed independently of the analysis of the 40 PS.
Included assay manufacturers (LDT and IA) and clinical laboratories were compared to the CDC fT4 RMP (or the TSH ALM) using Passing–Bablok regression, chosen to account for the measurement error in the assay and CDC RMP data without making assumptions about the distribution of residuals. The mean biases of replicate measurements of the 40 PS samples among assays were compared to the criteria for acceptable performance, the greater of 0.3 ng/dL or ±15% for fT4 and 0.2 mIU/L or ±20% for TSH, set by the Centers for Medicare & Medicaid Services (CMS) to assess method performance pre- and post-recalibration. 14 Methods for estimating the impact of pregnancy, sample pooling, and T4 supplementation on measurement accuracy are described in the Supplementary Data. Data were analyzed using Microsoft Excel® with the Analyse-it® (version 5.90) add-in and the R statistical environment in R Studio® (version 4.1.2).
fT4 and TSH in-silico recalibration
Linear regression-based assay recalibration was performed in-silico using assay PS results and the reference value (or TSH ALM) for that sample. Pooled and PN samples were not included in linear regression models. In-silico recalibration was conducted by subtracting the intercept from the original submitted data and by dividing the slope. Classification of serum samples was performed post-recalibration by comparing the recalibrated results to a unified reference interval (RI), which was calculated according to the principles of transference discussed in the CLSI document EP28-A3c. 15 Prospective transferred RIs were chosen from the RIs of assays (Fig. 1) with linear regression slopes closest to 1 and intercepts closest to 0.
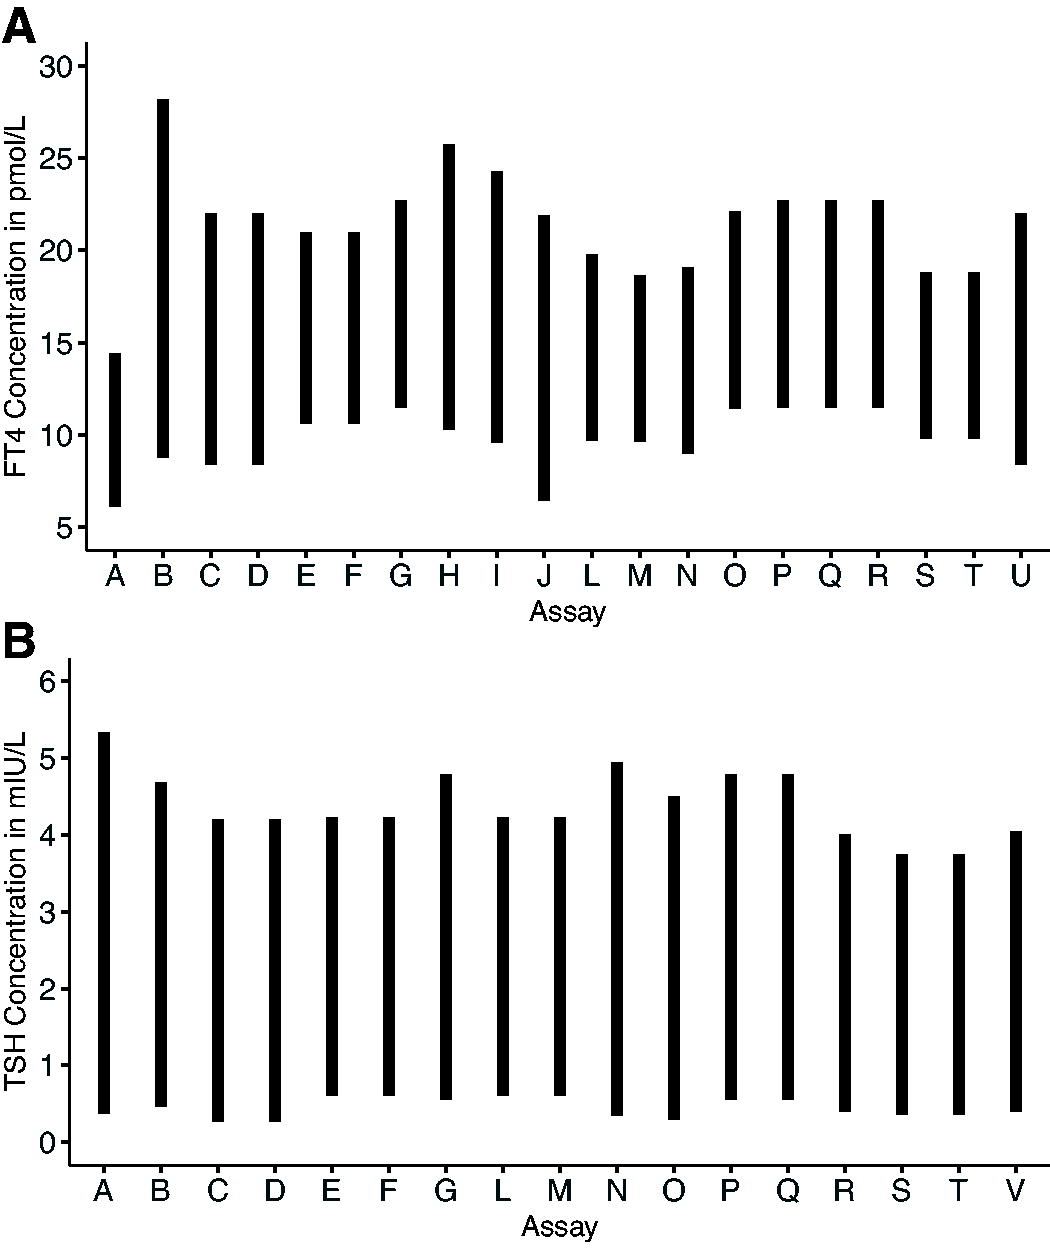
Assay-specific reference intervals among included fT4 assays. Assay-specific reference intervals for assays are shown for fT4
Results
Comparison of fT4 measurements to the CDC RMP
Based on the data as received from assays included, the all-sample median percent bias with CI to the CDC RMP observed for the 40 PS among all assays was −17.1% [CI −18.1% to −15.7%). LDTs had better accuracy, with median bias [CI] of −4.5% [CI −6.1 to −3.2], compared to −20.3% [CI −21.5 to −19.4] for IAs (Fig. 2 and Table 2). Pre-recalibration, 3 out of the 21 fT4 assays met the CMS criteria for all PS, with 5–40 of the 40 PS meeting the bias requirement among fT4 assays (Table 3). The mean percent of samples meeting the CMS requirements [±CI] for individual fT4 measurements was higher [99.0% ± 1.8%] among fT4 LDTs than IAs [58.9% ± 12.9%], which improved to 99.5% ± 1.6% for fT4 LDTs and 97.0% ± 1.9% for fT4 IAs post-recalibration. The bias distributions were narrow with an average interquartile range (IQR) across all assays of 9.0% (Fig. 2) for fT4. The fT4 bias becomes more negative with increasing fT4 concentrations for IA, while LDT bias remains constant (Supplementary Fig. S2). Most assays were well correlated with the CDC RMP with correlation coefficients >0.8 (Supplementary Fig. S1). The Passing–Bablok regression parameters among LDTs indicate well-calibrated assays with slope and intercept CIs encompassing 1 and 0, respectively. Only one of the 17 Passing–Bablok regression parameters among the IAs met the same criteria for slope and intercept (Table 2 and Supplementary Fig. S3). The mean precision (range of mean CV) was 3.8% (1.7–8.0) for all fT4 assays pre-recalibration and 4.3% (1.9–10.3) post-recalibration (Table 2). Comparing the fT4 replicate mean biases among the four PS from donors taking levothyroxine to the fT4 mean biases of the remaining 36 PS by two sample t-test suggests a significant difference in biases between these two groups for IAs (p-value <0.05) but not for LDTs (p-value >0.05) at the 5% significance level. No significant difference between the two groups was observed among TSH assays (p-values >0.05).
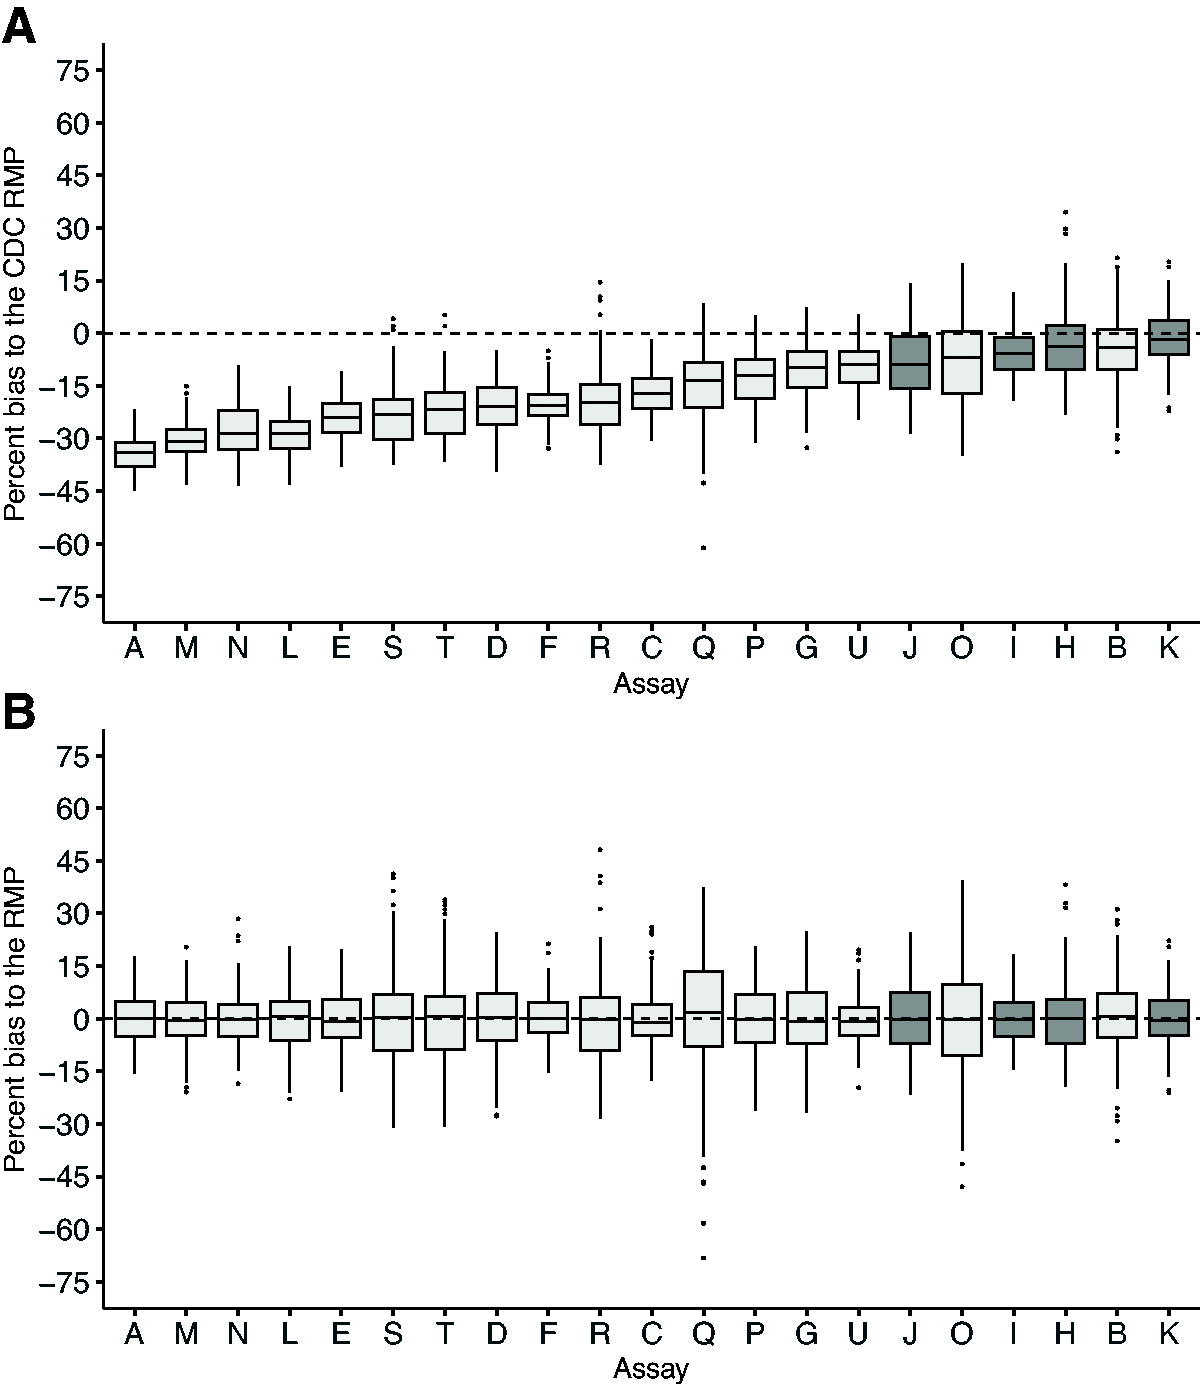
fT4 distribution of biases observed among fT4 assays from the 40 single-donor study samples (PS) to the fT4 RMP. Percent biases of each assay’s individual replicate fT4 measurements to the CDC RMP were calculated for all 40 PS pre-recalibration
A Comparison of Assay Free Thyroxine Values to Centers for Disease Control and Prevention Free Thyroxine Reference Measurement Procedure
Median bias and confidence interval (CI) of bias, Passing–Bablok regression equation, and average coefficient of variation (CV) were determined with 40 individual donor sera for fT4, pre-recalibration (
n/a, not available.
Percent of Sample Replicate Mean Biases Meeting Center for Medicare Services Acceptable Bias Criteria for Free Thyroxine and Thyrotropin for Each Assay Tested
Absolute biases of the assays’ replicate measurements to the CDC RMP (or all-lab mean for TSH) we calculated among all non-pregnant, single donor samples and compared to the CMS criteria for acceptable assay performance among tested immunoassays (IAs) and laboratory-developed tests (LDTs). 14 The percentages of the 40 (39 for TSH) samples meeting these criteria for each lab are shown pre- and post-recalibration. A value of “n/a” indicates a lack of reported data for that assay and analyte.
Comparison of Assay Thyrotropin Values to All-Lab Mean
Mean bias and confidence interval (CI) of bias, Passing–Bablok regression equation, and average coefficient of variation (CV) were determined with 38 individual donor sera for TSH, pre-recalibration (
Comparison of TSH measurements to the ALM
The 17 included TSH IAs were in better agreement compared to fT4 assays with a median percent bias (Fig. 3 and Table 4) to the ALM of −1.2% [CI −1.8% to −0.4%]. The sample replicate mean bias distribution among all TSH assays showed a narrow 5.4% mean IQR. Out of the 17 TSH assays, 10 met the CMS measurement criteria for all PS, with 31–39 of the 39 PS meeting the bias requirement among TSH assays (Table 3). Results of Passing–Bablok regression analysis indicate 5 out of the 17 TSH assays are well-harmonized to the ALM, with CIs of slope and intercept including 1 and 0, respectively (Table 4 and Supplementary Fig. S6). The mean precision (range of mean CV) was 2.6% (1.0–5.6) for all TSH assays pre-recalibration and 2.2% (0.9–5.4) post-recalibration (Table 4).
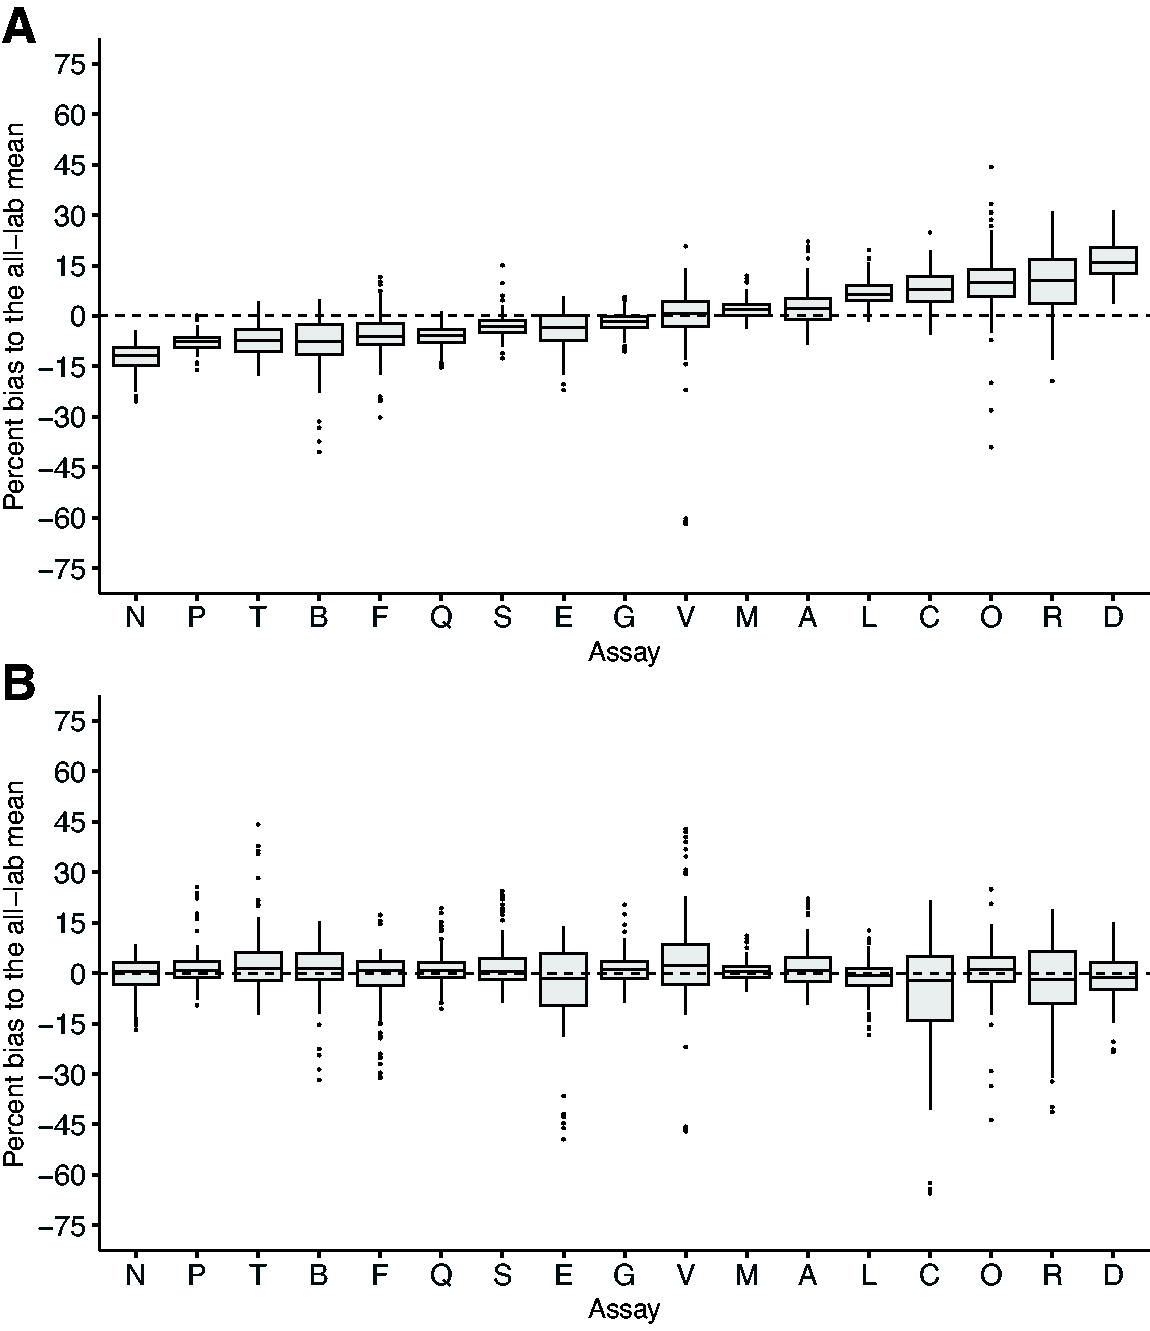
Distribution of TSH biases to the all-lab mean. Mean percent biases of each IA’s replicate TSH measurements to the mean of biases reported for all labs were calculated for all 39 study samples pre-recalibration
Comparison of end user and manufacturer data for fT4 and TSH
Agreement between the manufacturer and the end user results varied. For IA manufacturer “P,” Passing–Bablok regression analysis of fT4 data indicated no significant difference between manufacturer “P” and end user (“G”) with CIs of slope and intercept including 1 and 0, respectively (Fig. 4). This contrasts with the comparison of manufacturer “P” to the clinical lab (“G”) for TSH measurement (Fig. 4) and the comparison of fT4 manufacturer “C” to the clinical lab “U” (Fig. 4), where the CI of the slope parameter is >1. Use of the same lots of calibrators and reagents was confirmed for fT4 measurement between assays “P” and “G”; however, different calibrator and reagent lots were used in TSH assays “P” and “G.” Reagent and calibrator lot numbers could not be determined for fT4 assays “U” and “C.”
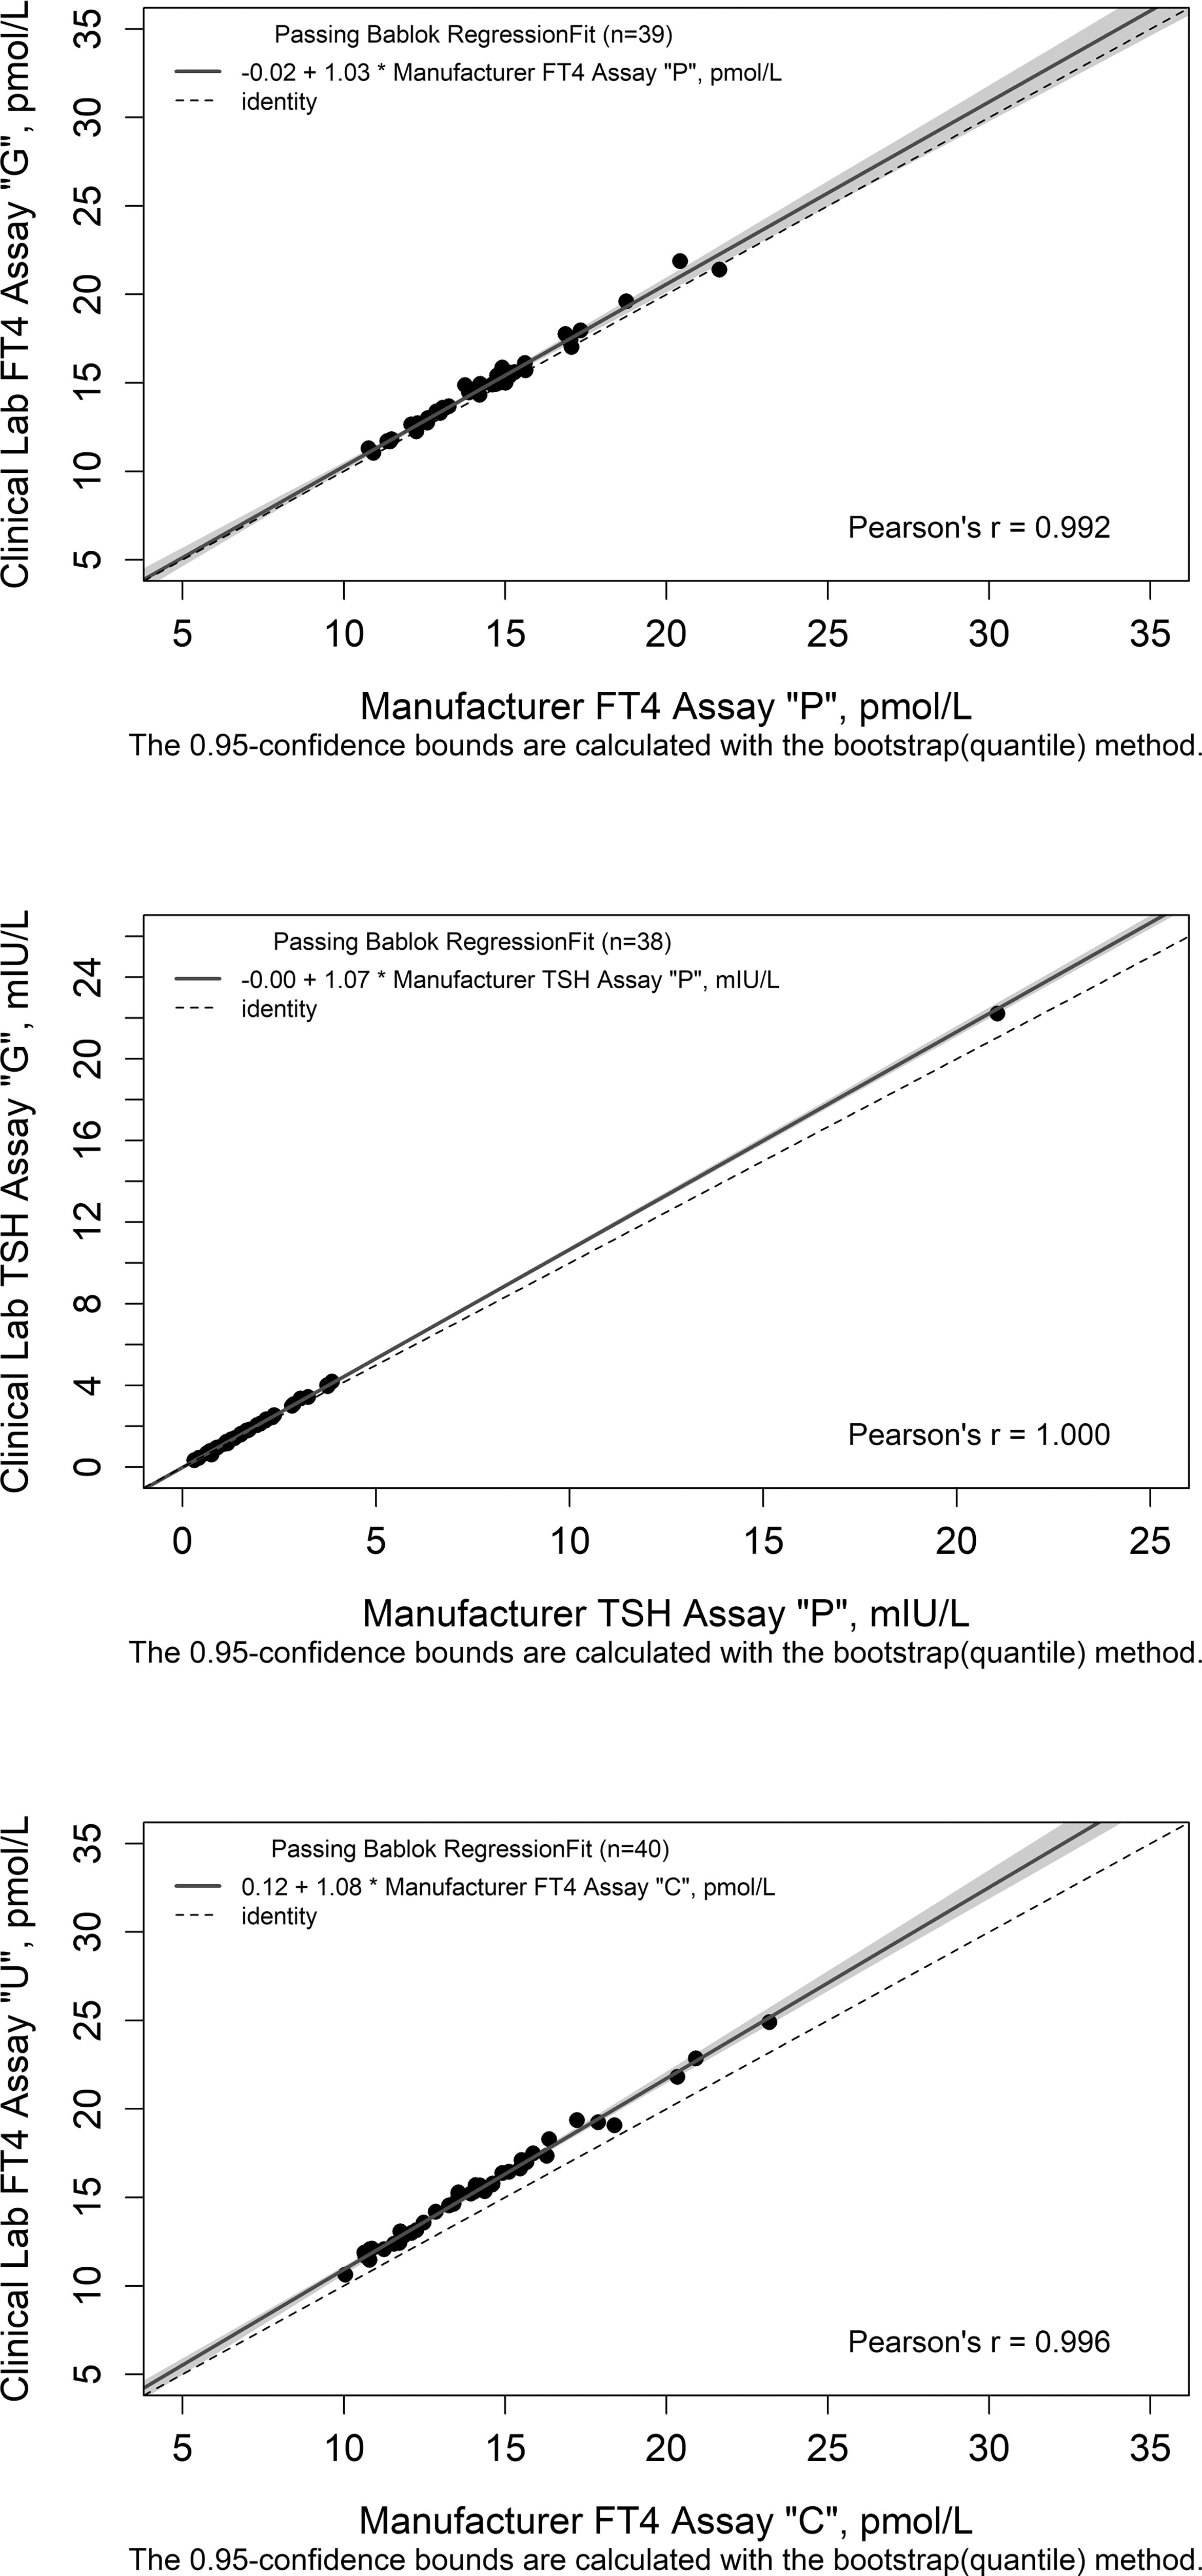
Comparison of bias to the RMP for manufacturers and their corresponding clinical labs. Mean percent biases were compared among clinical and manufacturer lab pairs measuring fT4 or TSH with the same method. Passing–Bablok regression analysis of manufacturer “P” and clinical lab “G” paired labs are shown in plot A (fT4) and plot B (TSH). Passing–Bablok regression analysis of fT4 manufacturer “C” and clinical lab “U” paired labs are shown in plot C. The y = x identity line is indicated by the dashed horizontal line, and Passing–Bablok regression with confidence interval (CI) is indicated by the solid lines and grey bands. The CI of the slope and intercept parameters are [0.938–1.12] (slope) and [−1.30 to 1.24] (intercept) for plot A, [1.03–1.08] (slope) and [−0.031 to 0.070] (intercept) for plot B, and [1.04–1.11] (slope) and [−0.282 to 0.720] (intercept) for plot C.
Improvements in sample classification after in-silico recalibration
After recalibration of the fT4 assays, classification was repeated using the recalibrated PS sera results and the RI transferred from assay “H” (9.75–25.1 pmol/L or 0.758–1.95 ng/dL). Classification of TSH results post-recalibration was performed in a similar way, by first performing transference testing using the ALM for comparison, and then reclassifying assay results using the transferred RI from TSH assay “M” (0.606–4.32 mIU/L).
Agreement among fT4 assays on sample classification was poor before recalibration; 21 out of the 40 PS were classified uniformly by all assays (Table 5). fT4 classification agreement improved upon recalibration to 33 out of the 40 PS uniformly classified by all assays. TSH classification agreement was consistent pre-recalibration (33 out of the 39 PS) and post-recalibration (32 out of the 39 PS) (Table 6). Post-recalibration fT4 assay median percent biases (CI) improved to −0.2% [CI −1.1 to 0.5] overall, −0.2% [CI −1.2 to 0.6] for IA, and −0.3% [CI −2.5 to 1.4] for LDT (Fig. 2). Median percent bias among TSH assays improved to 0.5% [CI 0.0–0.8] post-recalibration (Table 4).
Free Thyroxine Classification Agreement Among Included Immunoassay and Liquid Chromatography–Tandem Mass Spectrometry–Based (Laboratory-Developed Test) Assays
The percentage of the 21 included IAs and LDTs reporting fT4 concentrations below, within, or above the assay-specific reference interval (RI) for each sample is shown before in-silico recalibration. Post-recalibration, a unified TSH RI was estimated following the procedures recommended in the CLSI document EP28-A3c. 15 In brief, linear pairwise regression analysis of each tested assay to the all-lab mean was determined (Supplementary Fig. S1). Assay “H” was selected for transference of the RI because the slope and intercept of the linear regression were closest to 1 and 0, respectively. This unified RI (9.75–25.1 pmol/L or 0.758–1.95 ng/dL) is only intended to estimate the impact of recalibration on patient classification. Classification agreement after in-silico recalibration is indicated in parentheses. The percentage of assays in which the participant classification matched the classification determined by the CDC fT4 RMP RI is shown in bold.
CLSI, Clinical and Laboratory Standards Institute; PS, individual-donor sera.
Thyrotropin Classification Agreement Among Included Immunoassays
The percent of the 17 included IAs reporting TSH concentrations below, within, or above the assay-specific reference interval (RI) for each sample is shown before in-silico recalibration. Post-recalibration, a unified TSH RI was estimated following the procedures recommended in the CLSI document EP28-A3c. 15 In brief, linear pairwise regression analysis of each assay to the all-lab mean was determined (Supplementary Fig. S4). Assay “M” was selected for transference of the RI because the slope and intercept of the linear regression were closest to 1 and 0, respectively. This unified RI (0.606–4.32 mIU/L) is only intended to estimate the impact of recalibration on patient classification. Classification agreement after recalibration is indicated in parentheses. The percentage of assays in which the participant classification matched the classification determined by the surrogate TSH RI is shown in bold.
Agreement between high-quality individual donor and pooled materials for fT4 and TSH assays
Pool1–3 sera were found to be comparable to individual donor units among all IAs. The median percent biases (−21.0% for fT4 and 0.5% for TSH assays) of these samples were similar to the −20.3% median percent bias for fT4 and −1.2% median percent bias for TSH IAs measuring the 40 PS (Table 7).
Summary of Median Percent Biases Among Immunoassays and MS-Based Assays (Laboratory-Developed Test) Measuring Free Thyroxine and Thyrotropin to the Centers for Disease Control and Prevention Reference Measurement Procedure (All-Lab Mean for Thyrotropin) for Pooled (Pool1–3) and Pregnancy Samples
Median percent biases and the minimum and maximum biases among IA and LDT measuring fT4 (
PN, pregnancy.
IAs generally reported higher values (−1.9% median percent bias to the RMP, [CI −27.8 to 19.8]) for the PN compared to the −20.3% median bias [CI −21.5 to −19.4] of PS materials (Table 7). This increase occurred despite assay-specific RI being lower in general during pregnancy than the adult RI. 16
Discussion
To assess the need for standardization and monitor improvements in fT4 measurement, it was imperative to collect updated information on the status of fT4 measurements by IAs and LDTs to support the IFCC efforts. The conducted interlaboratory comparison study demonstrated high variability among commercial fT4 IAs. The large negative median assay biases of up to −34.1% to the fT4 RMP observed in this study can lead to patient misclassification as indicated by only 21 of 40 samples used in the study being classified uniformly. The observation of negative bias for IAs is consistent with the results of the College of American Pathologists (CAP) Harmonized Thyroid (ABTH) survey that uses high-quality pooled serum materials with fT4 reference values assigned by the CDC fT4 RMP. Recent ABTH 2022-B and 2023-A surveys reported sample-specific and calibration measurement inconsistencies among IAs measuring six pooled samples, with IAs underestimating fT4 concentrations and LDTs being in better agreement with the RMP. 17,18 The results of ABTH surveys are consistent with our findings despite differences in the number of samples measured and the evaluation of multiple assay’s measurement results in peer groups in the CAP surveys. 17,18 The results of a previous fT4 interlaboratory comparison study conducted by IFCC and performed at Ghent University in 2017 were compared to the present study to determine what potential improvements in accuracy have been made, although some of the assays in both studies differed. 7 Comparing the median percent bias for fT4 measurements of samples in the 10–25 pmol/L (0.8–1.9 ng/dL) range among all assays that participated in the 2017 study and all assays included in the present study showed an improvement in median percent bias (which is calibration-related) from −37.7% in 2017 to −16.8% in 2022.
In many situations, while assay-specific RIs are assumed to overcome issues with data interpretation, their use did not prevent misclassification, especially for samples near cutoff values. In the example provided (Table 5), two samples with fT4 concentrations of 11.3 and 26.5 pmol/L (0.881 and 2.06 ng/dL) were classified as euthyroid and hyperthyroid by the fT4 RMP, respectively. Most of the 21 assays misclassified these samples with challenging fT4 concentrations (15 misclassified the 11.3 pmol/L sample and 14 misclassified the 26.5 pmol/L sample).
The in-silico recalibration increased the number of samples classified uniformly by all assays from 21 to 33 of the 40 PS, suggesting that while some sample-specific bias exists, significant improvement in overall consistency of sample classification can be achieved upon recalibration. While some sample-specific scatter existed for most of the assays (Supplementary Table S2), recalibration improved both classification agreement among assays and bias to the CDC RMP. After recalibration is complete, manufacturers can focus on improving sample-specific bias. The study demonstrated that recalibration significantly improved the accuracy of assays and the consistency of classifications. Stakeholders should be aware that assay values may change by as much as 34% or more following standardization. However, the IFCC study suggests that this shift in assay values due to recalibration is viewed as a positive change and is not expected to pose a problem to stakeholders. 9,19
While the study results revealed problems with the accuracy of many IAs, some promising data were observed. The improved median percent bias from the 2017 study to the present study suggests that some of the IA manufacturers have already initiated standardization activities, successfully decreasing calibration bias. The significant fT4 median bias of the present study indicates further improvement is needed, with individual assays demonstrating median biases up to −34.1%. The majority of TSH assays were in overall good agreement with the ALM pre-recalibration; 13 of the 17 median bias CIs were within the desirable bias limits based on biological variation (±10.1%), 20 and 33 of the 39 PS samples were classified in the same way by all 17 assays using their method-specific TSH RI, demonstrating success in harmonization of TSH IAs. 8 By contrast, pre-recalibration Passing–Bablok regression parameters among TSH assays indicated most methods were significantly different from the ALM. These differences may be the result of the influence of the single high-concentration TSH sample included in the study, and further studies with additional samples in this concentration range are needed to assess the bias on the full concentration range. The low TSH median bias and narrow bias distributions are likely the result of ongoing TSH harmonization efforts by the IFCC. 8 It is also worth noting that all TSH and fT4 assays had good precision pre- and post-recalibration.
The utility of fT4 measurements of pooled materials was also explored. Using pooled materials can be beneficial when large volumes of the same material are needed, that is, for preparation of trueness or quality controls. However, combining individual units of different binding protein concentrations may result in non-commutable pooled material. When analyzed by each of the included IAs, the high-quality Pool1–3 materials (prepared in accordance with the updated CLSI C-37A procedure) and PS samples provided comparable results when results for each set of samples analyzed were compared to the fT4 RMP. 10 This suggested that high-quality pooled materials may be used in a similar manner as individual donor samples for calibration and performance evaluation. However, additional IA-specific studies of the commutability of pooled materials are needed.
In addition, study participants were asked to measure one sample from a pregnant (third trimester) woman. The results were consistent with the recently published study comparing pregnant women to controls and demonstrated that the majority of the IAs measured lower fT4 in healthy controls compared to PNs. 16,21 The previously published study did not look at differences in fT4 measurements based on trimester, and the reported mean gestational age of the study participants was 24.8 weeks. Based on the limited information from just one sample, IAs overestimated fT4 concentration in the PN sample, while the difference was not as consistent among LDTs. The extent of the overestimation varied depending on the IA used and is most likely due to interferences present in pregnancy samples with the methodologies used.
Another important aspect of standardization is ensuring that clinical laboratories using the same IAs receive comparable results to manufacturers. One IA manufacturer and clinical laboratory pair using identical assays (Labs “G” and “P”) to measure both fT4 and TSH for the study were compared. For fT4 measurement, the pair used identical calibrators and reagents and reported results with no significant differences. For TSH measurement, significant differences in the performance of manufacturer “P” to its paired end user (“G”) were observed, which could be explained using different lots of reagents and calibrators reported by the two laboratories. It is important to highlight the importance of monitoring overtime performance of assays performed in different laboratories; changes associated with calibrators and/or reagent lots, among other factors, may cause inconsistencies in results.
One of the limitations of this study was the absence of samples with very high and very low fT4 and TSH concentrations. Based on previous studies, IA-based measurements of samples with such concentrations may demonstrate even higher biases. Furthermore, only limited observations were possible for samples from pregnant women and donors taking levothyroxine due to limited sample size.
Conclusions
The CDC CSP interlaboratory comparison among fT4 assays demonstrated that despite previous efforts, no notable improvements have been achieved. The current variability among fT4 assays can affect reproducibility of diagnostic classification. This variability can be easily addressed through recalibration, which is being offered with the CDC CSP fT4 Horome Standardization (HoSt) program. The study also demonstrated that there was better agreement among TSH assays, confirming the success of TSH harmonization efforts conducted by IFCC.
Footnotes
Acknowledgments
The authors gratefully acknowledge support and contributions to the study of Samantha Knoblock, Clark Coffman, Fidelia Pokuah, Danielle Gregory, Alex Doty, and Lynn Collins at the CDC and the Assay Manufacturers and Laboratories that participated in the study.
Authors’ Contributions
A.R.: Writing—original draft (co-lead), data analysis (lead), conducting the study (equal), and writing—review and editing (equal). O.S.: Conducting the study (equal) and writing—review and editing (equal). T.B.: Conducting the study (equal) and writing—review and editing (equal). N.V.: Conducting the study (equal) and writing—review and editing (equal). A.N.L.: Study design (supporting), conducting the study (equal), and writing—review and editing (equal). L.Z.: Study design (equal) and writing—review and editing (equal). U.D.: Study design (lead), writing—original draft (co-lead), conducting the study (equal), and writing—review and editing (equal). H.W.V.: Supervision, study conceptualization (lead), study design (supporting), writing—original draft (equal), data analysis (supporting), and writing—review and editing (equal).
Disclaimer
The findings and conclusions in this report are those of the authors and do not necessarily represent the official position of the CDC. Use of trade names and commercial sources is for identification only and does not constitute endorsement by the CDC or the U.S. Department of Health and Human Services.
Author Disclosure Statement
All coauthors are CDC employees involved in a program offering the CDC CSP fT4 HoSt. The authors do not receive any direct reimbursement from the program offered by the CDC. The authors have no conflicts of interest to disclose.
Funding Information
This research did not receive any specific grant from funding agencies in the public, commercial, or not-for-profit sectors. The authors have no funding information to declare.
Supplementary Material
Supplementary Data
Supplementary Figure S1
Supplementary Figure S2
Supplementary Figure S3
Supplementary Figure S4
Supplementary Figure S5
Supplementary Figure S6
Supplementary Table S1
Supplementary Table S2