
Abstract
Introduction
Dietary advice plays an important role in the healthcare system, for both disease prevention and management. 1,2 Before providing dietary advice, nutritionists need to review the dietary intake records of clients to assess their nutritional status. Currently, nutritionists conduct face-to-face consultations with clients to obtain accurate dietary intake information. This practice, however, can be improved through the use of new technology. For example, the type of food and number of servings of each food item can be electronically input to a Web site. After a nutritionist has reviewed the information, dietary comments can be given through e-mail or online reporting. If necessary, a teleconference can be arranged to provide a detailed consultation. The term “tele-dietetics” has been suggested to describe this new process, which complements telemedicine and e-health in a holistic healthcare system (Fig. 1). Such a process can enhance efficiency, break down distance-related barriers, and maximize the accessibility of dietetic services to an expanded population. To make tele-dietetics more user friendly, image dietary records are preferable to textual ones. Digital photography is increasingly popular for recording dietary intake. Previous studies examining the validity and reliability of various assessment modes have found fair agreement in estimated nutrient intake between digital food photos and food weightings 3 and in portion size estimation between digital food photos and direct observation. 4 The results are highly reproducible, 3,5 although some have been found to be slightly overestimated. 4 Despite such breakthroughs, shortcomings have been found for two-dimensional (2D) images, which do not clearly show the three dimensions of volume, especially depth. In addition, studies indicate that 2D images are not used to assess certain food types, the sauce and oil used and the cooking method, which may be the reason for the lower correlations found for some food types. 4,6
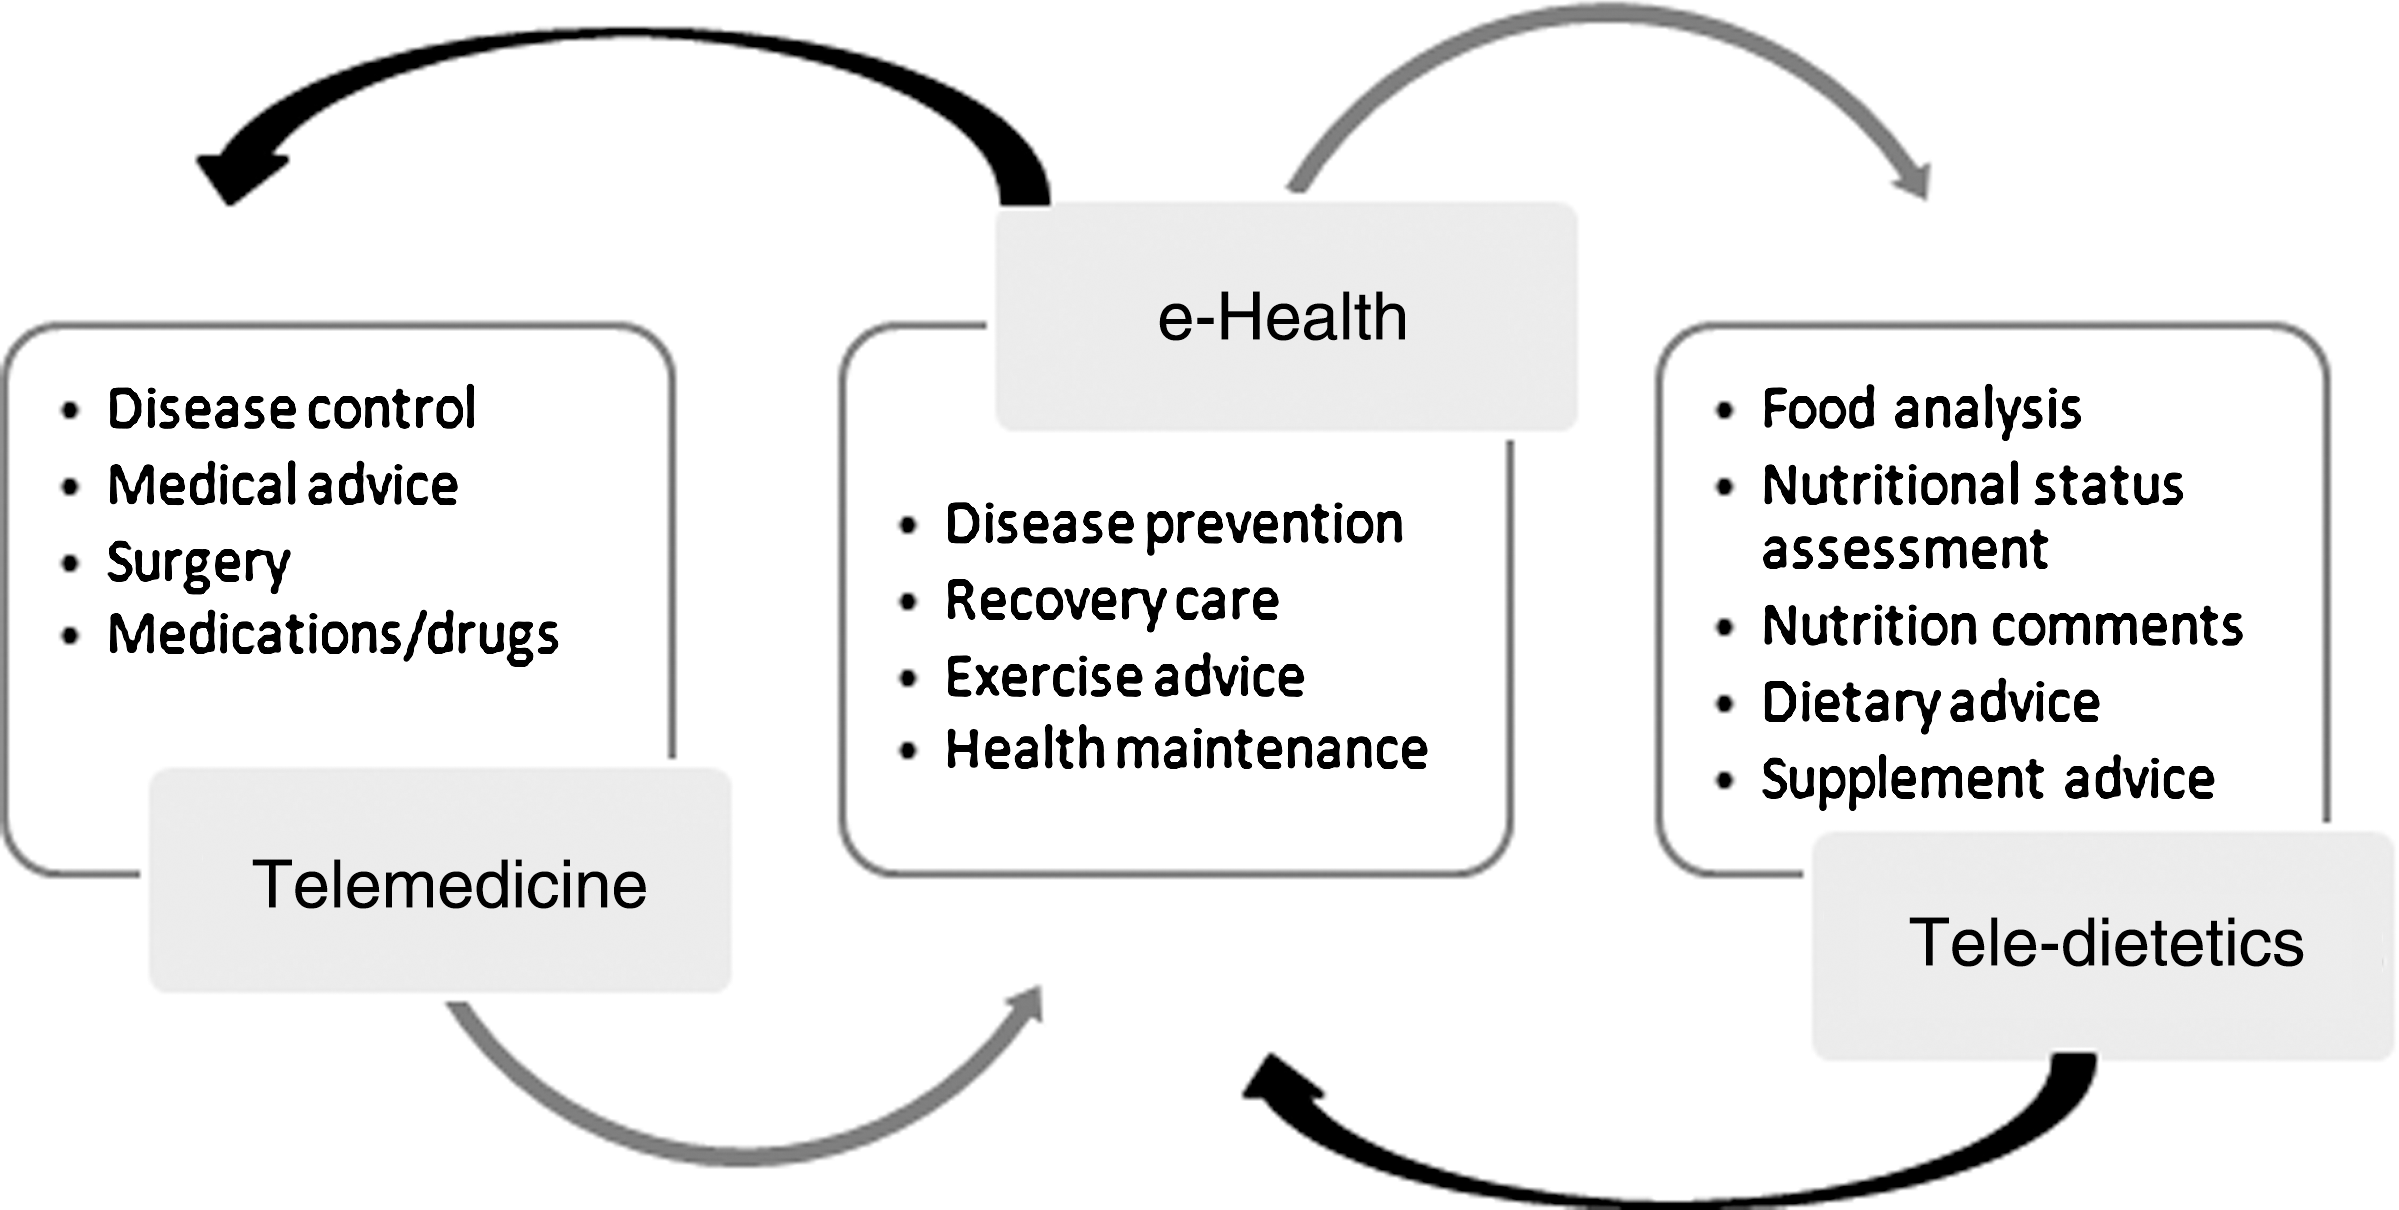
The role of tele-dietetics as an integrated approach in telemedicine and e-health.
Another problem of previous studies is that correlation analysis is based on measures of energy, protein, fat, carbohydrates, sodium, potassium, calcium, magnesium, vitamin D, vitamin C, cholesterol, dietary fiber, and many other nutrients, 6 based on the weight or volume of the food after nutrient analysis. Thus, the different proportions of ingredients in a particular food item must be correctly identified based on food volume or weight prior to such analysis. Although the study of 2D images carried out by Williamson et al. 4 is better in terms of its use of food estimates based on a percentage of reference portion sizes as the outcome measurements, the study does not take into consideration the cooking method or the amount of oil or type of sauce used.
Volume includes height, width, and depth. With 2D food images, food volume can be judged only on a horizontal plane. With a planar image, volumetric displays create three-dimensional (3D) volume with virtual depth. If 2D food images improve diet evaluation, then would 3D images improve it further? To address this question, it is critical to evaluate the reliability and accuracy of the aforementioned parameters estimated using 2D images and then compare them with estimations obtained using 3D images. To make tele-dietetics feasible, the types of images used to record dietary intake must be evaluated to determine which among them is the best.
Objective
The objective of this study was to compare the reliability and accuracy of estimations made using 2D and 3D food images.
Research Questions
How reliable are the estimations of food volume, ingredients, type of sauce, cooking method, and oil usage based on 2D and 3D images?
How accurate are these estimations based on 2D and 3D images?
Are there any differences in the estimations between the 2D and 3D images?
Materials and Methods
Subjects and Sampling Method
The estimations using 2D and 3D food images were made by observers from January 2008 to June 2008. The observers were nutritionists who had obtained at least a bachelor's degree in Food and Nutritional Science, had no less than 5 years of practical experience, and had knowledge of and experience in food assessment. They were identified from the graduate contact list of a university's Bachelor in Food and Nutritional Science program. The 1996–2001 period was chosen to ensure that the graduates had at least 5 years of work experience in practical food assessment. All of those on the list who had e-mail addresses were invited to participate.
The e-mail invitations include an introductory message and an information sheet that described the study objectives and tasks. A consent form was attached, and the nutritionists were asked to sign and return it if they agreed to participate.
Procedure
Preparation of test foods
The food items to be identified were prepared by the researcher to ensure consistency. Any sauce used was documented by the number of tablespoons. The oil used in preparing the food was also measured in tablespoons.
Food weightings
The solid food items were weighed on an electronic scale in grams. The volume of foods in a liquid state, such as milk, was measured in a measuring cylinder in milliliters. All of the food weightings were recorded and used as the gold standard.
Preparation of 2D food images
The test food items were photographed with a digital camera mounted on a tripod with the lens 1.08 m away from the horizontal plane of the food. The lens was positioned at 85 cm above the food tray with a camera angle of ∼38.2°. A region was marked out on the table to ensure that all food items were at a fixed, constant distance from the camera. A tablespoon was placed beside each food item when the photographs were taken. This was to help the observers evaluate the food volume with a standard reference. Ten 2D food images were taken.
Preparation of 3D food images
The test food items were placed in the region marked on the table, with images taken by a video recorder mounted on the same tripod with the lens at the same distance and angle as in the digital camera settings. The video clips were filmed at a fixed location with each test food self-rotating 360° in the vertical plane over 10 s. A tablespoon was again placed beside each food item for the same purpose as in the 2D images. The 10 video clips were uploaded to a computer as RealPlayer files.
Observers' evaluation
Five compact discs (CDs) stored the ten 2D food images in a “Test 1” folder and the ten 3D food images in a “Test 2” folder. Another five CDs stored the ten 3D food images in a “Test 1” folder and the ten 2D food images in a “Test 2” folder. The observers were randomly divided into Groups A and B, with five in each, and then randomly assigned one CD by drawing ballots. They took the CDs home to make their estimations and were told to evaluate Test 1 before Test 2. The observers were asked to use the Word file in the CD to record their group assignment and the test number, meal label, ingredients identified for each food item, estimated weight of each ingredient in grams (or, if the food was in a liquid state, then the volume in milliliters), estimated cooking method, estimated amount of oil used, and type of sauce added, if any.
Outcome Measurements
The outcome measurements included the following variables: Ingredient(s) of each food item Weight of each food item (g/mL) Cooking method for each food Number of tablespoons of oil used in each food item (if any) Type of sauce used in each food item (if any)
Data Analysis
The reliability of the variability among the observers using the 2D and 3D images was analyzed with intraclass correlations (ICCs) because they describe whether the scores are correlated as well as significantly different. The Model 2 formula was applied because repeated measures analysis of variance was conducted, 7 with the observers as the independent variable. Each food item was assessed by the same observers, who had been randomly chosen. With categorical variables such as type of ingredients, sauce type, and cooking method, reliability was appropriately assessed as a measure of agreement. The one-sample t-test was used to determine whether the food estimations in the experimental assessments (the 2D and 3D food images) were significantly different from the gold standard, that is, the food weightings for solid food, the food volume of liquid foods, and the number of tablespoons of oil added.
Results
A total of 180 nutritionists were found to have graduated between 1996 and 2001, and 54 of them had e-mail addresses listed. Of the e-mail invitations sent out, 21 bounced back, having failed to reach the target nutritionists. This may be because the e-mail address list was out of date. Of the remainder, 17 did not reply, and 6 declined to participate because they were too busy. In total, 10 nutritionists agreed to conduct the observation and make food estimations, for a response rate of 30.3%.
Reliability
The food volumes of choy sum, Chinese soup, milk, potato chips, oranges, chicken, the breakfast set, and dumplings were found to be overestimated when 3D images were used. The food volume estimations for fish and rice were similar using 2D and 3D images. In general, however, the 3D images led to higher mean estimations in food volume than did the 2D images ( Table 1 ). This general finding holds for the estimations of oil added ( Table 1 ).
Means and Standard Deviations of the Food Volume Estimations and Oil Added Estimations Among Observers
Rice and oranges had zero variance and were removed from the scale.
It was assumed that no oil was added to rice or oranges.
2D, two-dimensional; 3D, three-dimensional; SD, standard deviation.
The result of the ICCs with 2D images was 0.916, with the mean of several estimations as the unit of analysis, which reflects a high degree of correlation in the food volume estimations for the same food item among the observers. The F ratio was 17.001 and the p-value was <0.001 when the variance due to the observers was large. The result of the ICCs with 3D images was 0.846, with the mean of several estimations as the unit of analysis. The F ratio was 6.501, and the variance was significant (p-value <0.001).
Percentage of Agreement
Ingredient identification
For the identification of the ingredients in each dish tested, the percentage of agreement ranged from 50% to 100% for both the 2D and 3D food images ( Table 2 ). The paired t-test revealed that the percentage of agreement for the former (n = 16; mean = 0.87; standard deviation [SD] = 0.17) was significantly correlated (γ = 0.97, p < 0.001) with that for the latter (n = 16; mean = 0.84; SD = 0.18).
Percentage of Correct Identification of Ingredients, Cooking Method, and Sauce Type Using the Two-Dimensional and Three-Dimensional Food Images
Cooking method identification
For the identification of the cooking method used in each dish tested, the percentage of agreement for the 2D food images ranged from 10% to 100% and that for the 3D food images from 0% to 100% ( Table 2 ). The paired t-test revealed that the coefficient agreement for the 2D food images (n = 12; mean = 0.70; SD = 0.39) was significantly correlated (γ = 0.98, p < 0.001) with that for the 3D food images (n = 12; mean = 0.66; SD = 0.37).
Sauce identification
For the identification of the sauces added to each dish tested, the percentage of agreement for the 2D food images ranged from 80% to 100% and that for the 3D food images from 90% to 100% ( Table 2 ).
A one-sample t-test was computed with the actual weightings or actual volume of each food item as the reference ( Table 3 ). The mean differences of the dishes with no significant differences between the 2D or 3D images and the gold standard are listed in Table 3 . For choy sum (−9.00 vs. 31.00) and potato chips (14.5 vs. 31.1), the mean differences in the food volume estimations with the 2D images were better than those with the 3D images, whereas the reverse was true for fish (47.5 vs. 5.0) and rice (11.0 vs. 3.0). The mean differences for the 2D and 3D images of Chinese soup (67.3 vs. 63.6), milk (−23.1 vs. −23.1), and the breakfast set (−2.0 vs. 10.0) were similar to each other. All three of these food items were significantly overestimated using both the 2D and the 3D images. In contrast, the food volume estimations for choy sum, Chinese soup, fish, milk, potato chips, rice, and the breakfast set were no different from their corresponding references, regardless of the type of image used for estimation.
Comparison of Food Volume Estimations and Oil Added Estimations Using Two-Dimensional and Three-Dimensional Images with References
Actual food weight (g) for solid food, actual food volume (mL) for liquid food; actual number of tablespoons of oil added.
The mean differences in the estimates of the amount of oil added (in units of tablespoons) are shown in Table 3 . The observed estimations for choy sum from the 2D images, for the potato chips from both types of images, and for dumplings from the 2D images show significant differences with their corresponding references. The observed estimations for choy sum from the 3D images, for Chinese soup, fish, chicken, and the breakfast set from both types of images, and for dumplings from the 3D images, however, show no significant differences with their corresponding references.
Discussion
The results of the reliability and accuracy analyses of food estimation using the 2D and 3D images strongly suggest the superiority of the former, although the latter exhibits superior performance in a few areas. For the reliability in estimations among observers, the ICCs with mean ratings were good for both the 2D and 3D methods. Equally high ICCs were given by the 3D images, although these were a bit lower than those given by the 2D images. The variance due to observers was large, thus indicating that the observers' estimations were different from one another. There was a high mean correlation if the error variances were ignored with more than two items, thus indicating that reliability could be enhanced with a large number of food estimations. With 10 food items, however, these findings suggest the use of 3D images, as their degree of variance was much lower than that of the 2D images, with similar results for the ICCs.
2D and 3D Images Showed Similar Levels of Ingredient Identification
For the categorical estimations, the levels of ingredient identification were similar for both types of images. This indicates that there was no difference in observers' ability to identify ingredients whether they looked at a 2D or a 3D image, thus indicating that both types of images are reliable media for ingredient identification. This is important in cases in which the ingredients contribute a significant number of calories and the total energy input will be affected if these ingredients are not correctly distinguished.
2D and 3D Images Showed Good Identification of Cooking Methods
For the identification of cooking methods, a high degree of agreement was found between the two types of images, except for potato chips, rice, bread, and the egg in the breakfast set. The low degree of agreement for these food items was probably caused by the subjects' misuse of words. For example, the word “steam” was used to describe the cooking method for rice, instead of “boil,” and the word “fried” rather than “deep fried” was used to describe that for potato chips.
3D Images Better at Identifying Sauce Type
For the identification of the sauces added, the 3D images produced a somewhat better level of agreement than the 2D images. The percentage of agreement was the same for all of the food items, except for fish. The observers who referenced the 3D images unanimously agreed that soy sauce had been added to the fish, whereas 2 of the 10 observers were unable to correctly identify the sauce from the 2D images. This indicates that 3D images give a clearer visual presentation of the sauces added to food, thus allowing the better evaluation of such foods.
2D Images Provide Better Volume Estimations
The 3D food images were better at eliciting accurate estimations of the weight of fish and rice, when compared with their actual weights, whereas the 2D images yielded better results for choy sum and potato chips. There was no difference between the two types of images for Chinese soup or milk, and both yielded divergent volume estimations for oranges, chicken, and dumplings when compared with the gold standard. These results may be due to the observers' familiarity with Chinese soup and milk, which are usually served in standard sizes. Therefore, the observers may have had these predefined serving sizes in the mind, rather than truly estimating the food volume based on the images.
The estimations for rice and fish were better with the 3D images. This could be because these images provide a better all-round view of food items with these shapes. The estimations for choy sum, potato chips, and the breakfast set, in contrast, were better with the 2D images. These foods comprise many pieces stacked on top of one another, so even 3D images that are rotated to give an all-round view do not confer the ability to easily judge the size if overlaps cannot be seen. The better estimations elicited by the 2D images possibly stem from the scattering arrangement on the plate, whereas fish, milk, and Chinese soup have intact volumes. These results reject the hypothesis that 3D images allow better food volume estimation. In general, estimations using the 2D images were found to be more accurate.
2D Images Allow Better Oil Estimations
The 3D images allowed better estimation of the amount of oil added to Chinese soup and fish, whereas the 2D images exhibited superior performance for chicken and the breakfast set. The estimations of added oil for choy sum, potato chips, and dumplings were inaccurate whichever type of image was used. This suggests that nutritionists cannot accurately evaluate the amount of oil added to food even with the help of images.
Future Research
Although only 10 nutritionists were recruited to conduct food assessment through observation of 2D and 3D images, the high ICC results for both the 2D and the 3D assessments indicated that the number was sufficient in terms of reliability analysis. A possible area for further research is the selection of other food choices, as the accuracy of food assessment varied mainly with the food type.
Implications
The problem with current dietetic practice is that individualized nutritional advice cannot be provided efficiently, as the number of nutritionists in the community is limited. In contrast to the advances in telemedicine and e-health, dietetic services are lagging far behind. This study proves the feasibility of developing tele-dietetics to complete the loop of healthcare services, as depicted in Figure 1 . One of the valuable applications of tele-dietetics is glycemic control among diabetic patients. Patients are usually requested to eat properly, which includes making healthy food choices such as foods with less fat and salt and using healthy cooking methods such as baking, broiling, or grilling. Through tele-dietetics, diabetes management could be evaluated more frequently to avoid complications. Also, nutrient analysis of all dietary intake records could be stored for progress comparison. This would motivate patient participation in the self-management of diabetes, with the resulting benefit of better glycemic control.
Conclusions
The results confirm that 3D food images are similar to 2D images in facilitating food estimation. It is thus concluded that the latter can be used by nutritionists as dietary records to accurately and reliably evaluate food volume/weight, ingredients, cooking method, and sauce type, although not the amount of oil added. Therefore, the implementation of tele-dietetics is feasible.
Footnotes
Acknowledgments
The authors thank the Hong Kong Jockey Club Sports Medicine and Health Sciences Centre for its technical support.
Disclosure Statement
There was no conflict of interest and no funding support from any organization.