
Abstract
Teledermatology provides a partial solution to the problem of accessibility to dermatology services in underserved areas, yet methodologies to determine the locations and geographic dimensions of these areas and the locational efficiency of remote teledermatology sites have been found wanting. This article illustrates an innovative Geographic Information Systems approach using dermatologists' addresses, U.S. Census population data, and the Topologically Integrated Geographic Encoding and Referencing System. Travel-time–based service areas were calculated and mapped for each dermatologist in the state of Kentucky and for possible locations of several remote teledermatology sites. Populations within the current and possible remote service areas were determined. These populations and associated maps permit assessment of the locational efficiency of the current distribution of dermatologists, location of underserved areas, and the potential contribution of proposed hypothetical teledermatology sites. This approach is a valuable and practical tool for evaluating access to current distributions of dermatologists as well as planning for and implementing teledermatology.
Introduction
To date, methodologies to determine underserved areas and/or populations have been found insufficient and inaccurate. In this exercise, we focus on a fundamental component of accessibility, namely, travel time. More specifically, we present and demonstrate an innovative and objective Geographic Information Systems (GIS) approach for assessing the current distribution of dermatologists as well as determining and evaluating service areas of a hypothetical set of remote teledermatology sites. We map and calculate, respectively, (1) the current distribution of dermatologists and population within (arbitrarily selected 30- and 40-minute) travel-time service areas in Kentucky, 1 * (2) the distribution and number of people residing within these areas, and (3) service areas of four proposed remote teledermatology sites and populations within the travel-time–delimited service areas.
Background
Medical care accessibility has been and remains a difficult concept to define and measure as it includes economic, psychological, social, cultural, and geographic dimensions. 2,3 Among these, the latter is manifest as travel to available providers and extraordinary travel is central to the development, provision, and acceptance of telemedicine (including telehealth and e-health) clinical applications. Generally, dermatologists and associated telemedicine hub (central) sites are located in tertiary medical care centers and in larger urban centers. Remote telemedicine sites are often selected on the basis of physical distance from the centers and/or location within designated county, zip code, and other political or arbitrarily bounded health professional shortage areas, medically underserved areas, areas with medically underserved populations, or counties beyond metropolitan statistical areas and rural counties with some maximum population.
From their inception, numerous criticisms have been leveled against these designations and they have been found “lacking a conceptual core and unable to differentiate underservice from access or health status, and as being unable to identify truly needy areas adequately.” 4 –10 Counties in each of these “shortage” or “underserved” categories are often numerous, are geographically contiguous or noncontiguous, and cover large areas. 11 Additionally, these areas are arbitrarily constrained by fixed boundaries that may not and, in most instances, do not reflect potential and/or actual patient travel experience. Therefore, as currently designated, these “underserved areas” do not reflect actual or potential service areas of health providers and institutions.
In early 2008, the U.S. Department of Health and Human Services served notice of a proposed rule change that would “revise and consolidate the criteria and processes for designating medically underserved populations and health professional shortage areas, designations that are used in a wide variety of federal government programs. These revisions are intended to improve the way underserved areas and populations are designated, by incorporating up-to-date measures of health status and access barriers, eliminating inconsistencies and duplication of effort between the two existing processes.” 12 Still, the fixed geographic unit (county, census tract, and zip code) boundaries used in the proposed revisions render them less than optimal.
Further, experience indicates that even within these less than optimally designated areas, specific remote patient sites may be selected on the basis of one or more of the following criteria: perceived excessive travel distance from a hub, perceived need, willingness to cooperate, political expediency, or other subjective considerations that may result in a less than optimal patient site selection. An additional barrier to progress in measuring travel accessibility has been an overwhelming concern with affordability of care, to which the majority of attention and research resources have been directed. Also, the most popular measures of spatial accessibility to care—travel impedance to nearest provider and supply level within bordered areas—lose validity in congested urban areas. Hence, better measures are needed.
Need for Teledermatology
Research pertaining to teledermatology's capability to provide services to underserved populations can be traced to 1972 and is unsurpassed by any other specialty. 13 –15 Therefore, it is not surprising that teledermatology is among the most established applications of telemedicine. Although exceptions exist, 16,17 the vast majority of teledermatology studies report enhanced patient access to a wide spectrum of cost-effective dermatology care with decreased waiting time for consultation and surgery, acceptable levels of diagnostic reliability, high patient satisfaction, improved case management, and a reduction in unnecessary referrals and hospital visits, among others. 15,18 –24
The increasing need for teledermatology is well established, 25 –28 and research points to a long standing and continuing shortage and imbalance in the geographical location of dermatologists in the United States. 14,29,30 One established means of measuring demand and, thereby, availability of dermatology care is based on average appointment delay times. These times have been demonstrated to vary by location, but the overarching trend points to long delays averaging 1 month or more. 30 –32 A key implication of extended wait times is that patient concerns may encourage them to seek care from a nondermatologist physician. Yet, numerous comparative studies demonstrate the greater diagnostic accuracy, less overall cost of care, and improved outcome when care is delivered by dermatologists vis-à-vis general practitioners. 33 –38
Acknowledging the lack of a uniformly accepted and implemented definition of “rural,” the vast majority of dermatology practices are located within urban centers. This concentration has led to one estimate of 42% of the United States population residing in areas underserved by dermatologists. 18,31 With no foreseeable significant increase in the number of dermatology residency positions, the number of available dermatologists is unlikely to keep pace with demand for services. 31 Moreover, the current geographical imbalance in the distribution of dermatologists is unlikely to be altered.
In many instances the availability and, hence, “assumed” accessibility of physicians is reflected in physician-to-population ratios. However, this conventional measure is based on the assumption that medical care provision and consumption take place within a defined geographic area. This assumption is untenable because of patient and physician mobility. As correctly observed some time ago, “medical service areas in any healthcare system (original emphasis) allowing freedom of choice for patients are not discrete, self-contained units, they are (to a certain extent) probabilistic and interpenetrating.” 39,40 The simple population-to-physician ratio may provide inaccurate information because the physicians represented in the denominator of the ratio for a particular bounded geographic area typically serve more people than those counted in the numerator. In an early attempt to assess accessibility, for example, zip code areas formed the basis for determining an “appropriate geographic unit that is both analytically meaningful and readily applicable for distributional analysis of dermatologists.” 41 It should be mentioned here that an early study attempting to incorporate travel time was constrained by lack of appropriate data as well as the need to rely on distances measured to geographic centroids (centers) of zip codes. 40 In 2001, Suneja et al. 31 recommended that 3.3 dermatologists per 100,000 people in a geographically undefined and nonspecified draw area (authors' emphasis) would allow sufficient access to dermatologists. More importantly, they acknowledge that they were unable to assess the true magnitude of the population underserved. Although travel time, appointment delay time, and office waiting time were incorporated into a single index of accessibility to medical care, to date, despite advances in spatial accessibility measures, data limitations have precluded evaluating travel-time access of populations to existing specialist provider practice locations and accurately identifying and assessing potential patient populations' within a given travel-time access to remote telemedicine sites. 42,43
A GIS Approach
We demonstrate here a more accurate and informed measure of geographic accessibility by analyzing the service areas of dermatologists based upon selected travel-time intervals from specific office/clinic locations. Using GIS technology, for demonstration purposes we map service areas and determine the number of people residing within 30- and 40-minute travel times of each dermatologist in Kentucky. Concomitantly, we are able to map and determine the “at-risk population,” that is, the number of people living beyond these service areas. Based upon these initial assessments, as an experiment, we “place” teledermatology services in four towns that have small community hospitals. Subsequently, we map the service areas around each and determine the number of additional population “served” or potential population efficiency of the added remote sites.
The Study Setting
The Commonwealth of Kentucky has two major metropolitan areas (Louisville and Lexington) and a portion of a third Northern Kentucky, which is adjacent to Cincinnati, Ohio. (Fig. 1) These two metro government areas account for ∼1.5 million of the state's 4.1 million people. The other significant urban areas are located at the junctures of the major road networks. An estimated 1.8 million people live in “rural areas,” the majority of which are located in the eastern and south-central portions of the state. There are 137 rural clinics serving this population and 67 of Kentucky's 97 hospitals are located in rural areas (Rural Assistance Center 2009). 11

Kentucky population density and major road network. Color figure available online at
Kentucky's Dermatologists
In 2009, 56% of the Commonwealth's dermatologists (n = 122) were clustered in the two major metropolitan areas (Louisville = 44; Lexington = 24) containing its two largest medical centers and the remaining dispersed across some 22 communities (Fig. 2). Further geographic clustering is observed within the metro areas as 14 of Lexington's 24 dermatologists (58%) practice at multipractice locations of two or more; numbers range from two to seven. In Louisville, the clustering is greater as 35 of 44 dermatologists (80%) practice at multi-practice sites, ranging from 2 to 16 dermatologists at the same location. In northern Kentucky, all 14 dermatologists practice at multi-physician locations.
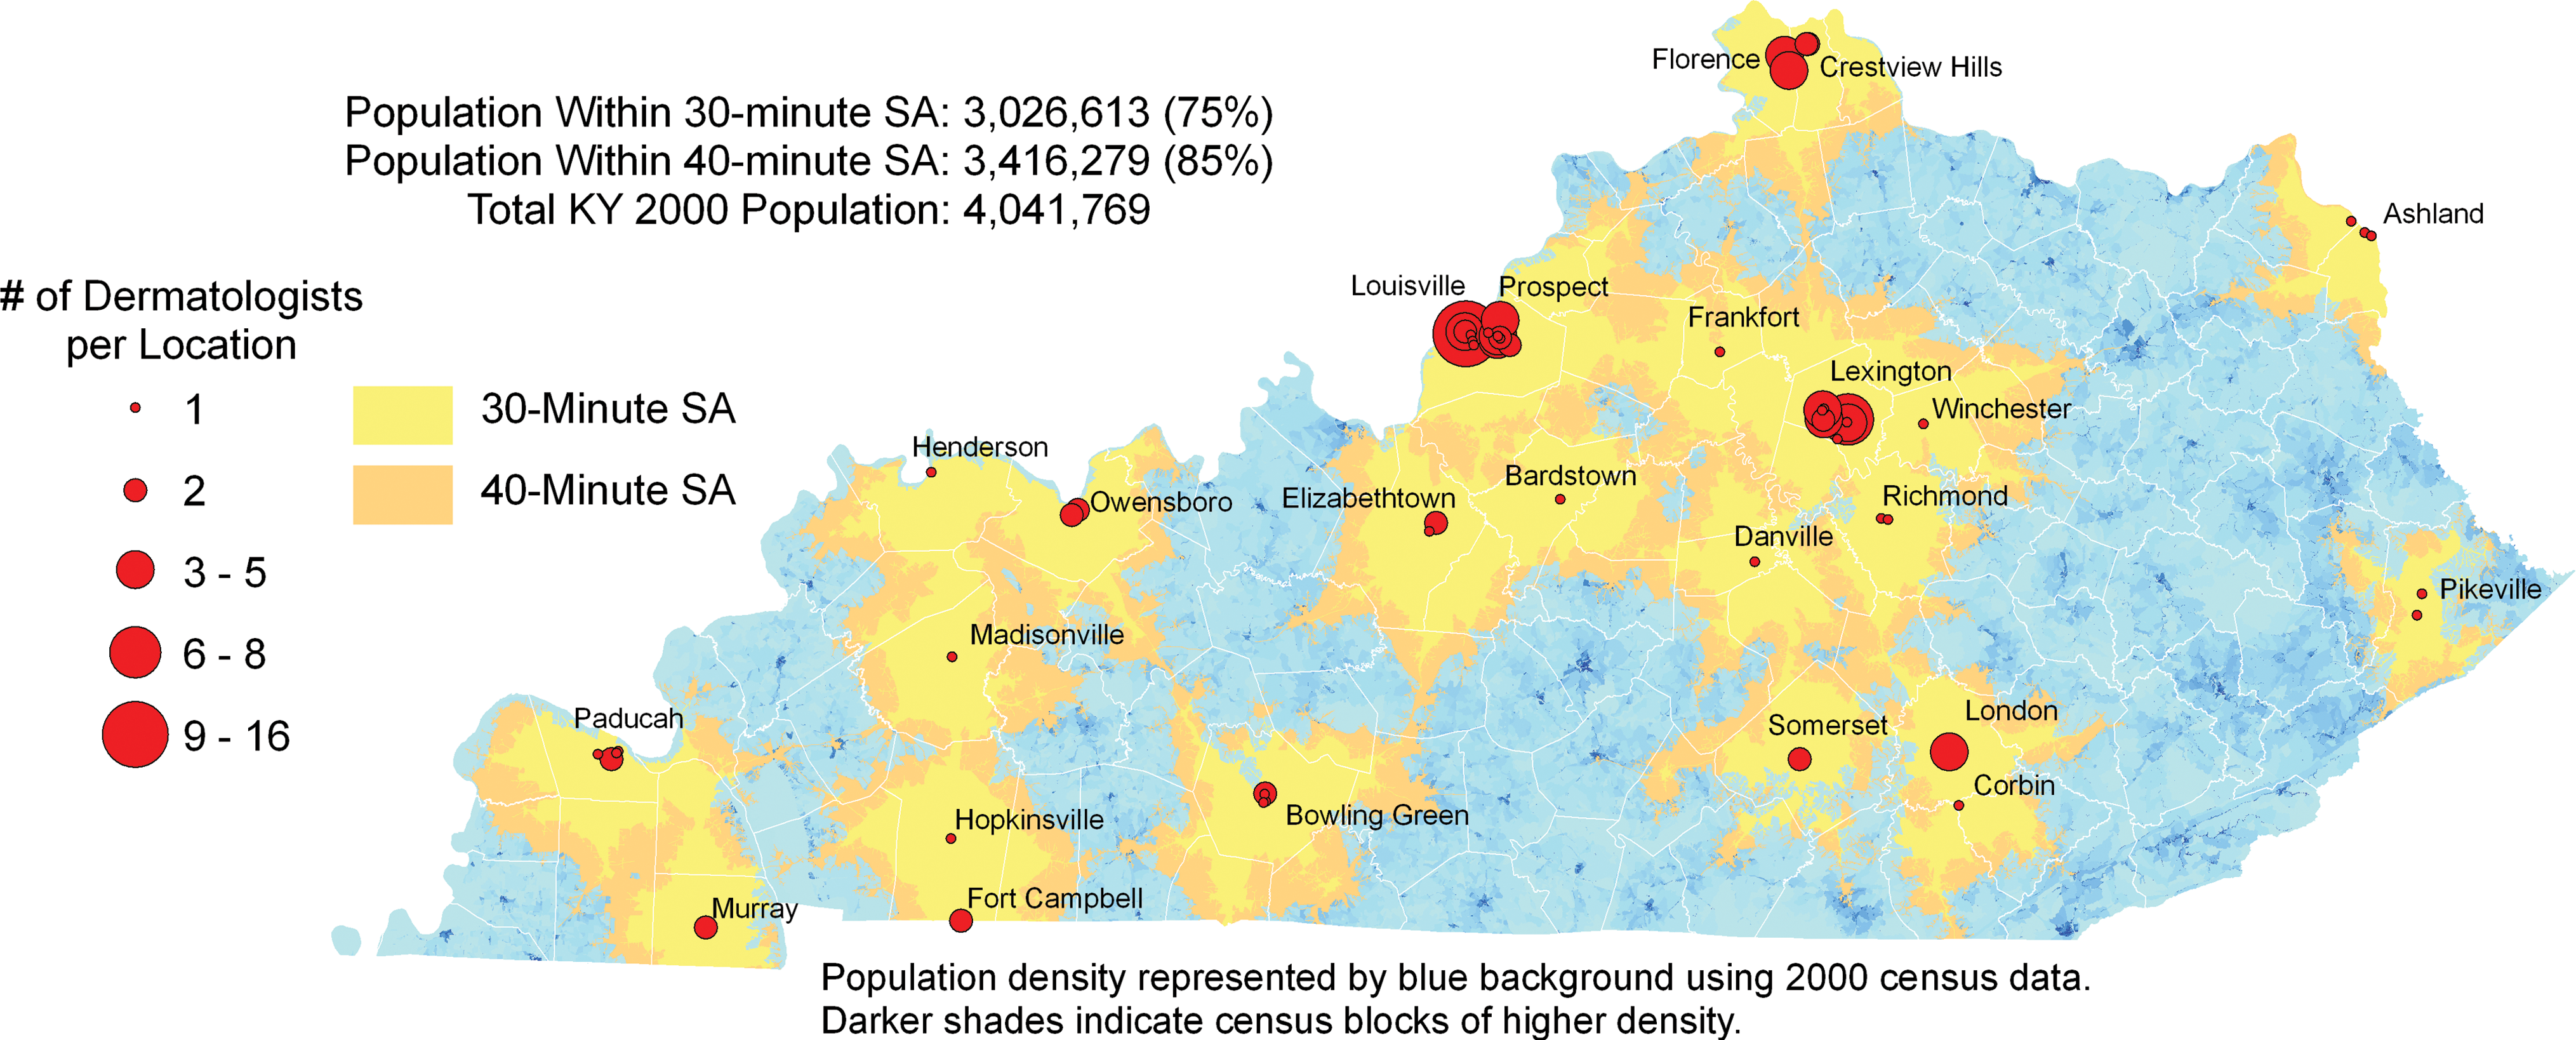
Dermatologists and 30/40-minute service areas. Color figure available online at
Methodology
Location data for practicing dermatologists in Kentucky were obtained from the American Academy of Dermatology (2009). 44 Road network travel-time data were calculated from the U.S. Census Bureau's Topologically Integrated Geographic Encoding and Referencing system. 1,45 Relevant block-level population data were obtained from the 2000 U.S. Census. 46, **
The road data used for this study are broken into individual segments in which each is an identified length of road—usually between two intersections in urban areas. For example, in an urban area roads are usually divided into one block lengths. Of course, road segments demarcated by intersecting rural roads and/or landmarks are longer in rural areas. Regardless, this data structure dictates that the travel routes created consist of complete road segments. Each road segment has a known length and associated speed limit that allow a straightforward calculation of travel time (distance/speed limit). Hence, we determined a travel-time attribute (measured in minutes) for each road segment in the Commonwealth.
In addition to length, the road data contain attributes describing the distribution of addresses along each segment. Thus, current practice locations of dermatologists as well as potential remote teledermatology site locations were identified using the road data. These address coordinates are calculated using geocoding, which enables the determination of coordinates for tables of addresses or an individual address. This is possible because each segment contains street addresses for the origin and termination of the street addresses on both sides of the segment. This allows relatively accurate location of an address within a specific segment. For example, assuming addresses on one side of the street begin with 101 and end at 199. Geocoding the address “151” places the address approximately halfway along the street.
The method of determining travel time used here does not take into consideration any delays due to traffic, weather, intersections, or any other impediments to travel. Generally, the longer the road segment or total trip distance, the less the impact of these types of travel barriers. These travel impediments would be expected to have greatest influence in urban areas and should be determined using local travel data where available. One method to account for this decreased rate of travel within an urban/metropolitan area is to incorporate an appropriate exponential coefficient for each road segment or set of road segments. However, at the metropolitan area scale as well as in rural settings, it can be assumed that intersection and other delays along any given road segment will be minimized vis-à-vis the total travel time for any significant travel distance.
After locating existing and potential dermatology provider locations, service area borders, or polygons, were created. These polygons represent the area that can be reached by road within specified travel-time limits, in this case 30 and 40 minutes, respectively. Travel times from a specific dermatologist practice location along all available routes to that location are calculated and the geographic point of the travel-time limit, again 30 or 40 minutes, is indicated along each route. These points are connected and areas within these boundaries are included in delineation of the travel-time service area. Subsequently, the polygons can be “visualized” against the background population data at the block level.
For the present study, we used the service areas' boundaries to select inclusive census blocks and determine the spatial distribution of the “at-risk” population, in this instance, simply the number of people residing in each block. 44 In addition to those census blocks wholly within the travel-time polygons, we also included those intersecting the service area travel-time boundaries. Therefore, any census block within or intersecting a service area boundary was included in the service area. The census blocks are sufficiently small in populations so that any block included adds a negligible population. 2, ***
Dermatology Service Areas
Thirty- and 40-minute service areas were determined and mapped for the current distribution of dermatologists in the Commonwealth (Fig. 2). The 30-minute service area is indicated by the unshaded area around each teledermatology site and the corresponding 40-minute service area is represented by the unshaded area together with the contiguous, darker “border” area. The number of dermatologists at each location is depicted by proportionate circles reflecting the multipractice locations in many cities as discussed earlier. Generally, populations located along the east–west interstate corridor between Louisville and Lexington and extending from each along major interstate arterials are within the 30- and 40-minute travel-time service areas of dermatologists currently practicing in the state. The corridor extending along the north–south axis from Ohio through Lexington to Tennessee, in particular, demonstrates the extension of travel-time service areas due to access to the interstate. Approximately 3 million people, 75% of the state's population, reside within 30 minutes of a dermatologist and nearly 3.5 million (85%) within 40 minutes (Table 1). On the one hand, this means that a sizeable majority of the population lives within “reasonable” traveling time of a dermatologist. On the other hand, however, over half a million of the state's residents live beyond these service areas. And, as illustrated, these “underserved” residents are clustered predominantly in the eastern and southeastern portions of the state as well as in the south-central region.
Populations Within 30/40-Minute Dermatologists' and Teledermatology Service Areas a
2000 Kentucky population.
Addition of Teledermatology Sites
For the purposes of this demonstration, we identified four communities in the “underserved” regions of the state to serve as the hypothetically proposed remote teledermatology sites. A second criterion for the selection of these communities was the presence of a community hospital, the address of which was used for calculating the hypothetical service areas. We then determined the 30- and 40-minute service areas around each and the populations within them (Fig. 3). Generally, the isolation of these communities from the major state arterial network and the increase in travel time due to dependence on secondary roads are reflected in the smaller size of the surrounding service areas. For those communities in eastern and southeastern regions of the state especially, the mountainous terrain increases travel time from point to point and their service areas are noticeably smaller even though measured by the same travel-time limits. The addition of four proposed teledermatology sites with 30-minute travel-time service area boundaries brings coverage to approximately an additional 180,000 people (5%) beyond those residing within the original 30-minute service areas described earlier (Table 1). The added populations range from 42,000 to just over 50,000. And, using 40-minute travel-time limits brings coverage to an additional 200,000 people (5%) beyond the number residing within similarly defined existing service areas. The additional populations included by using the 40-minute service area boundary range from just over 40,000 to over 58,000.

Dermatologists and remote teledermatology sites: 30/40-minute service areas. Color figure available online at
Summary
In the scenario presented here we have demonstrated the utility of a GIS approach for defining and assessing service areas for a current distribution of dermatologists as well as a hypothetical set of teledermatology sites in underserved areas. The population living beyond the 30- and 40-minute travel-time limits for dermatologists' service areas ranged from ∼1 to 1.5 million, respectively. The addition of four remote telemedicine sites increased the number of people within 30 and 40 minutes of a dermatologist's care by ∼180,000 and 200,000, respectively.
It should be mentioned that only one scenario was presented for demonstration purposes. When used for actual assessments and planning, a number of different scenarios may be tested. This approach allows for assessment of alternate and additional locations as well as other travel-time limits that may be deemed appropriate for any given area. In addition to the present demonstration, which focuses on “fixed,” remote teledermatology sites, “periodic” locations for remote, mobile telemedicine sites can also be evaluated using the same strategy. The approach can also be adapted to provide valuable insight into planning for comprehensive programs that include more than one telemedicine application as well as different at-risk populations. This flexibility permits development and assessment of alternate placement strategies in terms of number and location of remote sites to determine the most efficient distribution as measured by the greatest additional number of people included in the service areas. Using data on provider location, road network and rate of travel, and relevant population, a GIS approach for the assessment of the spatial-temporal efficiency of an existing provider distribution as well as that of any current or planned addition to a telemedicine network can be a valuable planning tool. We conclude that the approach demonstrated here, although not a panacea, can and should be a valuable and essential component for effective assessment of the current distribution of physicians as well as telemedicine site evaluation and planning.
Footnotes
Acknowledgment
We would like to acknowledge the invaluable assistance of Mr. Jeffrey Edward Levy, GIS Analyst, Department of Geography, University of Kentucky. We would also like to acknowledge the University of Kentucky Office of Research and Graduate Studies for providing financial assistance for this project.
Disclosure Statement
No competing financial interests exist.
*
p. 670 In this demonstration, the 30- and 40-minute travel-time limits, though arbitrary, are based in part on an earlier federal recommendation of travel time for primary care. In accordance with the objectives and goals of the National Health Services Planning and Development Act of 1974 (Public Law 93–641) and published in the Federal Register of 20 January 1978, it was stipulated that, in other than exceptional situations, a source of primary care should be available within 30-minute travel time. There were no stipulations regarding travel for specialty care. Of course, other “reasonable and appropriate” travel-time limits can be incorporated in this type of analysis.
**
p. 673 Census block data contain population attribute data as well as information such as income, education, and age grouping; any and/or all of which can be used to target specific at-risk populations for selected clinical applications.
***
p. 674 An alternate method of selecting census blocks is based on using the geometric center of each block to determine the service area travel-time limits. Once these centers are connected, this method will select and include for calculation only the census blocks that have a majority of the block within the service area.