
Abstract
Introduction
Personal healthcare records and e-health are gaining popularity and attracting academic, professional, and commercial interest worldwide. 1,2 The role and importance of interactive healthcare systems will increase in the coming years, which will be characterized by an increase in the number of elderly and a rise in chronic disease sufferers. 3 Interactive healthcare services promise to exert significant social, medical, and economic benefits, to improve the continuity of treatment, decrease healthcare expenses, enhance quality and efficiency of healthcare, and increase the fairness and equality of distribution of medical services, mostly for older populations and citizens of remote areas. 4 –7
Specifically, studies have shown that patients who are continuously taking care of their own clinical data, with the help of interactive health services, will improve the management and control of their chronic disease, promote earlier discharge from acute care settings, reduce the number of clinic visits, increase their satisfaction, and shift the care process toward more continuous collaborative relationships between patients and providers. 5 –9 Still, some reservations have been raised as to the benefits of interactive health communication systems and the clinical outcome for people with chronic diseases. 3,8,10,11
Although extensive effort is being aimed at developing the infrastructure and content for interactive healthcare records and its related services, much less attention has been directed to optimal patient-oriented interface design and methods of adapting specific visualization methods to designated tasks performed. 1,4,12
Our aim was to evaluate visualization methods for specific tasks performed with personal healthcare e-record systems for lay adults and older patients. We selected as a case study a system for self-management of coagulation status in patients with common medical conditions (e.g., heart rate disturbances, prolonged immobilization, or artificial heart valves) that require chronic anticoagulant treatment with warfarin derivatives (e.g., Coumadin) to prevent thrombosis. The dosage of the anticoagulant drug is closely evaluated by frequent blood tests (International Normalized Ratio [INR] test). The coagulation status must be maintained within a narrow therapeutic range by changes in the dosage of the drug. 13,14 An efficient computer-based self-monitoring system combined with currently available home devices for self-performance of INR blood tests, as well as educating the patients about drug dosage adjustment, could free the patients from the traditional tedious routine of frequent visits to the clinic for blood tests, retrieval of results, and consultations with care givers.
In our present study, we concentrated on the two main functions performed with patient-oriented systems: the entry of data and follow-up including retrieval of information (identifying parameters, recognizing irregular values and trends). Because of the aging of the global population and the increased prevalence of anticoagulant treatment with advancing age, our experiments compared young and older adults.
We used three sets of experimental parameters for evaluating the visualization methods: (1) functional parameters of task speed (total time, time per task completion, and relative time) and accuracy (errors), (2) subjective parameters of satisfaction and preferences derived from questionnaires and interviews, and (3) objective stress-related physiological parameters. Continuous monitoring of variations in heart rate, skin sweat (Galvanic skin response [GSR]), skin temperature, respiratory rate, and electromyography (EMG) served as measures of the participants' level of arousal and stress. 15
Methods
Participants
The study included 50 healthy volunteers from two age groups: older adults and young participants (72.2 ± 5.5 and 30.4 ± 4.9 years, respectively [mean ± SD]), with an almost identical number of men and women in each age group. All participants had previous experience with the Internet and computer applications.
Experimental Web Sites
Three experimental Web sites based on different visualization models were constructed. The three Web sites were similar in their level of complexity and range of colorfulness, but different in their visualization methods. The experimental Web sites were stored on the computers' hard disk to avoid Web interactions and communication failures. The Web sites were set up with hidden tracking programs, for following the participants' steps and navigation routes. A dedicated program produced snapshots of the computer screen at each mouse click, indicating the exact location of the cursor. Each Web site comprised two tasks: Insertion of personal and clinical information including date and hour of the INR test, participant's age and gender, INR values, number of Coumadin tablets taken, and side effects. Free Text, Menu, and Graphical Representations were used as visualization aids for data insertion (
Fig. 1
). Follow-up and retrieval of clinical information: Participants were asked to answer a set of questions related to the data displayed on the computer screen, representing the following three common clinical scenarios: Identification of a specific parameter by answering questions such as “What was the INR value on a certain date?” or “How many pills were taken on a particular date?” Recognition of irregular (exceptional) values by answering questions such as “What was the lowest INR value in the last month?” or “Have there been any exceptional INR values in the last week?” Trend recognition by answering questions such as “Have there been more side effects during weekends?” or “What was the trend seen in last week's INR values?”
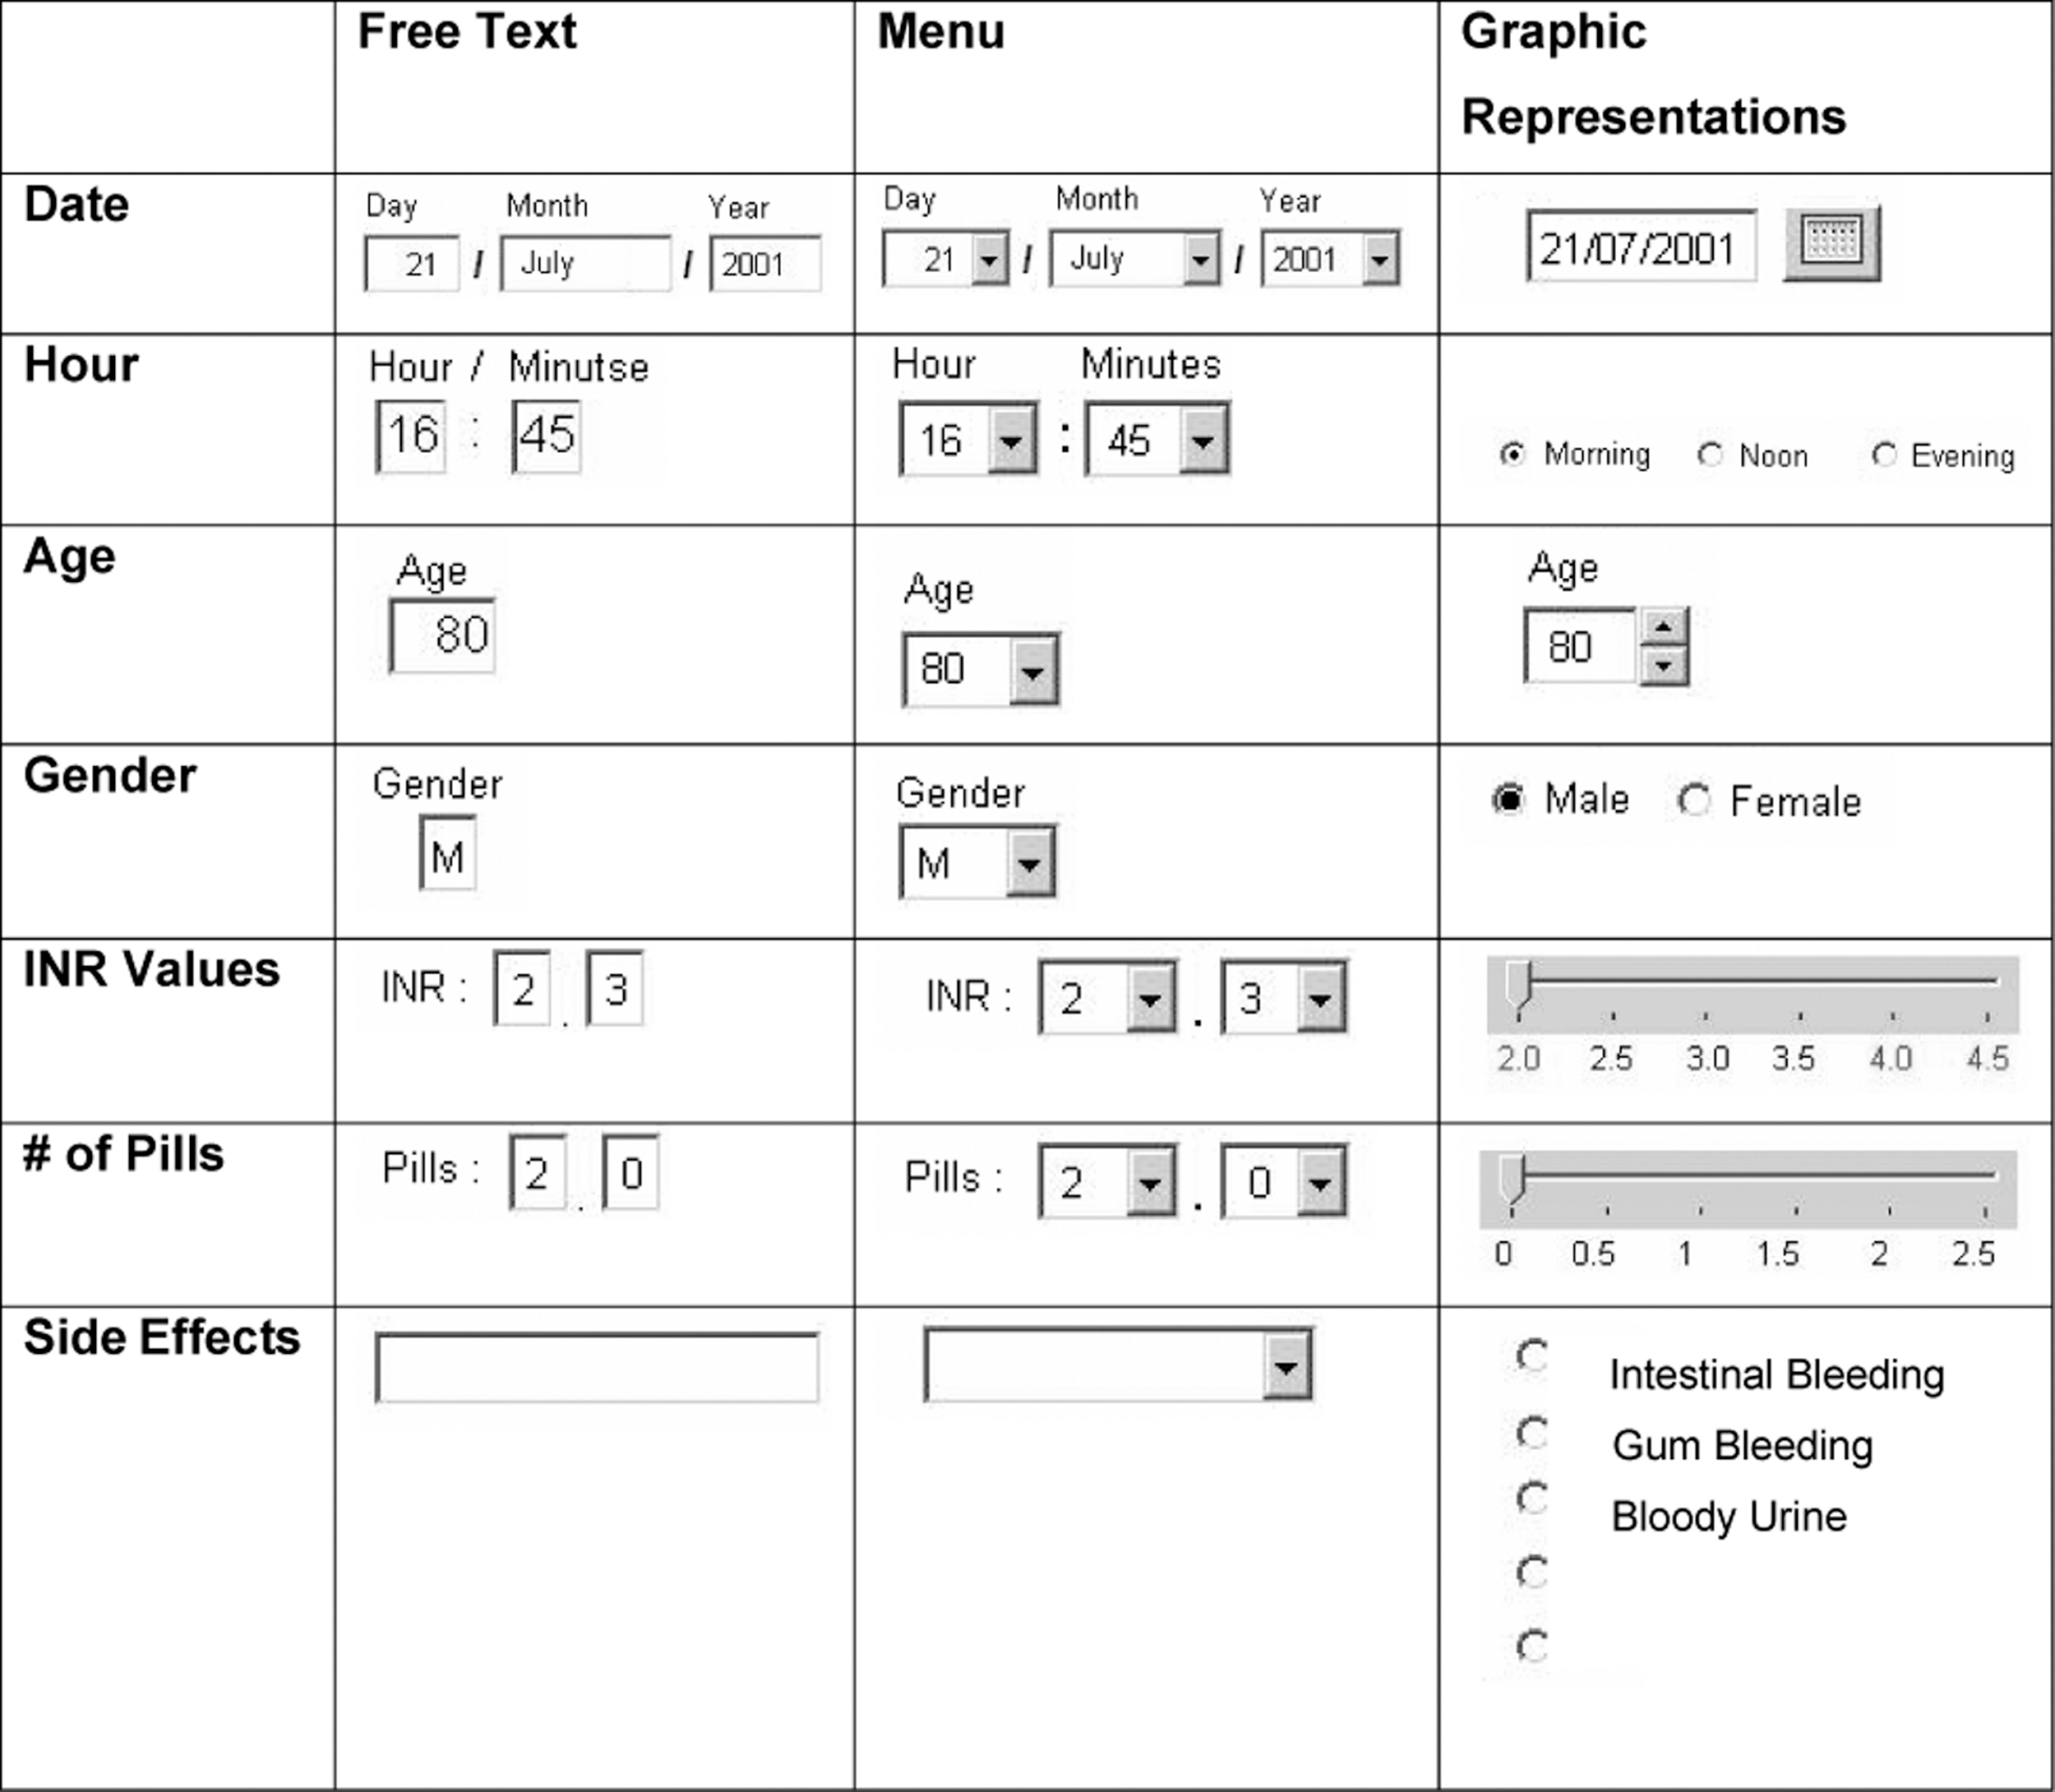
Visualization methods used for inserting personal and clinical information in the three experimental Web sites: Free Text, Menu, and Graphic Representations.
Table, Graph, and Calendar (combined graphical–numerical display) were used as visualization methods for follow-up and information retrieval ( Fig. 2 ). The participants had to move between daily, weekly, and monthly reports to find answers to the questions.
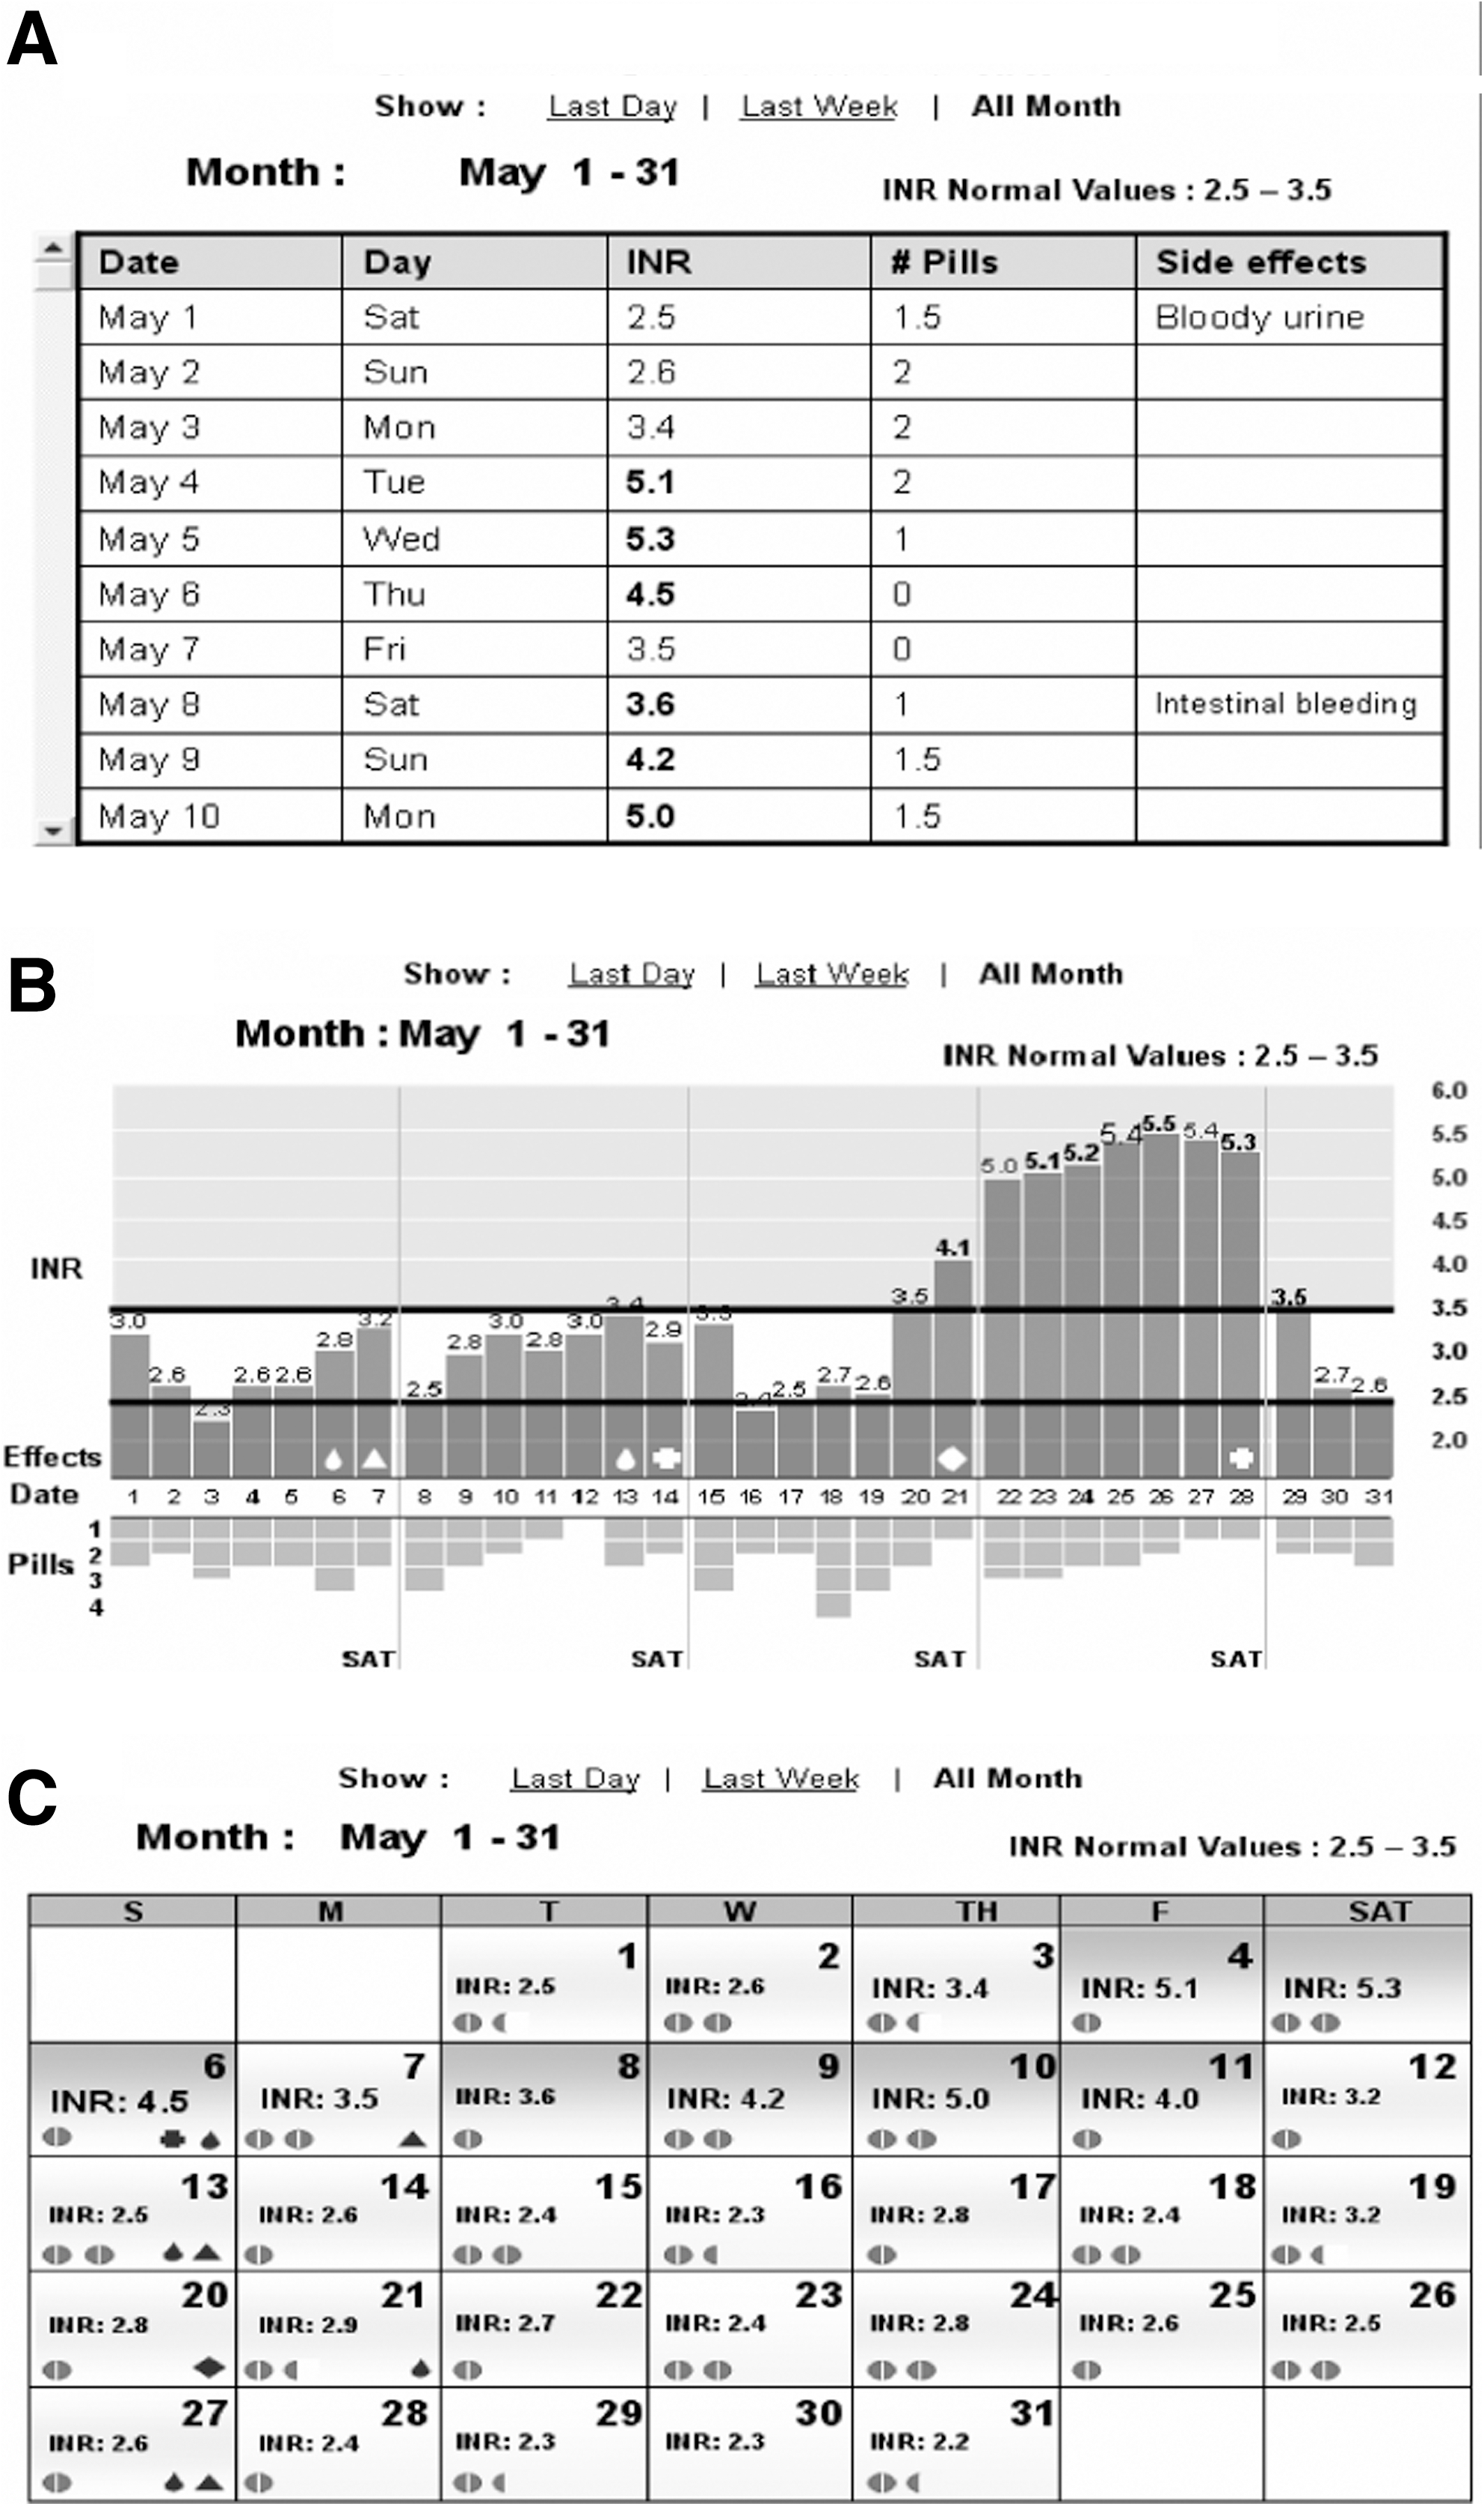
Snapshots of computer screens of the three experimental interfaces for follow-up and retrieval of clinical data: (
Experimental Parameters
Three categories of parameters were used for evaluating the different visualization methods: Functional parameters: Total time for tasks completion, relative time (time spent at each task divided by the total time), and accuracy (number of errors) were measured automatically from computer-hidden tracking programs and screen snapshots. Physiological parameters: Heart rate, skin sweat (GSR is inversely proportional to sweating), muscle tension (EMG), and skin temperature were monitored through miniature sensors attached to the fingers and wrist of the nondominant hand, and a strip placed on the thorax for recording respiration (AR7–Stress Management Monitor; Atlas Res. Ltd.). Subjective parameters: Preferences and satisfaction were derived from questionnaires and interviews completed at the end of each experiment, assisted by presenting snapshots of the different Web sites' screens to the participants to enhance recall of the different Web site configurations.
Experimental Procedure
Each participant observed a PowerPoint™ presentation with snapshots of the different experimental Web sites for guidance. Then miniature sensors were attached to participants' inactive hand and the chest for continuous recording of physiological parameters. Baseline physiological parameters were monitored at the beginning of each experiment while participants observed a pastoral picture on the computer screen for 60 s. All further physiological measures were compared with these data. First, participants inserted their real personal data (age, gender, date, hour) and fictional clinical information (INR, no. of pills, side effects), which was supplied on a piece of paper. Later, following a short break, participants were asked to find answers for questions that were presented on the lower part of the computer screen, by placing the cursor on the exact place showing the answer. The questions in the three Web sites were similar in structure and complexity but different in numeric values to avoid monotony or memorization. The three experimental Web sites were presented to the participants at random to avoid effects of fatigue or learning. The participants were not given time limits when performing the experiments.
Statistical Analysis
For descriptive statistics, continuous variables were expressed as mean ± SD, and categorical variables as percentages. The chi-square or Fisher's exact test was used for comparison of categorical values and t-tests were performed for normally distributed continuous data.
The different interfaces were compared within each age group and between the two age groups for each Web configuration. Comparison between Web sites was carried out using repeated measures ANOVA and an ad hoc Duncan test.
Comparison between age groups for each Web configuration was done by using unpaired t-tests. Pearson correlations were used to check the correlation among the physiological and functional variables. A p-value of <0.05 was considered significant.
Results
Insertion of Personal and Clinical Information
Functional parameters—time and accuracy
Total time for insertion of personal and clinical information was significantly different among Web sites (F = 7.6; p < 0.001). It was significantly longer in Graphical Representations compared with Free Text and Menu Web site in both age groups (p < 0.05, Duncan test; Fig. 3 ).

Time for insertion of information in the three experimental Web sites (mean ± SD); Free Text, Menu, and Graphical Representations by young and elderly participants. n = 25 in each age group. Arrow: p < 0.05 (Duncan test), comparison between experimental Web sites in each age group. Dotted line: p < 0.05 (t-test), comparison between age groups for each Web site.
Free Text was significantly slower for insertion of textual information (side effects and gender) and Graphical Representations for numerical data insertion (date, INR values, and number of pills) in both age groups.
The performance of older adults was significantly slower than the younger participants, in all Web sites (86.2 ± 31.8 vs. 34.8 ± 8.3, 91.1 ± 39.9 vs. 35.4 ± 8.2, and 98.7 ± 33.6 vs. 40.7 ± 9.3 s [mean ± SD] for Free Text, Menu, and Graphic Representation, respectively; p < 0.05, t-test).
Calculating the relative time (time for each task, out of overall time spent at the Web site) showed that older participants' were faster than young participants on several tasks: inserting in the Free Text display the number of pills (p < 0.0001; F = 25.77), age (p = 0.0004; F = 8.93), and INR (p = 0.022; F = 5.59) and inserting age (p = 0.01; F = 7.17) in the Graphical Representations display. Younger participants were faster only in inserting hour values in the Graphical Representations display (p = 0.0008; F = 12.69).
The number of errors in data insertion was not different among Web sites or between age groups. Yet, most errors, in both age groups, were in insertion of date in Graphical Representations, and side effects in Free Text display, with no mistakes measured with the Menu display.
Physiological parameters
Relative heart rate values increased significantly and GSR values decreased using the Free Text Web site compared with the Menu and Graphical Representations, in both age groups. Although no variations were found in relative values of skin temperature, EMG, and respiration rate, we have shown that heart rate significantly correlated with respiration (r = 0.0583; p = 0.05) and GSR (r = −0.1547; p < 0.0001), and GSR was correlated with temperature (r = −0.2223; p < 0.0001) and EMG (r = −0.071; p = 0.020).
Skin temperature was significantly correlated with EMG (r = 0.164; p < 0.0001) and respiration (r = 0.075; p = 0.015).
No differences were found in physiological parameters between the two age groups, in all Web configurations.
Subjective parameters
No significant differences were found in participants' preferences for Web site configurations within and between age groups.
Yet, more than 50% of the participants of both age groups claimed specifically that Graphical Representations was the most comfortable configuration for the insertion of date (using a calendar configuration) and for the insertion of side effects (using radio buttons), whereas Free Text was uncomfortable for inserting side effects.
Follow-up and Retrieval of Clinical Data
Functional parameters—time and accuracy
The overall time for completing the tasks related to follow-up and retrieval of clinical data was not statistically different among the three Web sites, for both age groups. However, we found significant differences in functional parameters between specific scenario-based tasks (
Fig. 4
): Time for task completion in the three experimental Web sites in the two age groups. T, table; G, graph; C, calendar; y, young participants; o, older adults. n = 25 in each age group. Data are presented by box plot display. Dotted line: p < 0.05 (t-test), comparison between age groups for each Web site. *p < 0.05 (Duncan test), comparison between experimental Web sites in each age group. Graph configuration was slowest for identification of a specific value and Table the fastest (p < 0.05, Duncan test), in both age groups. Table was slowest for recognition of irregular (exceptional) values and Graph the fastest (p < 0.05, Duncan test), in both age groups. The time for tasks of trend recognition was not different between Table, Graph, and Calendar in each of the age groups.
Overall time for completing all tasks related to follow-up and retrieval of clinical data was statistically different between age groups (F = 64.07; p < 0.0001), and elderly were significantly slower in all Web sites (260.1 ± 92.1 vs. 113 ± 23.1, 248.7 ± 95 vs. 107.4, and 248.8 ± 130 vs. 104.8 ± 29.5 s [mean ± SD] for Table, Graph, and Calendar, respectively; p < 0. 005, t-test).
A significantly highest number of errors were in the Graph configuration in identifying a specific parameter and the lowest in recognition of irregular (exceptional) values compared with Table and Calendar, in both age groups. No significant differences were in errors among Web sites in trend configuration in both age groups.
There were no significant differences in number of errors between the two age groups.
Physiological parameters
GSR values declined in the Table display relative to Graph and Calendar (p < 0.05, Duncan test), in both age groups. No significant differences were found in physiological parameters between age groups in all Web configurations.
Subjective parameters
The Table was ranked as the least preferred configuration, especially for identifying a specific value and recognition of a trend (e.g., side effects on weekends) by 50% and more participants in both age groups.
The Graph was ranked as the easiest configuration for recognition of irregular (exceptional) values and recognition of a trend by more than 85% of participants in both age groups.
No significant differences were found in participants' preferences for Web site configurations between young and elderly participants.
Discussion
Our study investigated common visualization methods for data entry and follow-up and retrieval of clinical data for self-control of blood coagulation in/by young and older adults using functional, subjective, and physiological experimental parameters.
Insertion of Personal and Clinical Information
A Menu display was significantly the preferred configuration and the Graphical Representations was the worst configuration for data entry (especially for insertion of numerical data) in both age groups.
The Free Text Web site was significantly better than the Graphical Representations (but similar to the Menu display Web site) in terms of total time for task completion and the slowest for the insertion of textual data. Yet, the significant increase in heart rate and sweat activity measured in younger and older participants, point toward increased level of stress using this interface.
Therefore, based on our data we suggest using Menu configuration for insertion of personal and clinical data by younger and older people. The Menu display elicited the best performance for insertion of numerical and textual data (whereas the other two configurations were specific for either numeric or textual values), did not generate any errors, and showed no physiological indications of stress.
Specifically, we recommend utilizing radio buttons (which were specified as comfortable for the insertion of side effects) and avoid using slider for inserting numerical values (e.g., INR and number of pills).
Follow-up and Retrieval of Clinical Data
The three visualization methods we used—Table, Graph, and Calendar—were not significantly different in overall functional and subjective criteria, thus implying that, by and large, they were similar in their complexity and familiarity to our participants. However, the significant increase in skin sweat (inverse to GSR) using the Table hints at some level of stress or increased awareness despite similarity in performance and preferences.
Our findings confirm previous findings that visualization methods should be adapted to the task and no single type of presentation is best for all tasks and every condition. 16,17 In this regard, the Table was the significantly best visual presentation for identification of a specific value and the worst for recognition of irregular values, whereas the Graph was the best for recognition of irregular values and worst for identification of a specific value. The Calendar configuration was not significantly different from the two other visualization methods in functional measures (time and errors), subjective criteria, and physiological indicators. On the basis of our data, we suggest using the Calendar display in Web sites that contain a mixture of tasks such as recognition, identification, and trends as a meet halfway choice instead of using the Table or Graph, which are task specific.
Methodologies in Software Evaluation
The need for having objective experimental parameters was our impetus for applying physiological measures of autonomic responses to stress, in addition to functional parameters of time and errors together with subjective criteria of satisfaction and preferences commonly used in software usability studies. It was previously shown that satisfaction and preferences do not always reflect the qualifications of best performance in computer applications, as stated by Andre and Wickens: “users may want what's not best for them.” 18 This dissociation between performance and preference was also demonstrated in our study when the Calendar display (in Graphic Representative Web site) was the preferred interface for inserting date despite lengthy time and a high number of errors, and the Table was the fastest yet the least preferred configuration by the two age groups, for identifying a specific value.
Using multiple stress-related physiological measures may help to understand and solve the existing discrepancy between functionality and preference. Yet, the use of physiological methods for evaluation of software design is not developed enough 15,19 and warrants further improvements in methodology concerning the effects of environmental and personal variations, analytical clarification in defining the changes, and above all, the interpretation of the results. Different mental events such as workload, surprise, frustration, or other mental experiences can produce near-identical physiological responses, or rather a variety of reactions in different people. 15,19
We have found significant variations in relative values of heart rate and skin sweat (expressed by a decrease in GSR) between Web sites, but no changes in skin temperature, EMG, and respiration rate. However, our findings have shown significant correlations between heart rate and sweat activity and the unchanged physiological parameters, suggesting that, by and large, all measures might be useful in more stressful situations (our experimental Web sites were built according to common ergonomics guidelines, with special concern to their adaptability to older adults).
Age Differences in Computer Applications
The most remarkable findings for us was the lack of differences in stress level between younger and older participants while performing interactive computer interfaces, and similarity in accuracy (errors) and in subjective criteria of satisfaction and preferences, apart from slower performance of the latter.
Studies on the adaptability of the Internet and computer applications to older populations (design for all, age-friendly design) have undergone great conceptual changes in the last 2 decades. Years ago the focus was mostly on overcoming technophobia—the fear and anxiety of older people when using technology in general and computers in particular. Today, older adults are both interested and experienced in interacting with new technologies and computer applications, 4,20 taking active part in the information communication and technology society. Older persons, generally, show a slowing down in performance, resulting from decline in perception, cognition, and motor abilities. 21,22 However, there are indications that older people read Web pages more carefully than younger users and certain aspects of cognition are maintained or even enhanced by age, helping older people to develop strategies to compensate for their general decline. 3,23
Our study supports these findings and is in line with previous work showing slower yet accurate performance of elderly. 24,25 Further, calculating the relative time spent by participants at each Web site revealed that for most tasks there were no significant differences between the age groups, and in several tasks the older were even significantly faster than younger participants. 26
However, we suggest avoiding features that require delicate motor performance, or continuous strokes such as a vertical scrollbar and horizontal sliders.
Limitations of the Study and Further Research
Our study examined only some common and familiar graphical configurations. Obviously, more forms should be checked, including the use of different colors (we kept colors constant in all Web configurations), verbal and audio display, 5 and dynamic, changeable, interactive, and multidimensional forms of data presentation. 27
Our experimental Web sites were simple and not congested for simplifying the participants' task, although real Personal Healthcare Records may be much more complicated and overloaded. Further, we followed only the functions of data insertion and the follow-up and information retrieval, which were separated in time, for methodological reasons. In real life, functions of operating healthcare record are mixed and interrelated, affecting each other, including interactions and conflicts that might appear while performing applications together and moving between different mental models. Further studies are needed to evaluate the tradeoffs when moving between different display configurations and the danger of applying a negative transfer while changing users' mental models.
Our participants were healthy volunteers to avoid negative effects of previous patients' experience and isolate the effects of Web design and of age per se. Later on, it will be essential to check Web site configurations with real patients, taking into consideration their specific needs and constrains. 6 Constrains such as motor dysfunction (e.g., Parkinson disease, essential tremor, arthritis), visual impairment (e.g., diabetes retinopathy, cataract), loss of tactile sensation (e.g., diabetes neuropathy), cognitive impairment (e.g., dementia), auditory decay (presbycusis), and side effects of medications might be of significant importance for the design of Personal Healthcare Record.
Outcome measures such as improvement in clinical, psychological, or economic status, measures of the level of control of coagulation function, the number of clinic visits, evaluation of quality of life, or follow-up of patient's satisfaction should be an integrated component in the assessment of Web site configurations at the final stages of its commercialization.
Conclusions
Our study supports the use of stress-related physiological measures together with functional and subjective methods as experimental tools for the design of computerized interfaces of Personal Healthcare Record. We believe that our results demonstrating equal capabilities of young and older adult participants (apart from slower performance of the later) will encourage the use of interactive computer systems for management of chronic diseases such as coagulation functions. Similar methodology could be applied for developing scenarios and tasks for management of other chronic diseases.
Footnotes
Acknowledgments
This research was supported by Technion V.P.R. Fund–M. Smernoff Gerontology Research Fund. This research was part of the thesis conducted by Eyal Lerner in fulfilment of the requirements for M.Sc. degree in Industrial Design.
Disclosure Statement
No competing financial interests exist.