
Abstract
This study shows the creation of a graphical representation after the application of a questionnaire to evaluate the indicative factors of a sustainable telemedicine and telehealth center in São Paulo, Brazil. We categorized the factors into seven domain areas: institutional, functional, economic-financial, renewal, academic-scientific, partnerships, and social welfare, which were plotted into a graphical representation. The developed graph was shown to be useful when used in the same institution over a long period and complemented with secondary information from publications, archives, and administrative documents to support the numerical indicators. Its use may contribute toward monitoring the factors that define telemedicine and telehealth center sustainability. When systematically applied, it may also be useful for identifying the specific characteristics of the telemedicine and telehealth center, to support its organizational development.
Introduction
Telemedicine is considered in this article in general terms to be “medicine practiced at a distance,” and as such, it encompasses diagnosis and treatment, along with medical education. 1 Although telemedicine has been extensively expanded in developed countries in Europe, in the United States and Canada, 2 and in others, such as Brazil, it is still only just getting started. Lack of knowledge about telemedicine, the high costs of technologies, and lack of Internet access, among other possible reasons, made it something that was far from Brazilian daily realities until the end of the 1980s. In the 1990s, a small number of isolated initiatives were undertaken, but over the last few years, there have been some governmental efforts to improve this scenario by allocating around US$15 million to public universities and hospitals. 3,4 Currently, Brazil has a pilot telehealth project for primary care in which nine universities are participating, with the prospect of installing 900 remote points within telehealth systems, 5 along with certain other initiatives.
It has been reported that “ … organizational problems are crucial for the future of telemedicine, but have been gravely underestimated.” 6 Thus, there is a need to develop instruments that help telemedicine center (TMC) coordinators to monitor the performance of their centers and to conduct organizational development.
Objective
The main objectives were to describe the development of a questionnaire focused on sustainability of TMC and telehealth center, its application to one of the nine universities in the aforementioned pilot project, and to show the results in a graphical representation model.
Methods
To reach the objectives of this study, questions regarding factors determining TMC sustainability were elaborated based on several theoretical sources of information on telemedicine issues, together with general business management concepts. In particular, concepts from balanced scorecards (BSCs), 7,8 innovation management, 9 and the researchers' professional experience were taken into account. The questions were organized into seven categories of determining factors (Table 1). These categorized questions were then submitted to four Brazilian professionals with experience in telemedicine for evaluation, because of the small number of professionals available to do statistical validation of the questions. In this study, the final categories of factors were presented: institutional, partnerships, functional, economic-financial, renewal, academic-scientific, and social welfare. These were all part of the semistructured question script that was to be applied by the same interviewer as an instrument for conducting individual interviews with the coordinator of the Telemedicine and Telehealth Center of Science of Medicine School of University of São Paulo (USP TMC).
Definitions for Categories of Indicating Factors
TMC, telemedicine center.
The methodological approach chosen for this study was qualitative because of its exploratory and descriptive nature. 10 The TMC focused in this article has been in existence for 10 years, and it was possible to apply the instrument in relation to several years. Thus, the coordinator of this center was asked 36 questions regarding the factors that had been previously defined. For each question, the coordinator had to evaluate the performance of USP TMC in relation to the years 1998, 2000, 2002, 2004, 2006, and 2008, based on the following scoring options: “3” if the factor/criterion was applicable to the case and the TMC fully met the criterion, “2” if the factor/criterion was applicable but the TMC partially met the criterion, “1” if the factor/criterion was applicable but the TMC did not meet the criterion, and “0” if the factor/criterion was not applicable. Some of these questions can be seen in Table 2, as examples.
Examples of Questions Asked During the Interviews
Scoring definitions: 0, factor/criterion not applicable; 1, factor/criterion applicable but not met; 2, factor/criterion applicable but partially met; 3, factor/criterion applicable and fully met.
Twelve months later, based on the same scoring options and the same script, a second interview was conducted to evaluate the 2008 performance of this TMC once again.
All the responses were converted into numbers and from numbers into graphs. To complete the monitoring of this center, some other secondary information covering the period of evaluation was registered and compared with the numerical indicators.
Results and Discussion
The responses were converted into numbers and from numbers into a graph in the form of a polygon (Fig. 1). At the time of the research, without any “standard parameters” to be achieved, it was not possible to make any comparisons between this center and others, but a comparison was made between the data collected in the first interview 1998–2008a (Table 3) and the data collected in the second interview 2008b (Table 4). The purpose of the graph was to make it easier to view the results achieved in all categories in a single figure, thereby helping the coordinator in charge to see things according to category and the center's overall situation. At the same time, this would help the coordinator to discuss strategies with the center team, along with the relationships between the results, and to determine whether any changes should be planned.
Data Collected at the First Interview: Telemedicine and Telehealth Center of Science of Medicine School of University of São Paulo, 1998–2008a
Data Collected at the Second Interview: Telemedicine and Telehealth Center of Science of Medicine School of University of São Paulo, 2008b
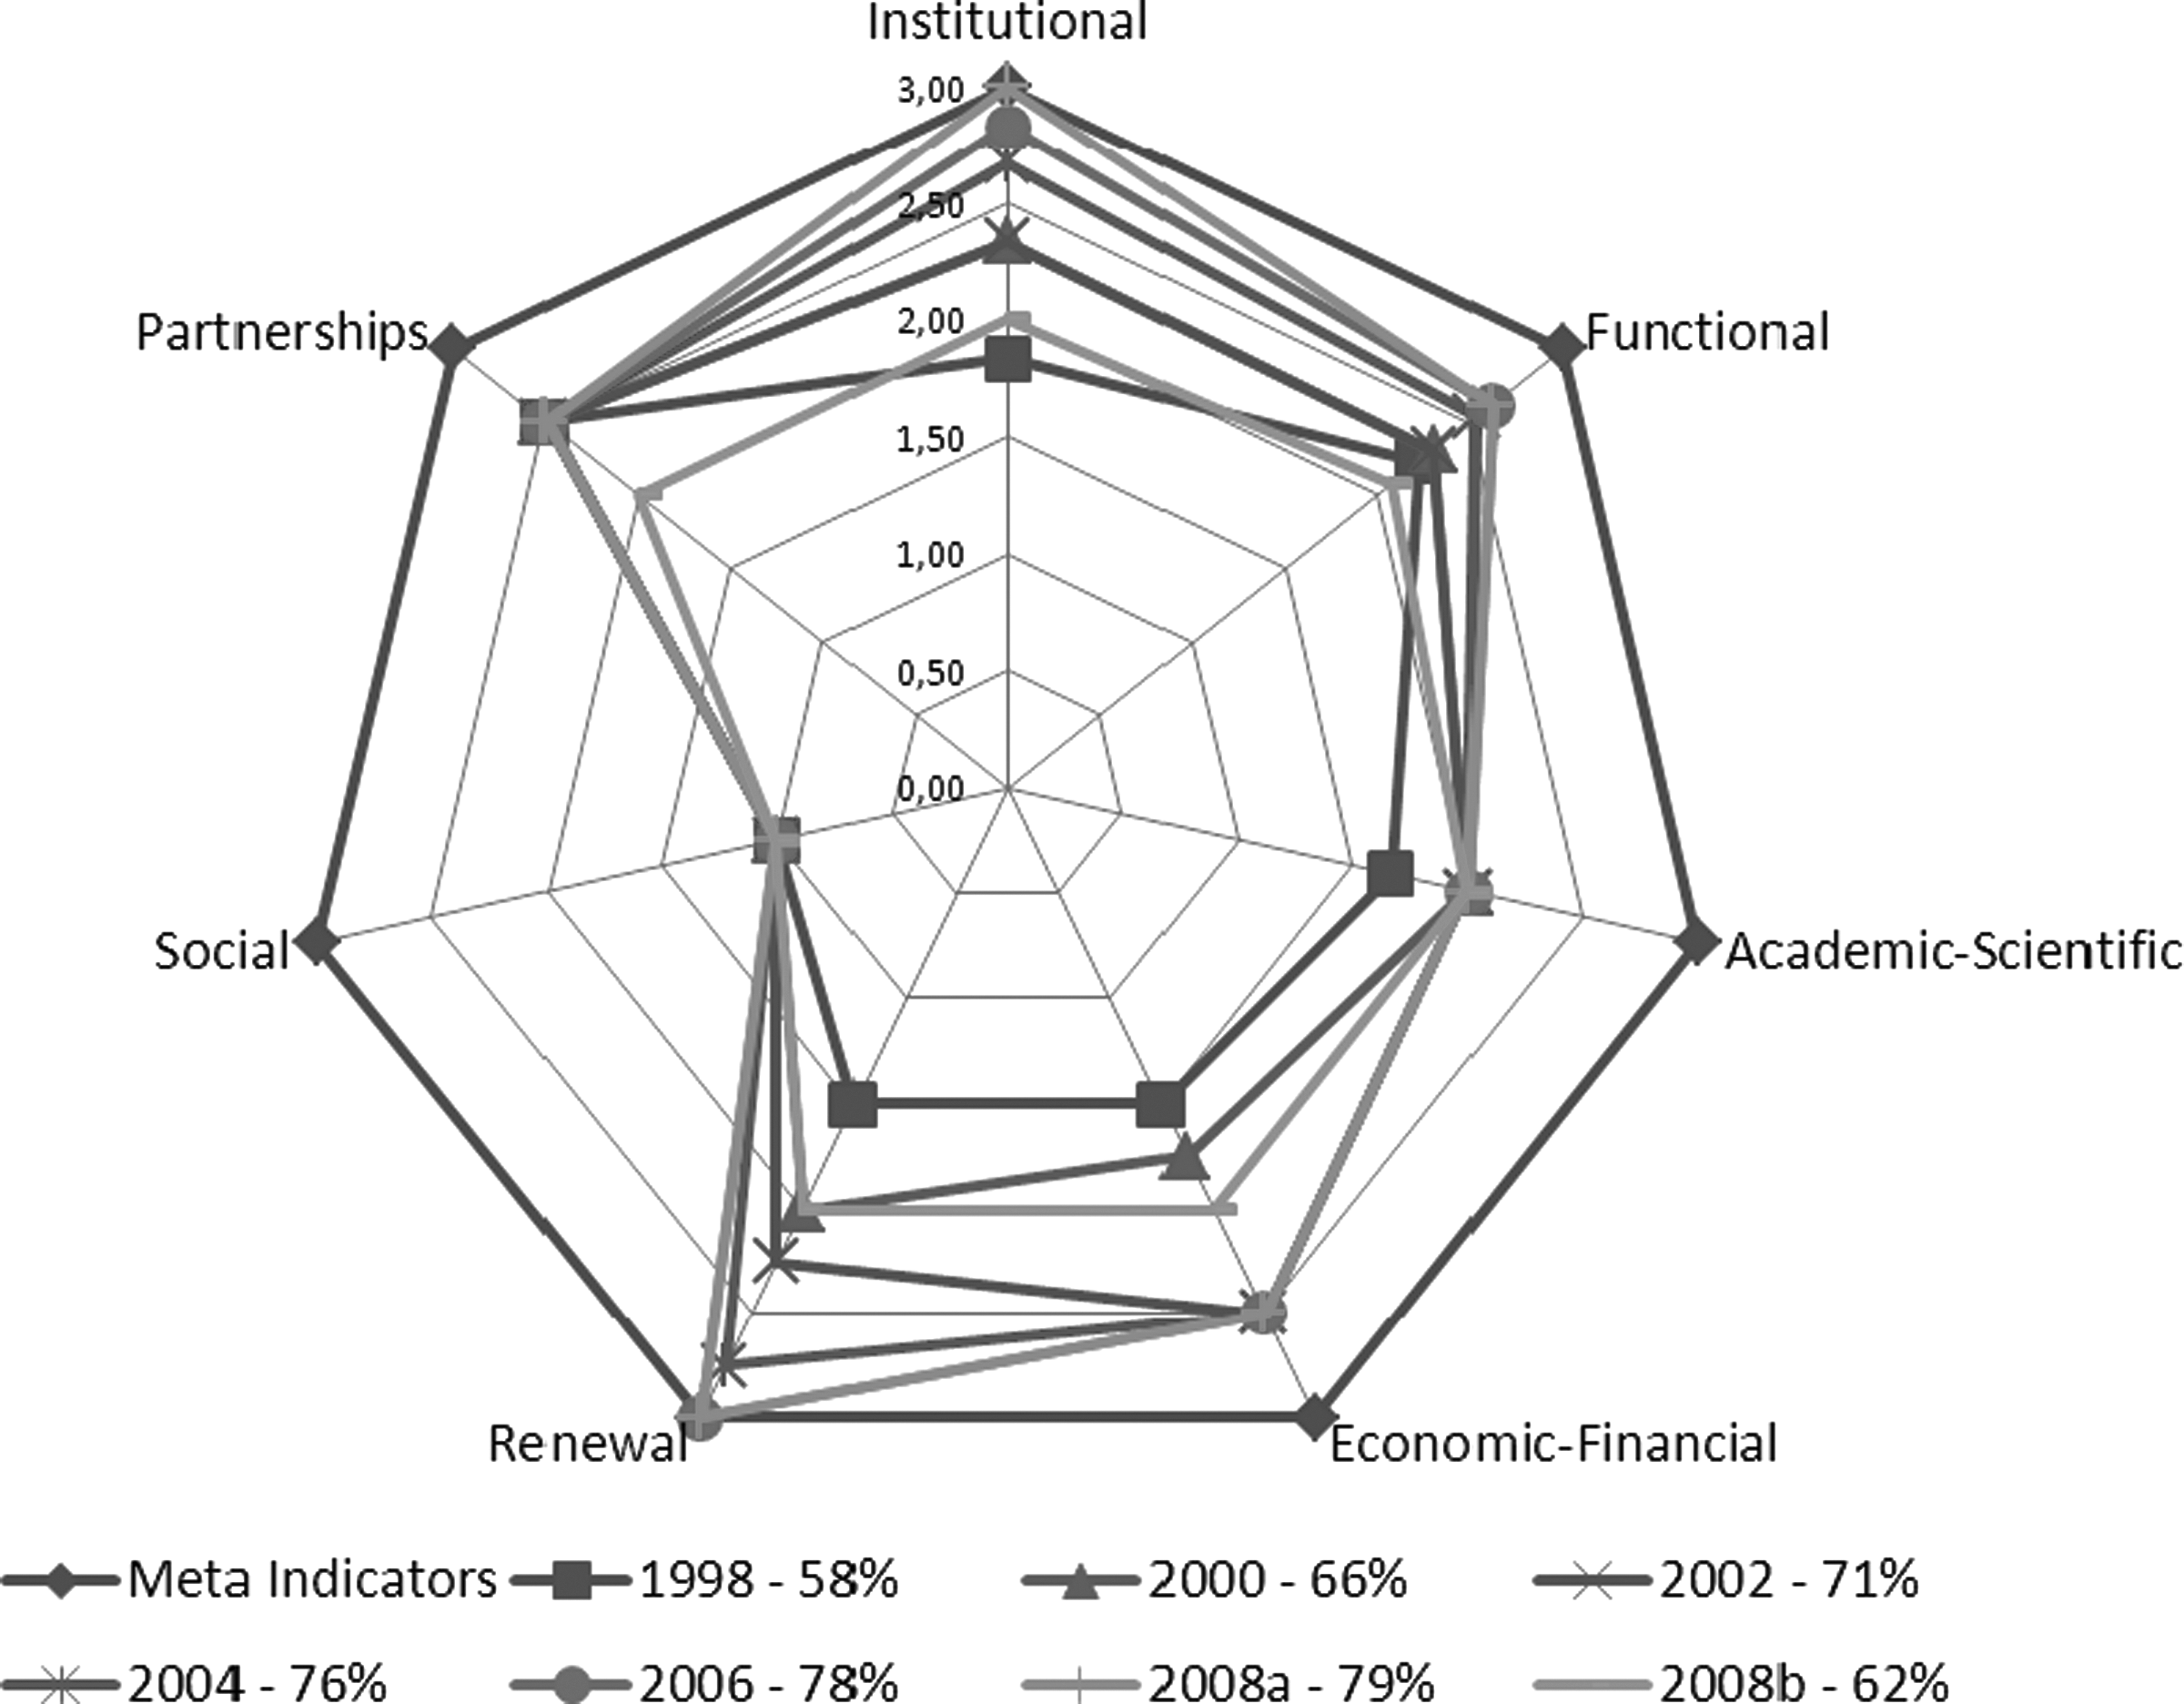
Global 10-year performance evaluation of the Telemedicine and Telehealth Center of Science of Medicine School of University of São Paulo—1998–2008a/b.
The 10-year picture format and areas were compared, and an evolutionary trend was noticed. To complete the monitoring of the 10-year center, the secondary information over the evaluation period was registered. This demonstrated correlation with the numerical sustainability indicators that had been found. Because the retrospective evaluations of 1998, 2000, 2002, 2004, 2006, and 2008 were done all at the same time, it is possible that the performance evaluations were influenced by experience and were updated. This is one possible explanation for the evolutionary coherence noticed in the figures up to 2008a. The change in the indicators allowed the inference that rechecking at a different time might be important for ensuring that subjective evaluations would be more compatible with the reality. It should be noted that the investigator asked the coordinator to base his responses on the data available and not just on his opinion. It is possible that an evaluation made by a group of people involved in the planning, management, and implementation of activities, instead of only one person, would generate better balanced scores. For the present study, this suggested procedure would not have been possible, because of the historical moment on the investigated center. Nevertheless, the methodology was useful for checking the past facts, but it may also be useful for scheduling the present and future. When used to evaluate the present moment, it was clear that a second evaluation at a later time was necessary, to avoid misinterpretation (adjustment factor). When systematically applied, it may also be of use for identifying the specific characteristics of the TMC, to support its organizational management.
It should be noted that all the categories should be dynamically balanced. As suggested by Kaplan and Norton, 7,8 “a balanced scorecard is about measures that drive performance, because the balanced includes financial measures with operational measures on customer satisfaction, internal processes, and the organisation's innovation and improvement activities—measures that are the drivers of future financial performance.” 7,8 Although we used the BSC idea of multiperspective measurement, we did not follow the “four performance-driving measures” mentioned by them. In fact, we adapted the BSC concept by establishing different categories and putting them into a graphical representation, to allow the TMC executives to view performance in several areas simultaneously. This approach to TMC management is innovative, especially because most of the coordinators in Brazil do not have any background in management or administration, but most usually in medicine. By combining institutional, functional, economic-financial, renewal, academic-scientific, partnerships, and social dimensions, the proposed model helps the public to see their interrelationships. This may help not only to monitor the center performance but also to make decisions regarding necessary internal trade-offs between the categories.
We see telemedicine as a process of innovation. Tidd et al. 9 stated “innovation management is a process of planning, allocation, organisation and coordination of critical factors to achieve innovative results.” Managing a TMC is similar to this because innovation does not consist only of opening new markets. It also means a new way of doing things and delivering products and services or even new paradigms for organizational mind models. On the other hand, the same authors advised that innovation has a second dimension: the level of innovation. There may be innovation at the component level or at the “system” level. Innovations may also be incremental or radical.
In fact, telemedicine can be seen as innovative with regard to all these types or levels, depending on the service or set of services that is run at a center. Nevertheless, it is an innovation process that has to be managed with organization and creativity. The success of the innovation depends on the capacity to mobilize and use the knowledge of “components” and also on the combination of components, that is, the so-called “architecture of innovation.” Detection and management of critical process components are, therefore, crucial for making telemedicine architecture more productive.
In this respect, we confirmed the importance of monitoring the center not only in terms of the picture format in the graph but also in terms of the area occupied by the graph that is associated with the implementation phase. This set of information interconnects the historical context of the center with its sustainability indicators. It could be inferred that the greater the area occupied by the graph, the higher will be the sustainability indication. In this, sustainability was taken to be the capacity to keep things going over the course of time while giving balanced attention to the different aspects of the center.
In other words, if the proposed model is used periodically over a period of time, it can be taken to be an indication of the sustainability trend of the center. This indication can be monitored according to each category of determining factors (polygon format) and also according to the area occupied by the polygon.
Conclusions
This study showed that it was possible to develop a model to observe all categories of sustainability of a center in one same graphical representation. The mentioned methodology was useful for monitoring the results of different aspects of the center activities, especially when used in the same institution for a long period of time, complemented with information from secondary sources, such as publications, sites, and documents to support the numerical indicators. When used to evaluate the present moment, it was clear that a second evaluation on a subsequent occasion was necessary, to avoid misinterpretation (adjustment factor). When systematically applied, it may be useful for identifying the specific characteristics of the center to support its organizational management. Last, but not least, because of the complexity of this topic, this study opens a whole new avenue of research into sustainability management and evaluation to the USP TMC.
Footnotes
Disclosure Statement
No competing financial interests exist.