
Abstract
Introduction
Telecare is the term used to describe the use of technology along with local clinical protocols to monitor remotely a patient's medical condition in their own home. 1 The advantages are that telecare provides cost benefits, improves the quality of life, and alleviates the problems of increasing medical expenses, demand for healthcare and accessibility to healthcare, and others. 2 –8 Hence, telecare will become a trend in the 21st century. 9,10
Telecare has been raised as a potential solution for many years without broad acceptance. 11 The equipment is perceived as not “user friendly” and bulky. 12 Further, evidence of benefit is unclear and there remains a need for robust studies before telecare can be recommended for widespread implementation. Koch and Hägglund 13 also show that health informatics in elderly care is an expanding field of interest, but we still do lack knowledge about the elderly person's needs of technology and how it should best be designed.
On the other hand, most of previous studies used simple statistical methods or regression-based multivariate analysis, all of which are linear models. Few studies were carried out using nonlinear structural models (such as the nonlinear neural network model). Thus, the purpose of this study was to utilize the adoption model of telecare established by the back-propagation network (BPN) method. It is important to make professionals aware of the need of medical statistics knowledge to better evaluate new technologies, particularly in health technologies assessment agencies.
Technology Acceptance Model
Although research on technology acceptance has considerably developed in the area of information systems, the number of studies on technology acceptance model (TAM) in the field of healthcare, particularly in medical informatics, is rather limited. As a result, the development of TAM will be considered from an aspect of providing greater empirical healthcare. 6,14 –18
TAM 19,20 is primarily comprised of five constructs—perceived ease of use (PEOU), perceived usefulness (PU), attitude toward using (ATT), behavioral intention to use (BI), and actual system use. PU is defined as “the degree to which a person believes that using a particular system would enhance his or her job performance” and PEOU as “the degree to which a person believes that using a particular system would be free from effort.” Of these, PU and PEOU are the most important factors required for accepting new information technologies; further, PEOU affects PU and ATT affects BI directly. 19
Telecare has been listed as a development design for newly emerging service industries for 2008 in Taiwan, although still in its infancy in Taiwan, and there are very few users who subscribe to this form of healthcare. As a result, BI rather than the actual usage is a better indicator of actual needs. Besides, Ajzen 21 proposed the theory of planned behavior. He regarded that BI is a prerequisite for action and that only the ATT cannot directly predict behavior. In contrast, only BI enables accurate predictions. 21 –23 Hence, the research structure underlying this study is shown in Figure 1.

Research structure. PEOU, perceived ease of use; PU, perceived usefulness; ATT, attitude toward using; BI, behavioral intention to use.
Based on the theory of reasoned action by Fishbein and Ajzen,
24
it is believed that if the attitude of individuals toward behavior is more positive, their BI will be relatively stronger.
24,25
Further, assumptions 1–3 are obtained from relevant studies
19,20,24,26
based on TAM and theory of reasoned action. H1: An individual's ATT and BI with respect to telecare are found to be positively associated. H2a: PEOU has a direct effect on the ATT of telecare. H2b: PEOU has a direct effect on PU. H3: The stronger the PU of telecare, the stronger will be the ATT of telecare.
Back-Propagation Network
An artificial neural network (ANN) utilizes a large number of simple connected artificial neurons to imitate the capabilities of a biological neural network. It can be seen as a legitimate part of statistics that fits snugly in the niche between parametric and nonparametric methods. 27 ANN has been widely used to examine the complex relationship between input and output variables. 28 Of the various ANN models, the BPN is the simplest model and the easiest to understand. Hence, it is the most commonly used model at present. 29 The term “back propagation” (BP) indicates that the error correction signal/search direction goes backward from the output layer to the input layer. 30,31 The basic principle is that the sum of squared errors (the errors are the differences between the desired target values and the computed neural network outputs) is minimized by an iterative error correction mechanism that adjusts the weights between the neural network nodes until a stopping criterion is successfully reached. 30,32
Materials and Methods
Data Collection
This study used face-to-face interview to collect senior citizens aged over 60 years who lived in a village in Taiwan. A total of 295 valid copies of a questionnaire were obtained, with men accounting for 57% of the respondents. Most of them belonged to age groups of 60–69 (amounting to 58%). In terms of the educational level, 49% of the subjects had completed primary schools, and the average monthly income ranged between NT$20,000 and NT$50,000 (amounting to 71%) (US$1 ≈ NT$31.61).
Measures of the Constructs
This study is based on the definition as well as on the constructs related to TAM. 19,20 It includes four constructs: PEOU, PU, ATT, and BI. The operationalization and sources of measurement items in this study are shown in Table 1. All evaluation items employ a five-point Likert-type scale for measurement, wherein 1, 2, 3, 4, and 5 indicate “strongly disagree,” “disagree,” “fair,” “agree,” and “strongly agree,” respectively.
Reliability and Validity Results
PEOU, perceived ease of use; PU, perceived usefulness; ATT, attitude toward using; BI, behavioral intention to use.
Reliability and Validity Analysis
The internal consistency was assessed using Cronbach's alpha (Table 1). The alpha coefficients (ranging from 0.6 to 0.9) of all the four constructs were higher than the benchmark of 0.6, as suggested by Bagozzi and Yi. 33 This demonstrated high internal consistency and, thereby, the reliability of each construct. As the content and viewpoints of the questionnaires for the facets of this study have referred to the viewpoints from related researches (refer to Table 1), the items of the questionnaires have included the facets of measurements. Therefore, the questionnaires of this study have considerable content validity.
Data Analysis Methods
Research framework of the ANN
The Feed Forward Neural Network has a general architecture, 34 as shown in Figure 2. The development procedure of ANN can be divided into two processes: learning process and recalling process. A large number of examples are required in both processes as the input data, for the ANN operation to complete at each process. During the learning process, the errors of trained examples with targets are used to adjust the weights of ANN by various efficient learning algorithms. The weights are updated after processing all examples. The final weights are adjusted to meet the minimization of errors we desired. Then, the trained weights are stored in the network after learning is completed.

Feed-forward neural network with n inputs and p outputs.
In the second process, testing examples are used to verify the validity of the network. Further, neural network is utilized in a case study to infer the results.
This study adopted three ANN frameworks that use a single hidden layer. They are shown in Figures 3 –5. BPN was used to adjust the network connection weights. The parameters of three ANNs are summarized in Tables 2 –4. In Figure 3, PEOU and PU are input layers, and ATT is the output layer. In Figure 4, PEOU is the input layer, and PU is the output layer. In Figure 5, ATT is the input layer, and BI is the output layer.
Parameters for Artificial Neural Network Research Framework Diagram (A)
Parameters for Artificial Neural Network Research Framework Diagram (B)
Parameters for Artificial Neural Network Research Framework Diagram (C)

ANN research framework diagram (A). ANN, artificial neural network.
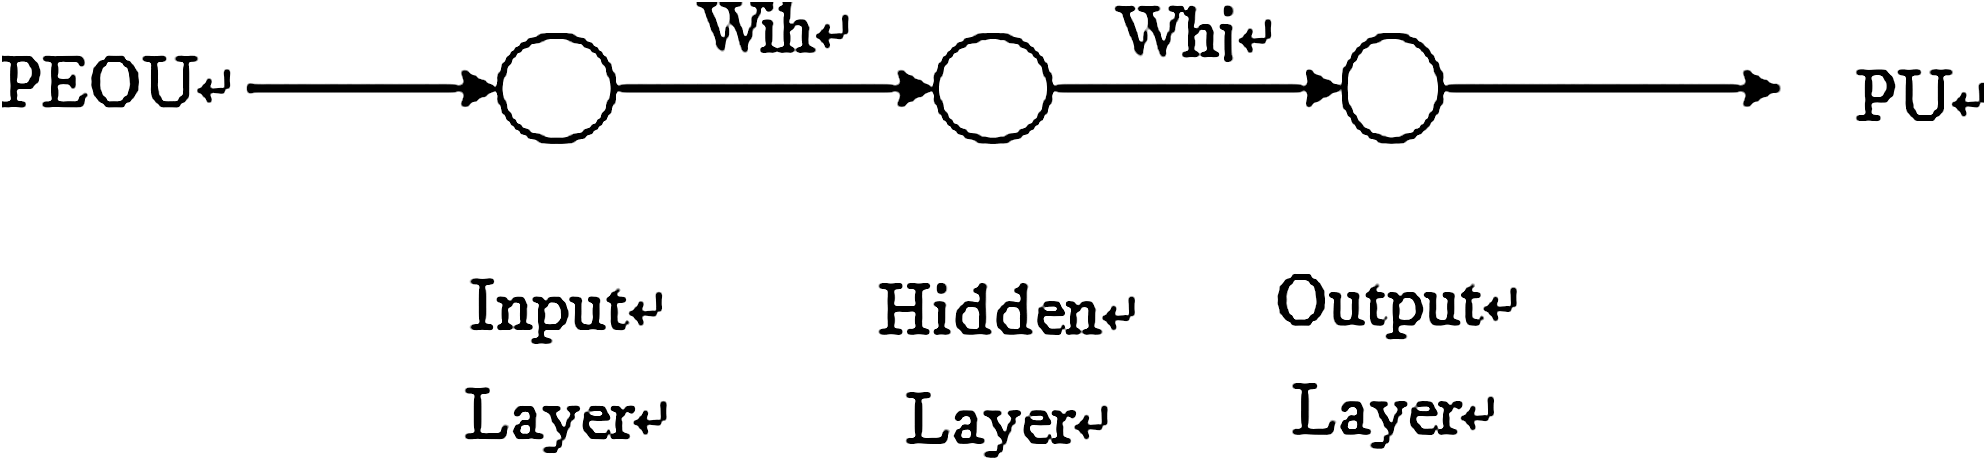
ANN research framework diagram (B).

ANN research framework diagram (C).
Data analysis steps
In this study, we constructed, performed training on, and tested the ANN model with Matlab Neural Network Toolbox. Step 1: Normalize all data into [0, 1], including PEOU and PU. Step 2: The trained algorithm of the Levenberg-Marquardt backpropagation
35
is used to adjust the weight with mean square error. Step 3: Randomly choose the initial weights. Step 4: Proceed with the ANN model training; 2/3 of the total samples (197 samples) are chosen as training examples. Each training session for all 197 data is deemed as an epoch. Parameters are updated during this period to obtain the optimal ANN models. Step 5: The final optimal ANN model is acquired after completing the training. Tests (a) and (b) are employed to examine the stability and reliability of ANN; tests (c) and (d) are employed to estimate the effect of individual input variables on output variables. (a) Input the 197 samples, which have been used in training, to obtain the 197 estimated output values. The errors between the estimated and raw data are shown in Figure 6. The statistical result of errors, including mean, standard deviation (SD), and root of mean square (RMS), is shown in Table 5. (b) Input the remaining 1/3 of the samples (98 samples), which have not been used in training, to obtain the 98 estimated output values. The errors between the estimated and raw data are shown in Figure 6. The statistical result of errors, including mean, SD, and RMS, is shown in Table 5. (c) Take the dependence of ATT on PEOU as an example; the correlation with ATT could be obtained by setting PEOU to 1 and other input variables to zero. Thus, the test vector of input is [1 0 0 0 0]. Similarly, the correlation between all input variables and output variables could be acquired (Table 5). (d) Besides test (c), there is another approach to identify the effect of one input variable on output variables, and it is performed by fixing other input variables to zero. Thus, continuous discrete input is used with one input variable increasing from 0 to 1 at 0.01 steps. Similarly, the correlation between all input and output variables could be acquired. The results are presented in Figures 7
–9. Therefore, the dependence of all output variables on input variables can be identified.
Results
Analysis Results of the Artificial Neural Network Model
Table 5 shows the dependence of ATT on PEOU and PU. The error mean (SD) and RMS for the training examples are 0.1415 (0.0790) and 0.1620, respectively; the error mean (SD) and RMS for the testing examples are 0.1439 (0.0806) and 0.1645, respectively. As to the dependence of PEOU on PU, the error mean (SD) and RMS for the training examples are 0.1263 (0.0879) and 0.1538, respectively; the error mean (SD) and RMS for the testing examples are 0.1192 (0.0850) and 0.1459, respectively. As to the dependence of ATT on BI, the error mean (SD) and RMS for the training examples are 0.1035 (0.0962) and 0.1411, respectively; the error mean (SD) and RMS for the testing examples are 0.0475 (0.0438) and 0.0643, respectively. As shown, the errors are acceptable. Further, it could also be inferred from Figure 6 that the errors for the training and testing examples in the ANN research framework diagrams (A), (B), and (C) are acceptable. Also, it means that the model of ANN constructed in this study is stable and reliable.
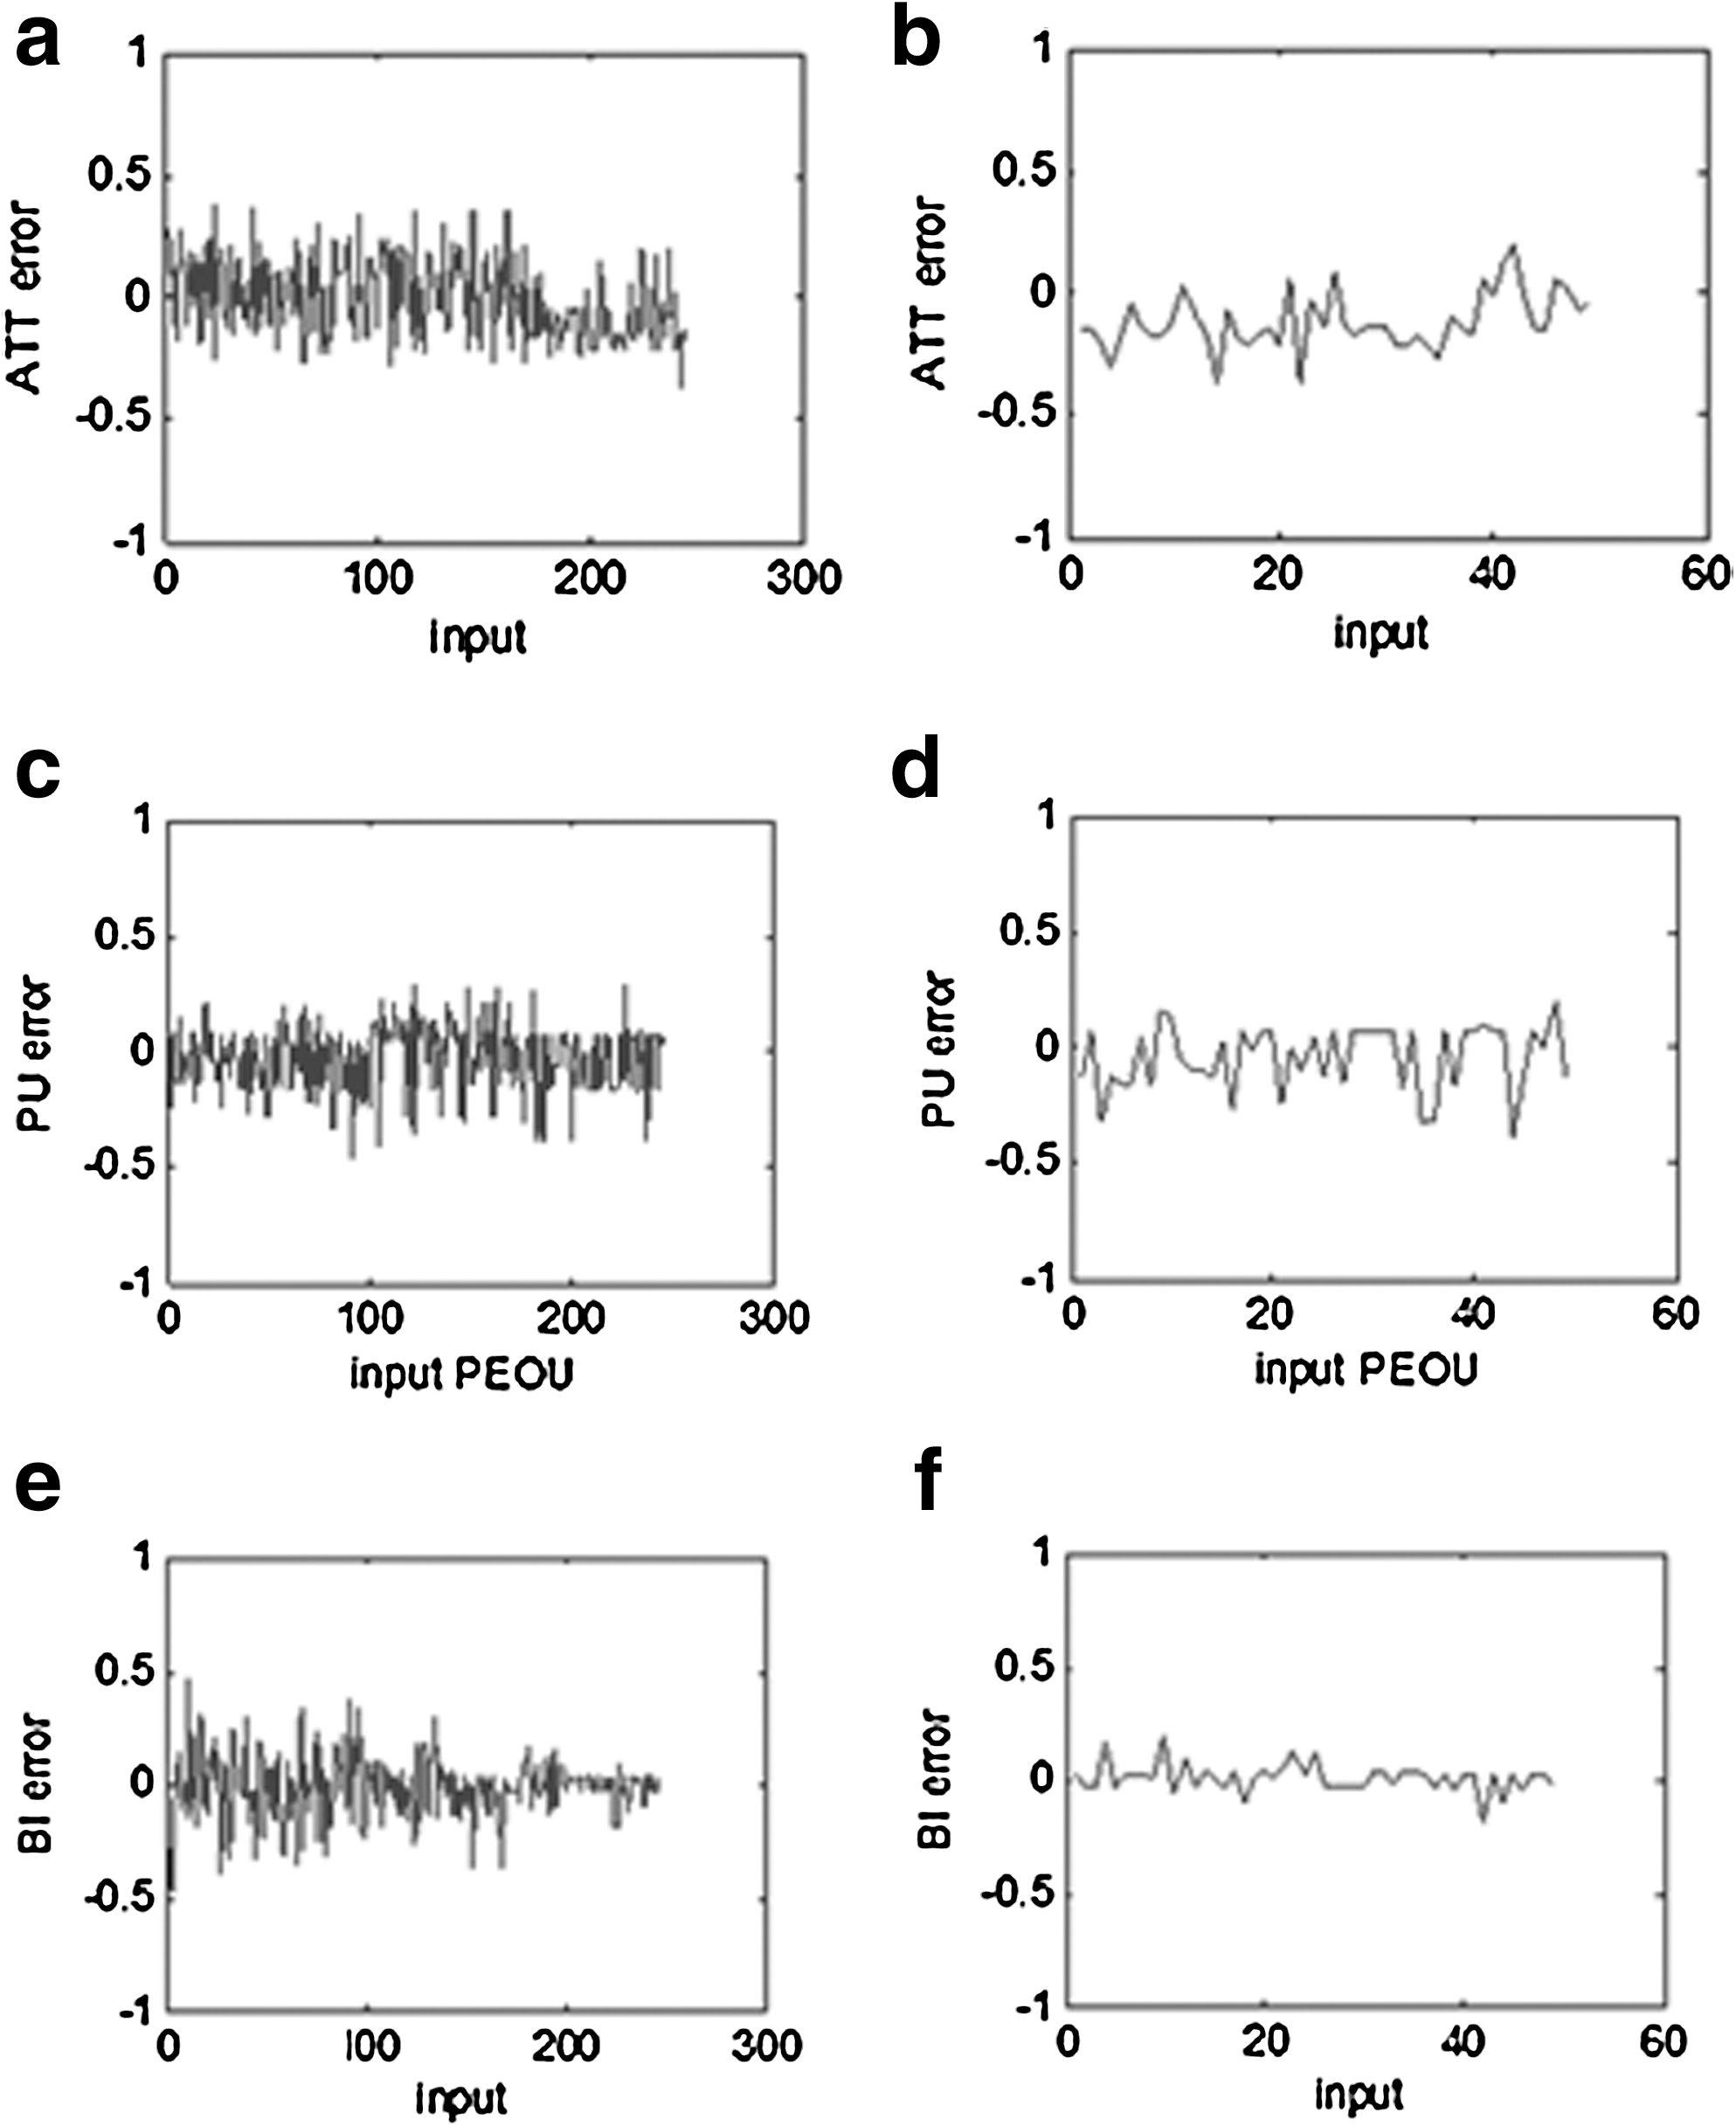
Errors of the training and testing examples in the ANN research framework diagrams (A), (B), and (C). (
As shown in Figure 7, ATT varies positively with BI and thus H1 is supported. As shown in Figure 8, PEOU varies positively with PU and thus H2b is supported. As shown in Figure 9, PEOU and PU have a significantly positive effect on ATT, and thus H2a and H3 are supported. Besides, it also reveals that the impact of PU on ATT with respect to telecare is higher than that of PEOU.

Effects of ATT on BI.

Effects of PEOU on PU.
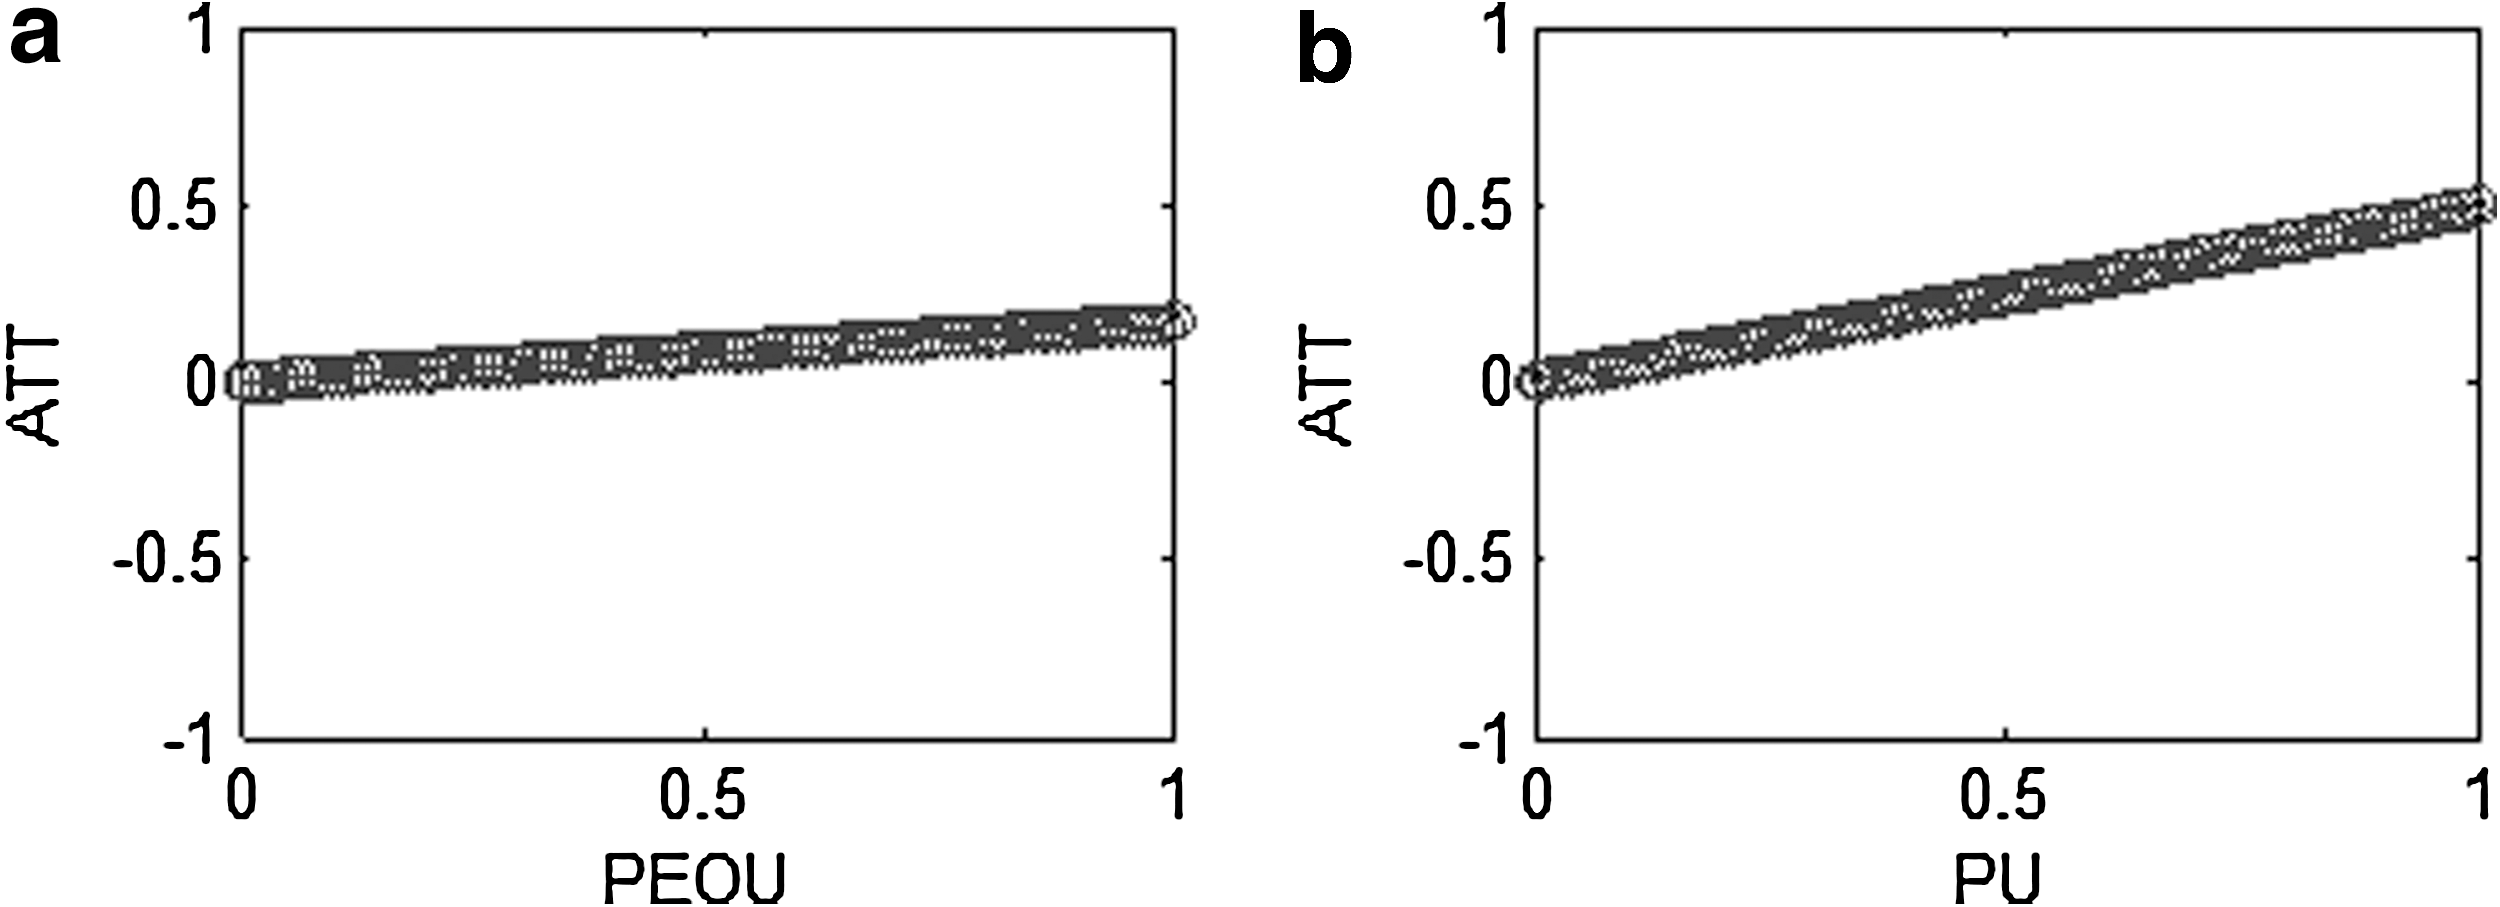
Effects of PEOU and PU on ATT. (
In addition, the correlation coefficients in Table 5 show that, among the effects of PEOU and PU on ATT, the effect of PU is the most significant (with a correlation coefficient of 0.4903) and positive, followed by PEOU (with a correlation coefficient of 0.1639), which is also positive. The results of above three hypotheses testing indicate that it is feasible to construct a model with BPN method of ANN.
Analysis Results of the Artificial Neural Network Model
SD, standard deviation; RMS, root of mean square; BI, behavioral intention to use.
Results of Traditional Method and the Artificial Neural Network Model
Table 6 reveals the dependence of ATT on PEOU and PU. The training and testing data RMSs are 0.162 and 0.165, respectively. As to the dependence of PEOU on PU, the training and testing data RMSs are 0.154 and 0.146, respectively. As to the dependence of ATT on BI, the training and testing data RMSs are 0.141 and 0.064, respectively. On the other hand, the regression model also shows the dependence of ATT on PEOU and PU. The training and testing data RMSs are 0.809 and 0.557, respectively. As to the dependence of PEOU on PU, the training and testing data RMSs are 0.577 and 0.406, respectively. As to the dependence of ATT on BI, the training and testing data RMSs are 0.748 and 0.297, respectively. In brief, this comparison clearly shows that the ANN model is much better than the regression method.
Comparison Between Traditional Method and the Artificial Neural Network Model
ANN, Artificial Neural Network.
Discussion and Conclusions
This research has proved that the utilization of the adoption model of telecare established by BPN is feasible. The results identify telecare adoption model by using BPN based on TAM. Using the BPN model, we do not need to be restricted in the research data whether for linear or nonlinear.
In addition, the TAM reveals that ATT and BI with respect to telecare is positively and significantly associated, and this result is consistent with those of relevant past studies. 17,24,25 People's PU must be raised to effectively increase the adoption of telecare. PU has significant positive effect on users' attitude, indicating the attitude of use will be positively affected when users find the system to be helpful, that is, the users will adopt telecare if they perceive the system useful. This result is consistent with that obtained from the investigation on physician's acceptance of telemedicine technology—PU was a critical determinant of attitude—conducted by Chau and Hu 17 as well as in previous application researches 16,37 –41 on TAM.
Further, education and training for ease of use of telecare for users appear especially important. This result is similar to the study by Ludwick and Doucette, 42 which indicated that the telemedicine system uses ordinary videoconferencing, whose lack of complexity helps reduce telemedicine barriers. The result of this research is consistent with those obtained from other researches 14,19,20,26,37,38,40 that used TAM. Telecare can provide cost benefits and improve the quality of life. 43,44 In sum, this research is suggested to make the operation interfaces of the telecare more user-friendly and provide a demonstration system for practice, so that users would be more comfortable using the system. The findings of this research suggest that, to develop training for users to use telecare, it is likely to be helpful to reduce users' anxiety and improve usage of telecare. Relevant studies also reveal similar results and indicate that training should be provided to professionals. 45,46 Participants of health professionals had high levels of satisfaction regarding knowledge and skills, use of information to enhance patient care, program quality, and convenience of the technology. 47
This research is different from the general researches that focus merely on TAM for singular analysis because it can help enhance the understanding and reference pertaining to the relationship and reference of important user variables in the choice of telecare by relevant researchers, technology developers, and policy makers. These findings may offer significant reference for subsequent studies.
Disclosure Statement
No competing financial interests exist.