
Abstract
Introduction
Diabetes mellitus (DM) is a major cause of morbidity and mortality in the United States and the prevalence of DM is increasing. 1 Hypertension (HTN) is the most common diagnosis seen in primary care settings in the United States—32% of all U.S. adults have HTN. 2 Increased emphasis is being placed on the critical need to control HTN in patients with DM. 3,4 Diabetes is associated with both microvascular (e.g., retinopathy and neuropathy) and macrovascular (e.g., cardiovascular disease) complications. Prior studies have demonstrated that patients with DM get at least twice the benefit out of blood pressure (BP) control compared with nondiabetics. 5 Patients with DM require more rigorous BP control than most patients without DM, 6 even in the absence of HTN. Because DM prevalence is increasing and glycemic and BP control remain suboptimal, 7 it is critical to find new ways to manage these comorbid conditions. Several studies have evaluated the use of emerging home technologies to manage chronic illnesses such as DM and HTN. Most projects have focused on single-disease populations, 8 –10 yet home telehealth may hold the most promise for individuals dealing with multiple chronic illnesses.
The purpose of this study was to evaluate the efficacy of a nurse-managed home telehealth intervention to improve outcomes in veterans with comorbid DM and HTN, the two most common chronic conditions seen in the Department of Veterans Affairs (VA) Primary Care clinics. We hypothesized that compared with subjects who receive usual care, subjects who received the home telehealth intervention would have improved clinical measures (hemoglobin A1c [A1c] and systolic blood pressure [SBP]). We also evaluated varying the intervention dose; within the intervention group, we assigned patients to high- and low-intensity data transmission levels (varied the amount of monitoring and education content transmitted to patients) to ascertain differences in outcomes over and above patient transmission of blood glucose (BG) and BP measurement to the nurse.
Materials and Methods
Design Overview
This study was a single-center, randomized, controlled clinical trial design comparing three treatments, two remote monitoring intensity levels and usual care, with respect to improvement in outcomes in patients with comorbid DM and HTN. Primary outcome measures were A1c and SBP. The local institutional review board approved the study prior to data collection.
Setting and Participants
The study was conducted at the Iowa City VA Medical Center (ICVAMC), which provides primary, secondary, and tertiary medical, surgical, psychiatric, and neurological care to more than 36,000 veterans residing in eastern Iowa and western Illinois.
The target population was comprised of patients with type 2 DM and HTN being treated by a VA primary care provider. VA electronic databases were searched to identify veterans actively enrolled in primary care with the target conditions. Presence of DM and HTN were identified through three data sources: the VA Outpatient File, which contains International Classification of Disease (ICD-9-CM) codes for outpatient encounters for DM (250.xx) or HTN (401.9); the VA Pharmacy Database, which identifies all prescriptions and supplies distributed by the VA Pharmacy; and the VA Laboratory Database (for A1c levels).
Enrollment criteria included coexisting DM and HTN, a landline telephone in the home, receipt of primary care from the VA in the previous 12 months, and anticipation of receiving primary care for the duration of study enrollment. Individuals who were legally blind, resided in a long-term care facility, or who had diagnoses indicating dementia or psychosis were excluded.
Patients were mailed a study invitation letter in advance of a scheduled primary care appointment that included a description of the study, a consent form, and contact information for study personnel; letters were followed up with a phone call from study staff. Study nurses met with patients who expressed interest at a scheduled primary care clinic appointment to review the study and obtain informed consent. Baseline data were collected during this clinic visit and included demographic, A1c, and SBP data.
Eligible patients included 14,000 veterans seen on-site at the ICVAMC Primary Care Clinic. Figure 1 shows participant flow throughout the study. Recruitment occurred from September 2005 through December 2006. We targeted patients who had an upcoming Primary Care Clinic appointment, with a goal of sending letters to a maximum of 10 patients per day. Although it occurred infrequently, if there were more than 10 patients from our pool with a clinic appointment on a given day, we randomly selected 10 potential subjects, using a random number generator to select patients. Thus, from an initial subject pool of 2,756 with both HTN and DM, study invitation letters were mailed to 1,272 subjects. Of these, 184 (14%) individuals did not meet eligibility requirements, 718 (56%) refused participation, and 66 (5%) cancelled or did not show for the clinic visit when enrollment was scheduled. This resulted in 304 subjects; 2 dropped out prior to randomization. Thus, 302 subjects were randomized to three groups: 107 to usual care, 102 to the low-intensity group, and 93 to the high-intensity group. Of these, 85% (n=257) completed 6-month data collection, and 81% (n=246) completed 12-month data collection. The dropout rate was 9% (n=28); 2% (n=5) died during enrollment and 2% (n=6) were lost to follow-up.

Recruitment of flowchart.
Randomization and Intervention
Randomization occurred after consent and collection of baseline data. Group assignments were made by the study nurses using sequentially numbered, sealed, opaque envelopes prepared in advance by the project director.
The intervention combined close surveillance via a home telehealth device and nurse care management over a 6-month time period. The study nurses were two registered nurses with prior experience in delivering a home telehealth and nurse care management intervention in a research setting. 11 The home telehealth device (Viterion-Bayer Panasonic) uses a standard telephone line to enable data transmission between the patient's home and the study center. Using the device, intervention patients entered BP and BG measurements and responded to standardized questions based on their group assignment. Patients then received appropriate automated responses depending on how they answered the device prompt, that is, correct responses were reinforced and incorrect responses were reviewed and explained. The device automatically downloads data each night, making the patient information available for the nurse to review the next day. The device also allows individualized messages to be transmitted to subjects.
Trended data on BP, BG, and responses to prompts were viewed via a secure Web site by the nurse. These data enabled the nurse to efficiently provide close surveillance in order to provide earlier intervention when clinical parameters were out of control or the subject indicated through his responses to the device prompts that additional health information or support was needed. Subjects received the device and were trained on use of the device at the enrollment clinic visit. All subjects also received a BP cuff and were trained to use it at the enrollment visit.
Nurse Management Component
Both intervention groups received care management from a study nurse. At enrollment, the subject's primary care physician was contacted for BP and BG parameters that should trigger a call to the physician for changes in the treatment plan. Each weekday, the study nurse reviewed responses from intervention group subjects and determined whether the subject needed follow-up, that is, additional health information, increased monitoring, compliance strategies, problem resolution facilitation, or contact with the subject's physician. Follow-up was conducted by telephone, mailing a letter to patients, or using the device to send an advice message. Study nurses had full access to the patient's electronic medical record.
High-intensity group
Subjects were instructed to measure BP daily and BG as directed by their physician, that is, frequency of home BG monitoring was not changed. The study team (nurses, a physician, and a certified diabetes educator) developed a branching disease management algorithm based on DM and HTN guidelines from the VA, American Diabetes Association, and the American Heart Association. The algorithm was programmed into the device and focused on diet, exercise, smoking cessation, foot care, advice for sick days, medications, weight management, preventive care, and behavior modification and lifestyle adjustments. A schedule was established for each prompt set so that subjects received both standard prompts each day and a rotation of questions and educational content.
Low-intensity group
Subjects were instructed to measure BP daily and BG as directed by their physician. Subjects in this group responded to a small subset of questions from the larger set of questions used with the high-intensity group. Every day, subjects in this group were asked “Have you taken all your medications as prescribed?” In addition, subjects were prompted with one additional question each day focused on diet, exercise, foot care, or medication side effects. These questions did not use the branching algorithm used for the high-intensity group, rather they used yes/no or multiple choice responses.
Usual care
Usual care subjects scheduled follow-up appointments with the primary care clinic in the usual manner. These subjects had access to their nurse care manager employed by the medical center.
Outcomes and Follow-Up
Data were collected at baseline, 6 months (end of intervention period), and 12 months (to determine maintenance of outcomes following completion of the intervention). Baseline data include demographics, body mass index, depressive symptoms, adherence, and the primary outcome measures of A1c and SBP. Data were collected by scheduling clinic visits for all subjects. Blood was drawn and analyzed for A1c by the ICVAMC Laboratory. BP was measured by study staff using an automated BP machine according to recommended standards. 12
Depression is common in chronic illness and may affect the patient's ability to comply with or participate in self-management of a chronic disease. Depressive symptoms were measured using the Geriatric Depression Scale (GDS). 13,14 Used in VA patients, the GDS has a sensitivity of 92%, specificity of 89%, and a negative predictive value of 99%. The GDS demonstrated a high degree of internal consistency (Cronbach's alpha=0.94) and test–retest reliability (r=0.85) on subjects tested 1 week apart. A score of 0 to 10 is considered normal, whereas 11 or greater indicates a possibility of depression; a score of 21–30 indicates severe depressive symptoms.
Patient adherence was measured as a secondary outcome using two scales. The Self-Reported Medication Taking scale 15 includes four items addressing medication-taking behavior in patients with HTN. The scale has been shown to have acceptable reliability (Cronbach's alpha=0.61), with individuals scoring high on the scale are significantly more likely to have their BP under control compared with individuals who scored low (r=0.58; p<0.01) at 42-month follow-up. 15 For DM, a validated regimen adherence scale was used, 16 which addresses medication, diet, exercise, and BG testing. This scale was validated in a sample of 181 patients (95% Caucasian, 46% male, 60% type 1); all six items were combined into one scale score with moderate reliability (alpha=0.73), and item-total correlations ranged from 0.34 to 0.60.
Statistical Analysis
Data were double entered and discrepancies were reconciled. Descriptive statistics were calculated for each group and the three groups at baseline were compared using analysis of variance (ANOVA) with respect to demographics, A1c, SBP, adherence, GDS, and body mass index. These comparisons served as a check on the random assignment.
Primary analyses compared changes in A1c and SBP from baseline to 6 months and from baseline to 12 months using ANOVA, with the change score as the dependent variable. We refer to the difference between the 6-month and baseline outcome as the 6-month change score; the 12-month change score is similarly defined. The 6-month treatment comparison determined whether the intervention had an effect, and the 12-month comparison determined whether the intervention effect persisted after the intervention has ended. All data were analyzed using Statistical Analysis System 9.2 (SAS) (SAS Institute Inc., Cary, NC; 2002–2008). Overall type I error for each primary outcome was limited to 0.05 by using Fisher's least significant difference method, 17 which stipulates that follow-up pairwise comparisons are performed at alpha=0.05, but only if the corresponding global test for equality of the three treatment change-score means is significant at alpha=0.05. All tests were performed using alpha=0.05; insignificant tests with 0.05<p<0.10 are reported as close to significance. Secondary tests, for which we did not control the overall type I error, consisted of testing whether each change score differed from zero; these were performed within the same ANOVA framework.
To account for missing data, primary analyses were performed using a multiple-imputation approach. 18 For the imputations, we assumed for a given treatment that each subject's 9-dimensional vector of A1c, SBP, and DBP outcomes for each of the three times has the same multivariate normal distribution; we allowed the distributions to differ between treatments. Imputed values represent random “draws” from the assumed distribution. Five datasets with missing values replaced by imputed values were generated using the SAS procedure MI, with each respondent's data treated as an independent data vector. Separate analyses were performed and then combined to produce inferential results using the SAS procedure MIANALYZE. Results are valid under the fairly weak assumption that the data are missing at random, which states that the probability that an observation is missing does not depend on the unobserved outcome, conditional on the observed data. 18 Specifically, for our data, a missing value at one time point for a subject is imputed based on information from the other time points for that variable as well as the other two outcomes.
Results
Study subjects were mostly male (98%), Caucasian (96%), and married (66%), with a mean age of 68 years (SD=10; range: 40–89 years). Most had a high-school education or higher (89%). There were no statistically significant differences across the three groups for any baseline measure ( Table 1 ).
Baseline Demographic Data
Primary Outcomes
Glycemic control (A1c)
The three groups were comparable [F(3, 298)=0.34, p=0.71] at baseline for mean A1c (control=7.2, low=7.2, high=7.1). As the number of missing observations for the two interventions was noticeably higher at the 6- and 12-month visits than for the control group, it was not reasonable to assume that data were missing completely at random; thus, we report only the analysis results based on the imputed data. However, we see from Figure 2 that differences between the available data and imputed data means do not appreciably alter the general relationship pattern.

A1c at baseline, 6, and 12 months by group.
Figure 3 presents the change in the means from baseline at 6 and 12 months. At 6 months, the control group did not show a significant change (change=−0.07, p=0.52), but the low- and high-intensity groups decreased significantly, with the low-intensity group showing a 0.40 decrease (p=0.0003) and the high-intensity group showing a 0.44 decrease (p=0.0001). Further, there was a significant difference between the change scores [F(2, 527)=3.47, p=0.03] with both low- and high-intensity groups decreasing significantly more compared with the control group (p=0.03 and 0.02, respectively).
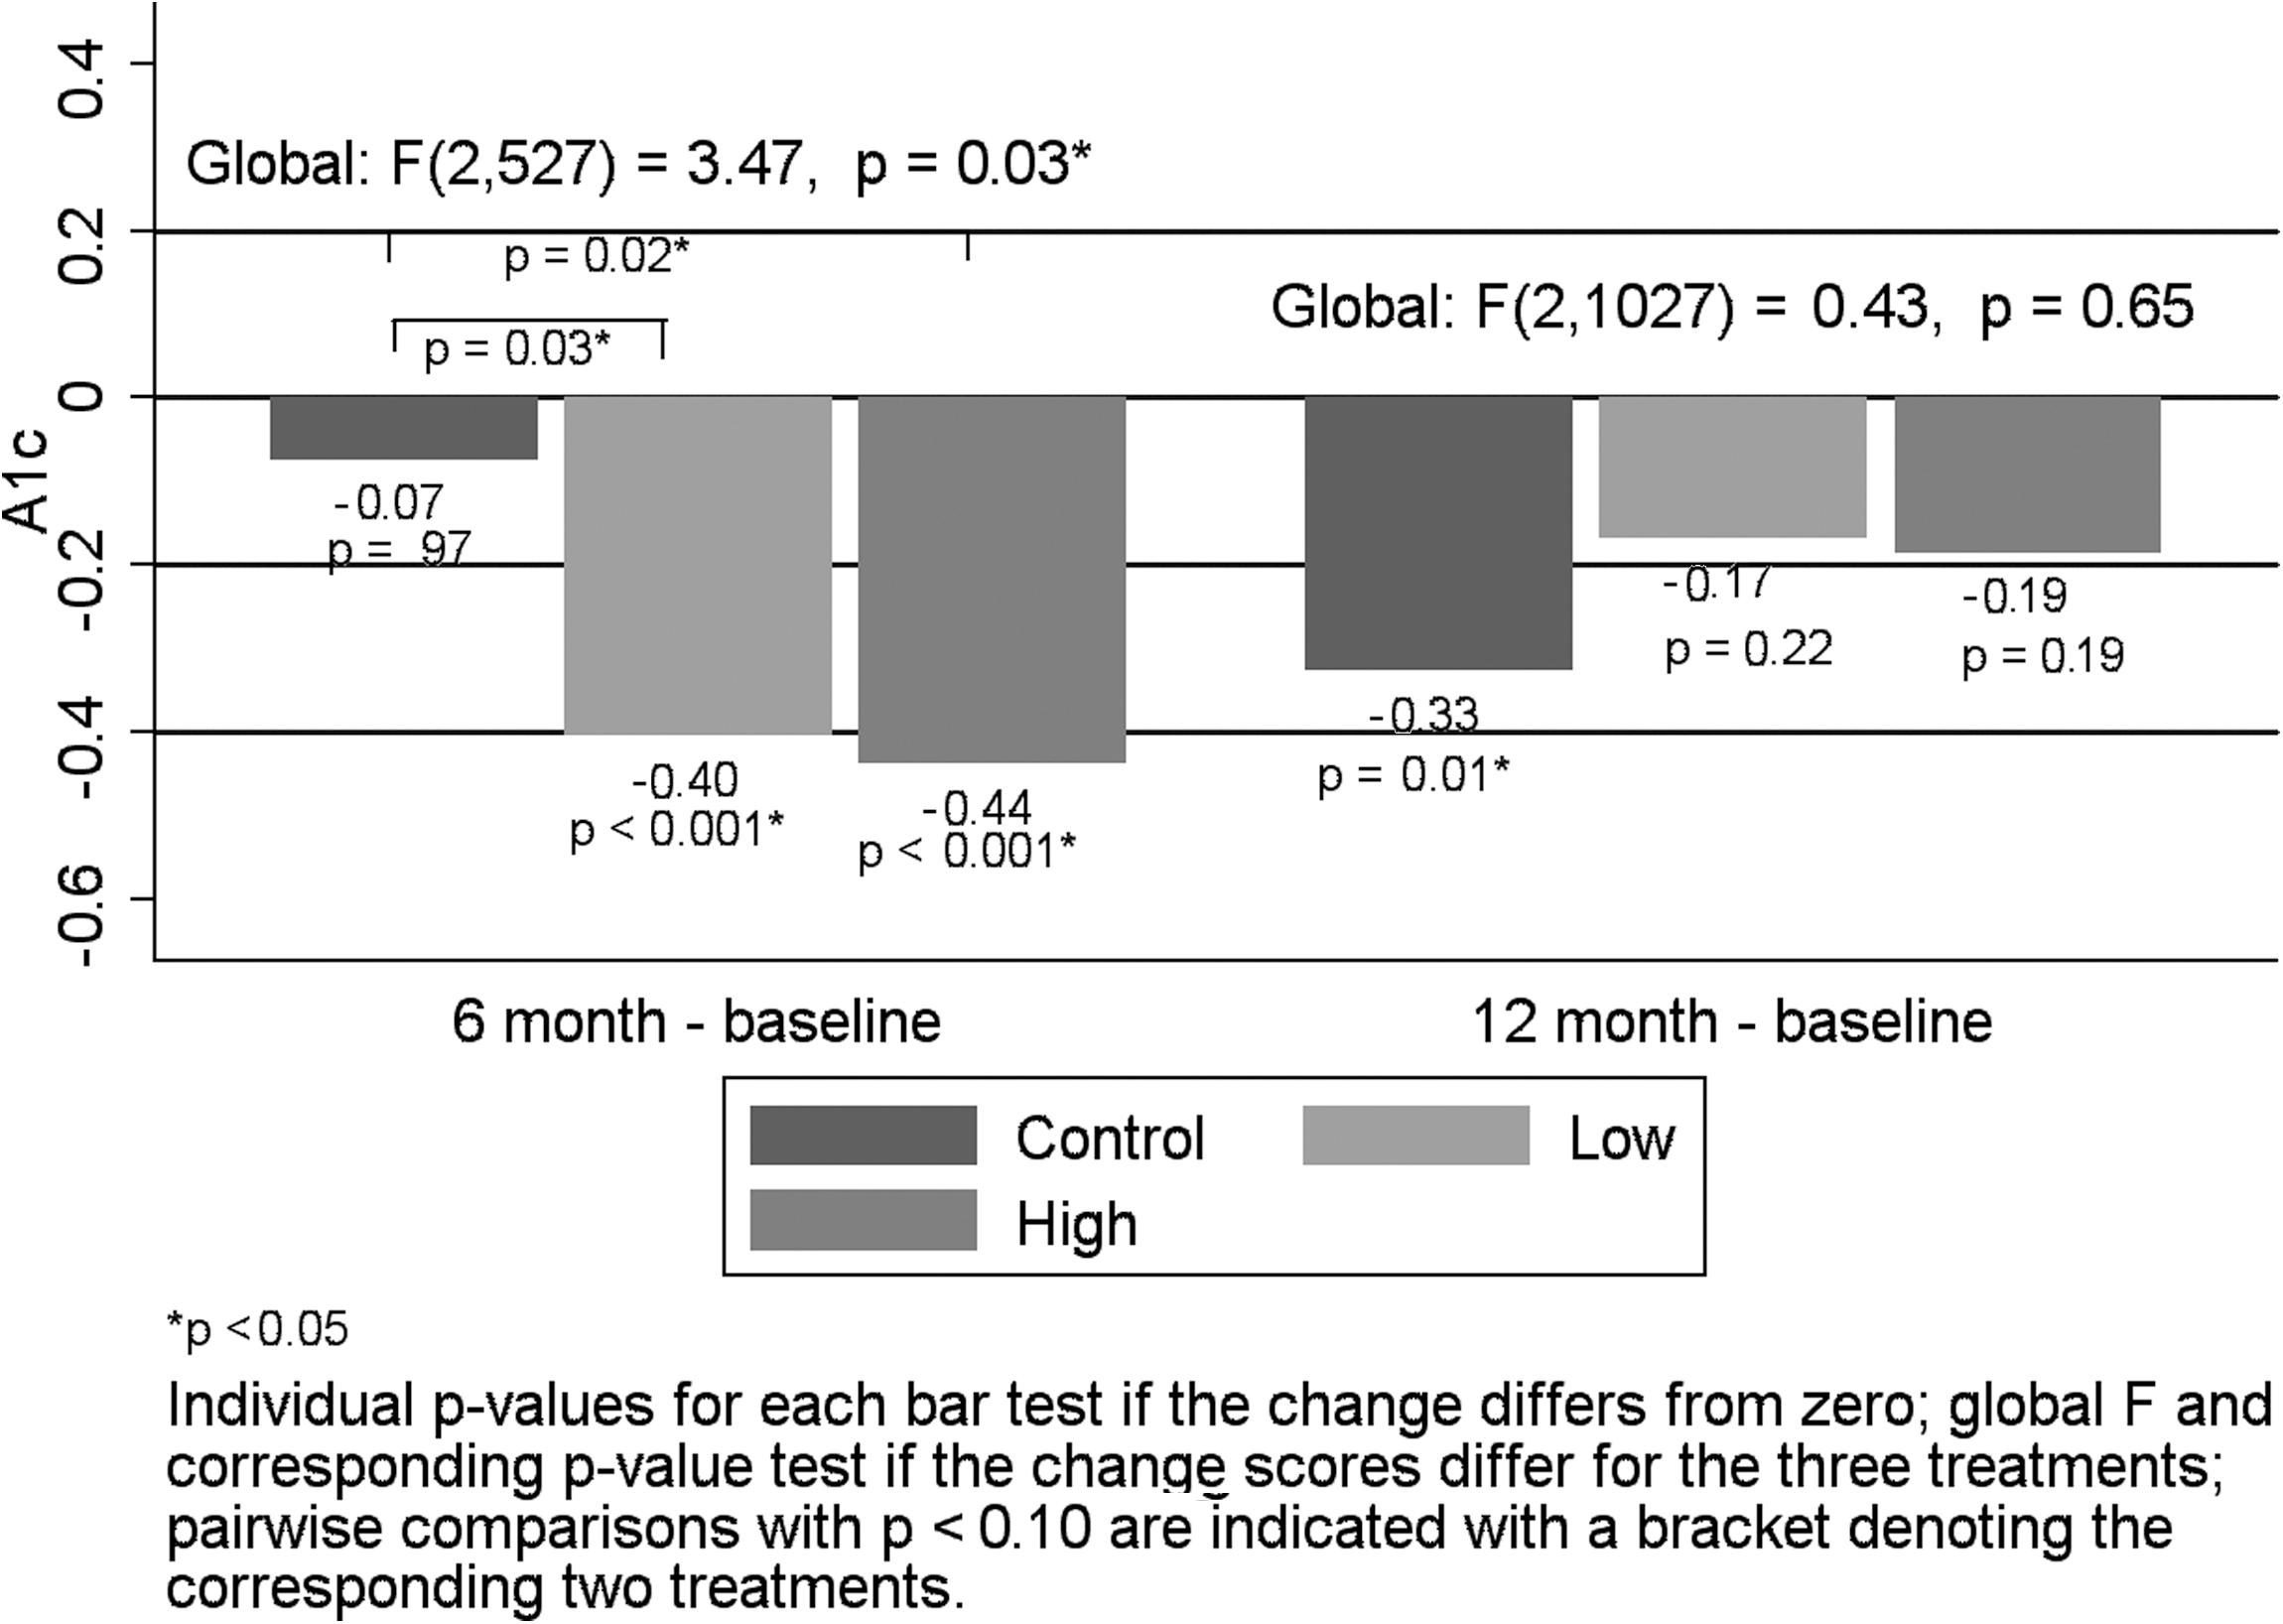
A1c mean change at 6 and 12 months by group.
In contrast, at 12 months, the control group showed a significant decrease of 0.33 (p=0.01) from baseline, but the low- and high-intensity groups no longer showed a significant decrease from baseline (change=−0.17 and −0.19, p=0.22 and 0.19, respectively). There was no significant difference between the change scores for the three groups [F(2, 1027)=0.43, p=0.65].
Systolic blood pressure
The three groups were comparable [F(2, 298)=1.22, p=0.30] at baseline for mean SBP (control=134, low=136, high=138). Similar to A1c, we report only the analysis results based on the imputed data because the number of missing observations for the two interventions was noticeably higher at the 6- and 12-month visits than for the control group, suggesting that the data were not missing completely at random. However, Figure 4 shows that differences between the available data and imputed data means do not appreciably alter the general relationship pattern.
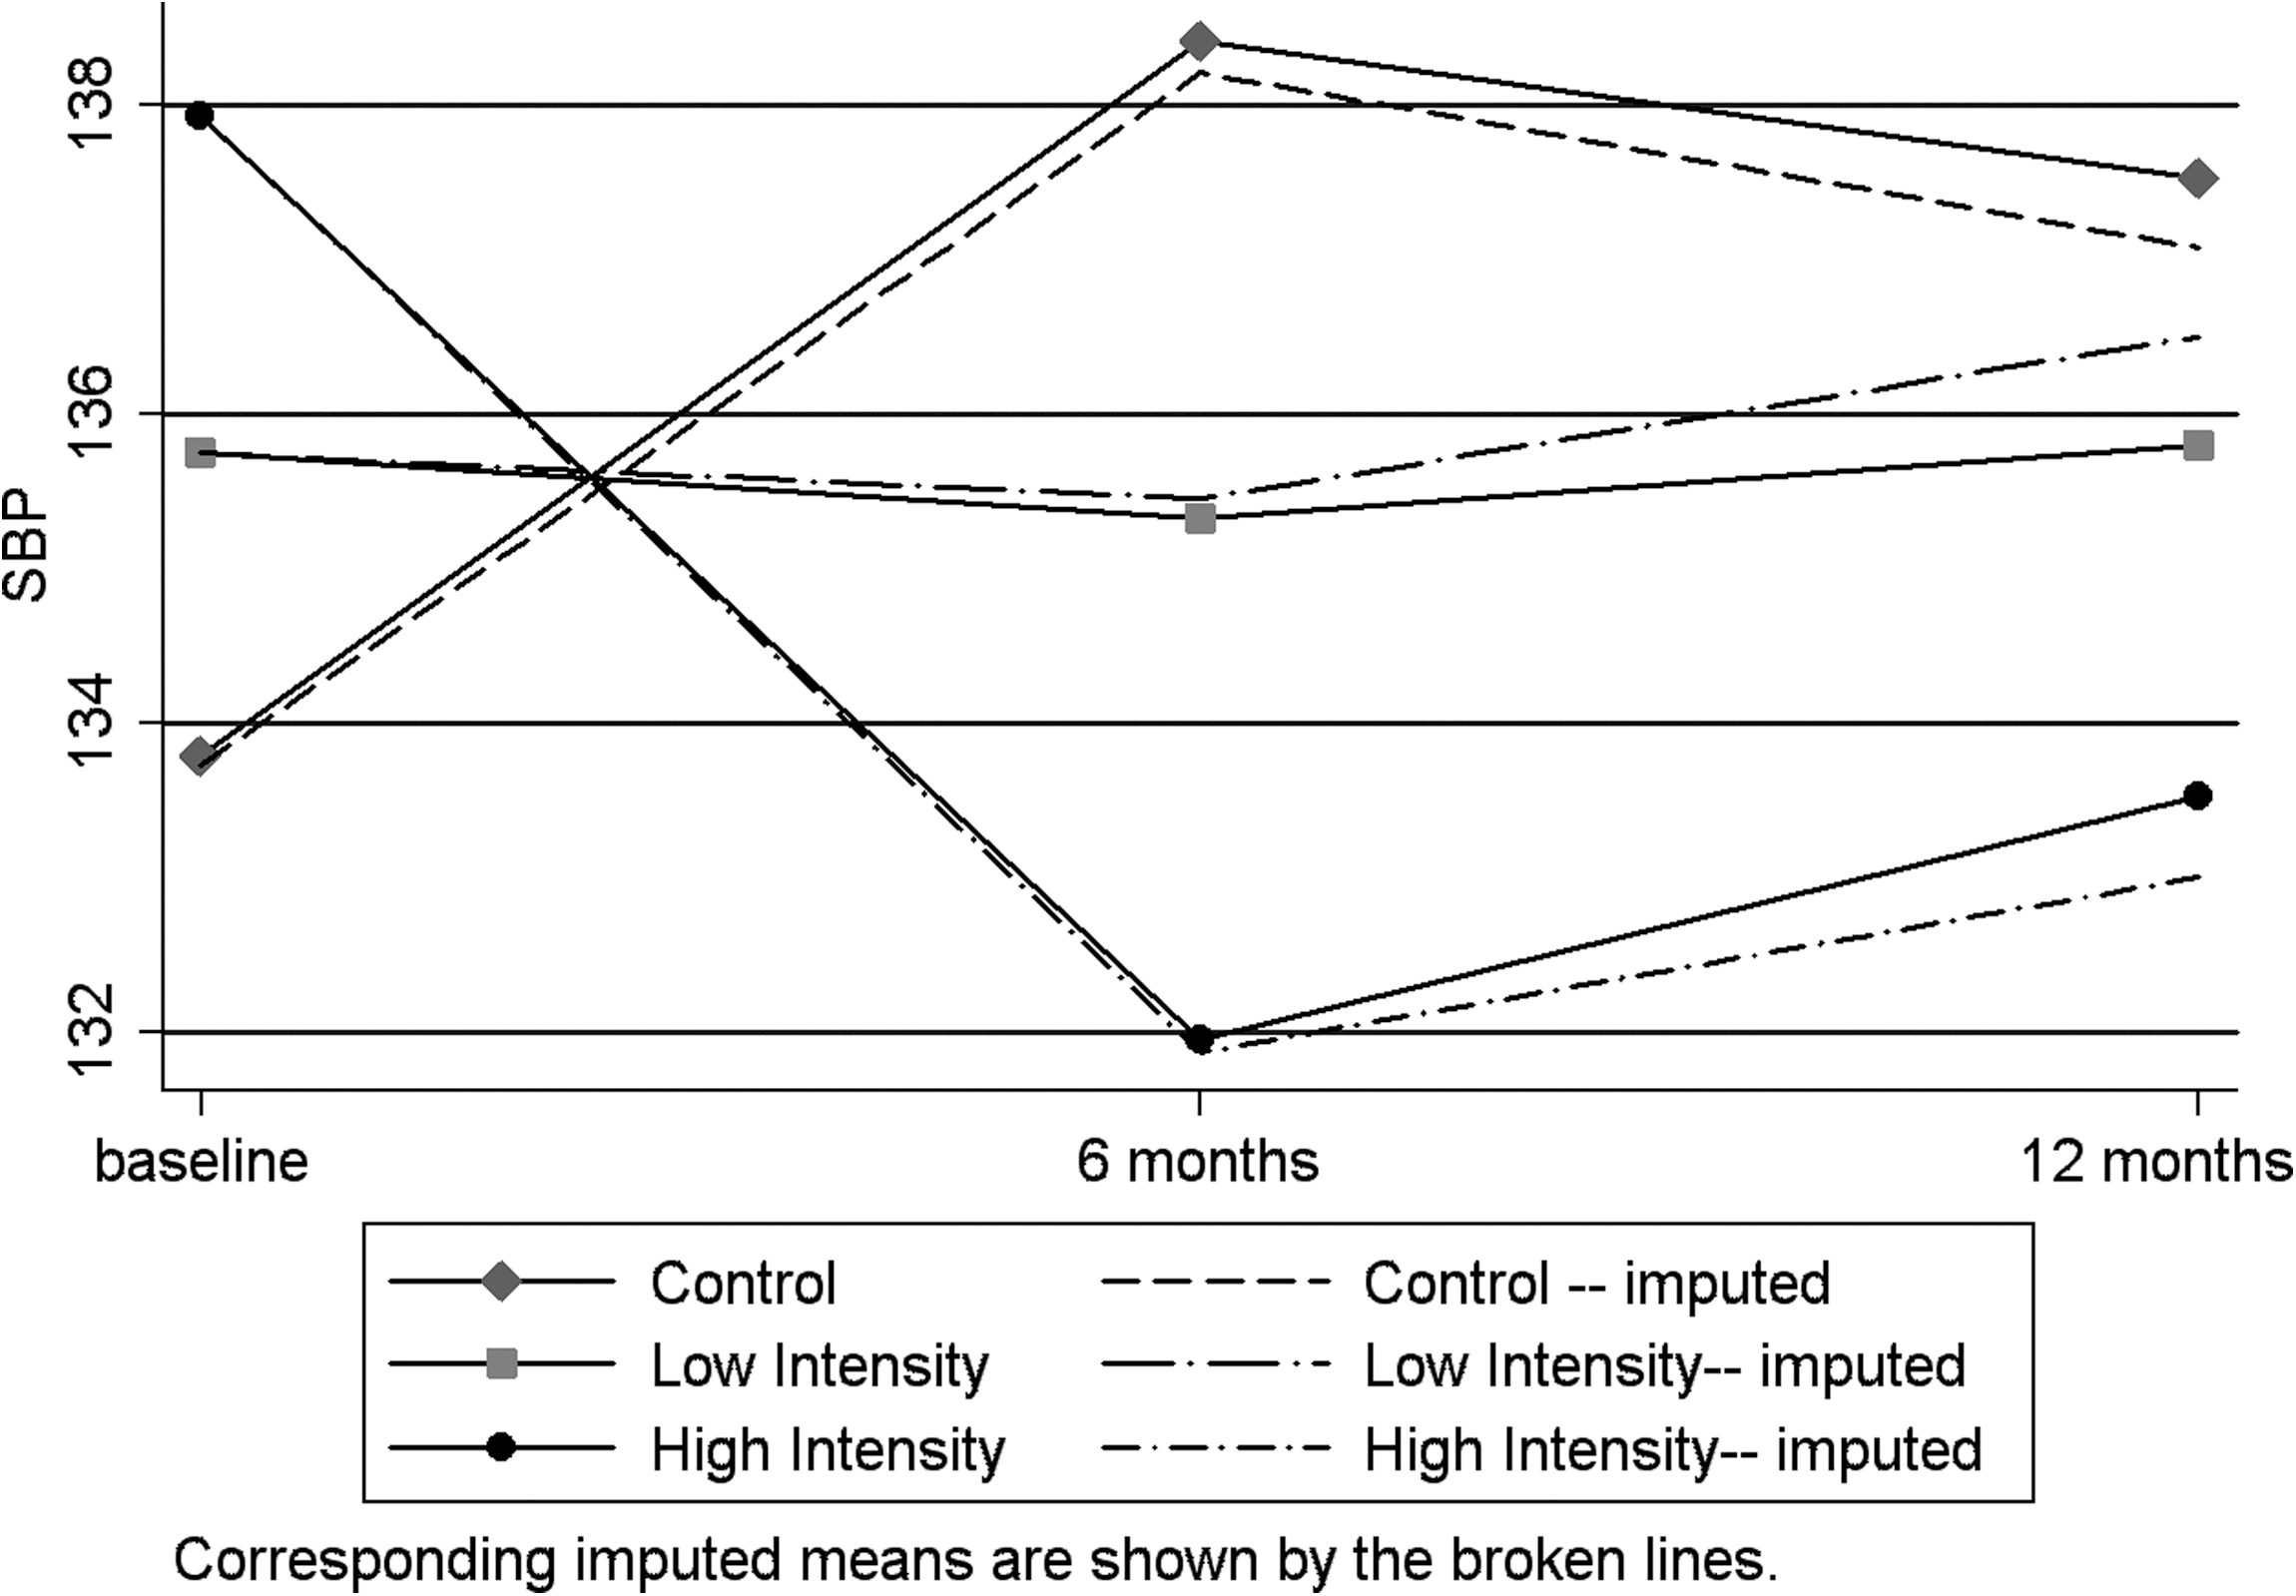
Systolic blood pressure (SBP) at baseline, 6, and 12 months by group.
The change in the means from baseline at 6 and 12 months are presented in Figure 5. At 6 months, the control group increased significantly (change=4.48, p=0.03), the high-intensity group decreased significantly (change=−6.05, p=0.01), and the low-intensity group did not show a significant change (change=−0.29, p=0.90). Further, there was a significant difference between the change scores [F(2, 510)=5.68, p=0.004], with the high-intensity group showing significant improvement (p=0.001) compared with the control group and close to significant improvement (p=0.06) compared with the low-intervention group.
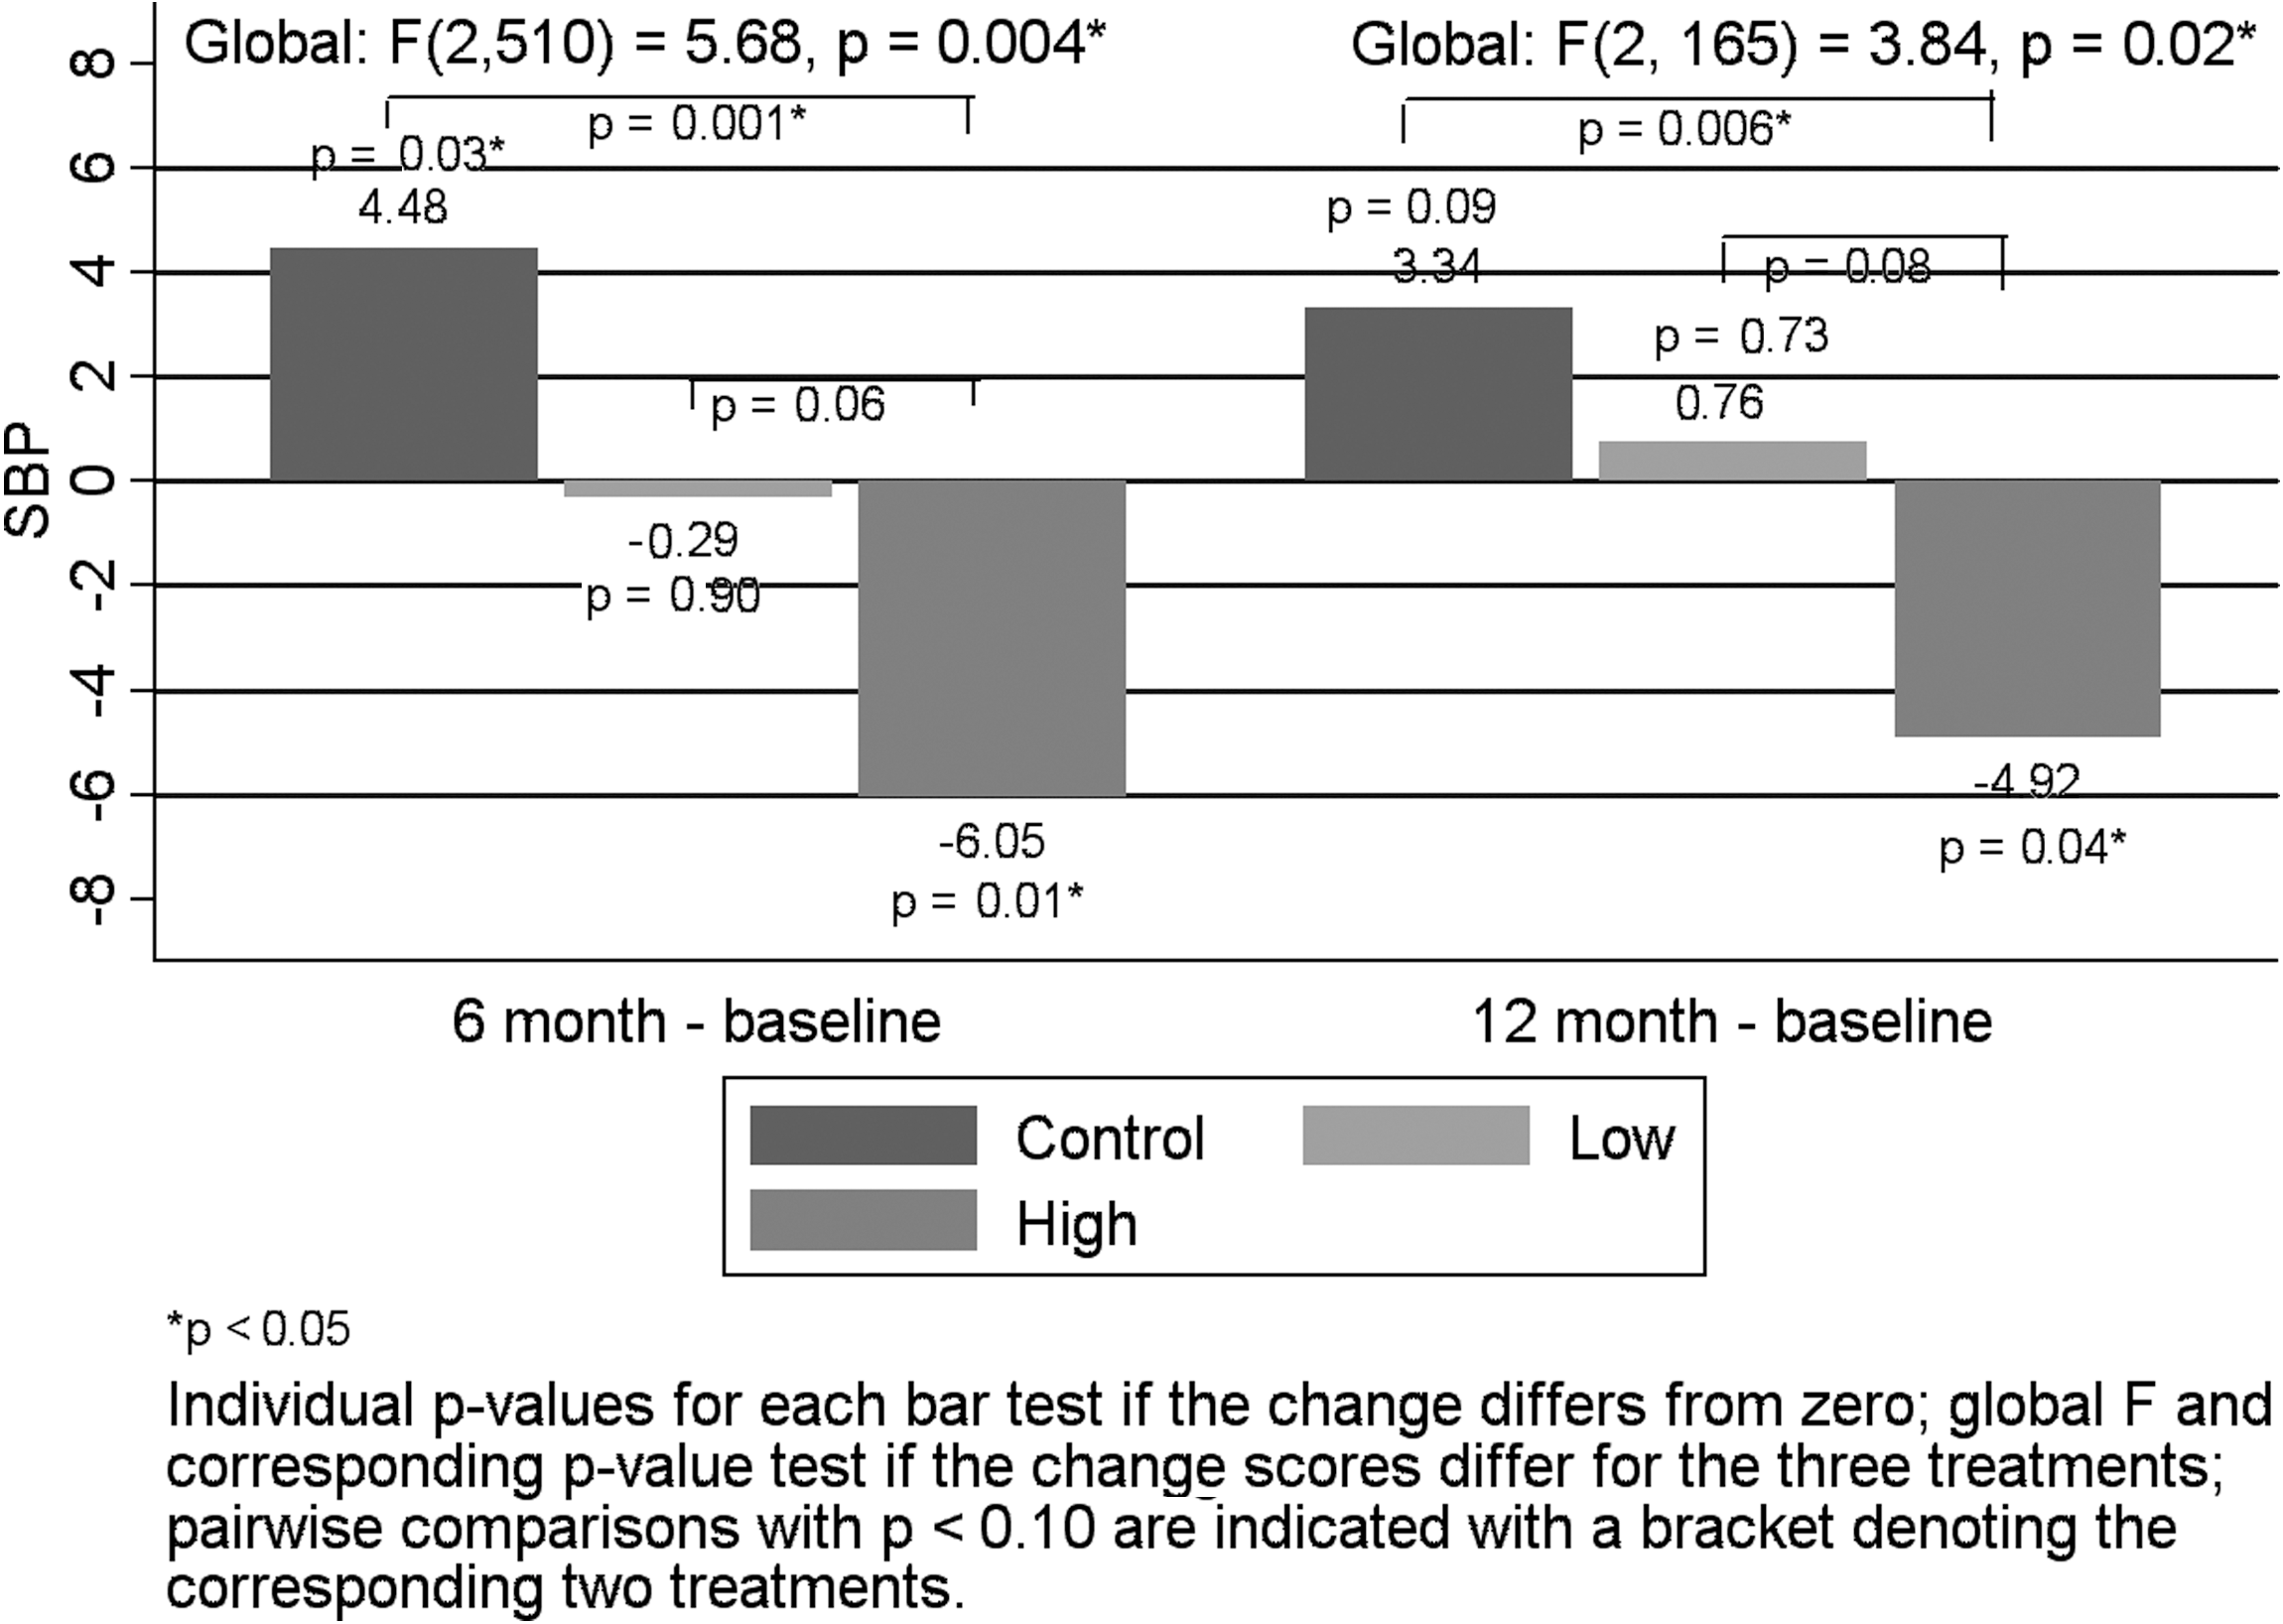
SBP mean change at 6 and 12 months by group.
The results at 12 months were quite similar to those at 6 months. The control group showed a close to significant increase (change=3.34, p=0.09) and the high-intensity group decreased significantly (change=−4.92, p=0.04), with the low-intensity group not showing a significant change (change=0.76, p=0.73). Further, there was a significant difference between the change scores [F(2, 165)=3.84, p=0.02], with the high-intensity group showing significant improvement (p=0.006) compared with the control group and close to significant improvement (p=0.08) compared with the low-intervention group.
Adherence (using two scales described earlier) improved over time for all three groups, and there were no significant difference among the groups (data not shown). Subject engagement with data entry via the telehealth device was not significantly different between the two intervention groups. Subjects in the low-intensity group entered data a mean 125 days/182 days (69%); the high-intensity group patients entered data a mean 127 days/182 days (70%). No study-related adverse events occurred.
Discussion
Subjects in both intervention groups showed significantly decreased levels of A1c during the 6-month intervention period compared with the control group, but the groups did not differ significantly at 6 months after the intervention was withdrawn. For SBP, the high-intensity subjects had a significant decrease in SBP compared with the other groups and this pattern was maintained at 12 months. Self-reported adherence improved in all three groups over time, but the groups did not differ significantly. To our knowledge, this is the first randomized, controlled study of home telehealth to evaluate both patients with comorbid conditions and varying the intervention intensity level.
All patients in this study had regular access to a primary care physician. However, clinic appointments often do not afford adequate time for the primary care provider to address all health problems or issues of patients, particularly the type of in-depth education needed by patients with comorbid DM and HTN. Previous research has shown that a team approach improves chronic illness management. In a randomized trial in Canada, a pharmacist–nurse team working with a family physician achieved a statistically significant reduction in BP in patients with DM over 24 weeks. 19 Others have shown similar results with adding pharmacist care. 20,21 Studies assessing the effect of assigning some responsibility for care to a professional other than the physician (whether independently, shared, or providing support for the physician) have shown the largest effect on BP outcomes. 22
Although the provision of information from physicians has a significant impact on DM management, 23,24 we believe that nurse monitoring and collaboration with the primary care physician, along with daily educational information and assessment, in the high-intensity group resulted in positive outcomes of improved SBP. Others have shown that addressing patient needs between clinic visits can improve care for patients with diabetes. 25 This supports the need for ongoing monitoring and support for this patient population. Widespread implementation of home monitoring of chronic conditions (primarily DM, HTN, heart failure, chronic obstructive pulmonary disease, and mental illness) in the VA over the past several years has greatly decreased healthcare utilization. 26
Findings from previous studies on the effectiveness of telemonitoring patients with DM have been mixed; these studies focused primarily on A1c and used one intervention intensity level. 27,28 Others have found that higher intervention intensity levels improve BP patients with HTN. 20,29 Only one other study evaluated the effectiveness of telemonitoring on simultaneous control of A1c and BP in patients with DM. The IDEATel study was a large, randomized, controlled trial of 1,665 subjects over age 55 that evaluated home telemonitoring in urban and rural elderly Medicare participants. They found improvements in A1c, low-density lipoprotein, and BP in the intervention group, 30 which were maintained over the 5 years of the intervention. 31 Further studies are needed to evaluate the optimal frequency and intensity of monitoring of home monitoring with nurse monitoring across all levels of patient risk. Studies that evaluate the mechanism of effect and effective dose of remote monitoring, for example, frequency of communication and the types and amount of information exchange, are needed. Finally, emerging demonstrations and adoption of the patient-centered medical home need to evaluate the integration and effectiveness of remote monitoring within the interdisciplinary team care concept.
Limitations
On average, subjects who enrolled in this study had relatively good baseline control for A1c and SBP; thus, this sample may represent patients who were more highly motivated to manage their chronic illness. Because these data were collected in a Midwestern VA Medical Center, minorities and women were underrepresented. Patients without telephones could not participate; this may have excluded the most economically disadvantaged patients for whom the intervention would be the most effective. The study was not designed to measure outcomes beyond the 12-month follow-up period, so longer-term effects were not measured.
Home telehealth provides an innovative and pragmatic approach to increase contact between patients and their care team between visits, enabling earlier detection of key clinical symptoms requiring intervention. Our results show that transmission of education and advice to the patient on an ongoing basis (compared to transmission of BP and BG to providers alone) with close surveillance by nurses can improve clinical outcomes in chronic illness. Thus, home telehealth interventions have the potential to improve care for community-based patients with comorbid illnesses. These technologies enable increased surveillance, support, and enhanced communication and have significant potential to improve patient's attention to and adherence with disease treatment.
Footnotes
Acknowledgments
The authors thank Richelle Koopman, MD, for review and comments on the manuscript. The research reported here was supported by the Department of Veterans Affairs, Veterans Health Administration, Health Services Research and Development (VA HSR&D) Service (No. NRI 03-312). Preliminary results from this study have been presented at the following meetings: Midwest Nursing Research Society Conference (2009), the American Telemedicine Association Annual Meeting (2008), VA Health Services Research & Development Annual Meeting (2008), and Academy Health Annual Meeting (2008). Clinical trial registration information: No. NCT00119054, Effectiveness of Home-Based Health Messaging for Patients with Hypertension and Diabetes, Department of Veterans Affairs at
Disclaimer
The views expressed in this article are those of the authors and do not necessarily represent the views of the Department of Veterans Affairs. The Veterans Health Administration Health Services Research and Development Service had no involvement in the design of the study; the collection, analysis, or interpretation of the data; or the decision to approve publication of the finished manuscript.
Disclosure Statement
No competing financial interests exist.