
Abstract
Introduction
According to a UN demographic survey, the world population more than the age of 60 is expected to have grown by up to 21.8% in 2050. 1 The rapidly aging population shows a growing demand for ubiquitous healthcare that supports better home care in everyday life. The concept that emerged to support this situation is the challenge of obtaining physiological data in the home environment without disturbing daily life.
It has been reported that continuous ambulatory monitoring has many clinical advantages for patients or an aged people. Ambulatory monitoring of heart rate variability was studied as an efficient method for the prevention and early detection of cardiac-related disease, for example, heart disease, 2,3 diabetes, 4,5 and hypertension. 6 This monitoring technique could also assist elderly people by unconstrained sensor technologies installed in their homes. 7,8 In these studies, activity of daily living has been reported as an efficient tool for assessing the elderly's health conditions.
For sleep monitoring, polysomnography is the standard procedure to diagnose sleep-related disorder. A number of physiological activities are monitored, such as brain activity, cardiac activity, body movement, eye movement, snoring, and respiratory effort. This method has been proved to be accurate, because the test is carefully attended by technical staff in the laboratory. However, polysomnography is considered technically expensive and complex. 9 Therefore, an alternative detection technique has been needed for this purpose.
Among physiological activities in sleep, cardiac activity is widely studied for its correlations with sleep-related disorder. 10,11 In sleep monitoring, electrocardiogram (ECG) and ballistocardiogram (BCG) are used to monitor heart activity. By observing this, we can detect abnormal symptoms such as arrhythmia or heart rate fluctuations. Also, heart rate variability can be estimated from the monitored data signal, which can be useful in clinical assessment as well.
Over the past several years, numerous attempts have been made to develop an unconstrained continuous monitoring technique for this purpose. Watanabe et al. 12 developed a pressure sensor-embedded air-mattress that can measure heartbeat, respiration, apena, snoring, and body movement. Chen et al. 13 also developed a similar device for noninvasive monitoring during sleeping. They applied under-pillow sensors to detect respiration rhythm and pulse rate. Another evaluation process comparable to our study was done by Kawarada et al. The Welfare Techno House is a system with equipments for nonconstrained signal monitoring in a home environment. 14 As a part of their experiment with the system, they measured meaningful periods of ECG signal from a bed in which conductive textile electrodes in the pillow and lower portions of the bed surface were embedded.
In this article, we aim at evaluating the feasibility of the smart bed. No adequate or sustained evaluation has been conducted on weight-sensor loaded beds, especially in an environment that simulates living at home. Therefore, the objective of the study was to validate and evaluate of the feasibility of the smart bed in an environment simulating daily life.
Materials and Methods
The System and the U-House Environment
The smart bed was originally developed by the Advanced Biometric Research Lab at Seoul National University. 15 In this study, the smart bed is used to measure the BCG of subjects. By the definition, the ECG is an electrical signal from the heart and can be normally recorded in the range of 0.05–35 Hz on the skin surface using Ag/AgCl or dry electrodes. On the other hand, BCG is a mechanical activity signal of the heart and can be recorded in the 1–20 Hz frequency range caused by mechanical movement of the heart when the blood ejects from the ventricle to the aorta. 16 In a normal situation, ventricle muscles are contracted right after the heart is electrically depolarized. During this process, the electrical signal is captured as an ECG, and the mechanical signal can be captured as a BCG.
The smart bed is built from a common single bed with four weight sensors (load cell, MNC-100L; CAS) installed under the legs of the bed (Fig. 1). The capacity of the load cell is 100 kg, and its rated output is 2 mV/V, with the resolution of 500 g. The system was designed to measure 300 kg of movement changes more than the bed weight. The sensitive weight sensors can detect the subtle body vibrations and send the resulting measurements in the form of electric potential. The signal is amplified by a connected circuit that uses an instrumentation amplifier (INA114; Texas Instrument) including a low-pass filter to remove high-frequency noises. A signal acquisition device (USB-6259; National Instruments) receives the signals and converts them into a digital form with a 16-bit resolution and 250 Hz sampling frequency. After the conversion, the digital signal is transmitted to the u-House gateway. Figure 2 shows the actual appearance of the system, and a screenshot of the real-time monitoring display is presented in (Fig. 3).
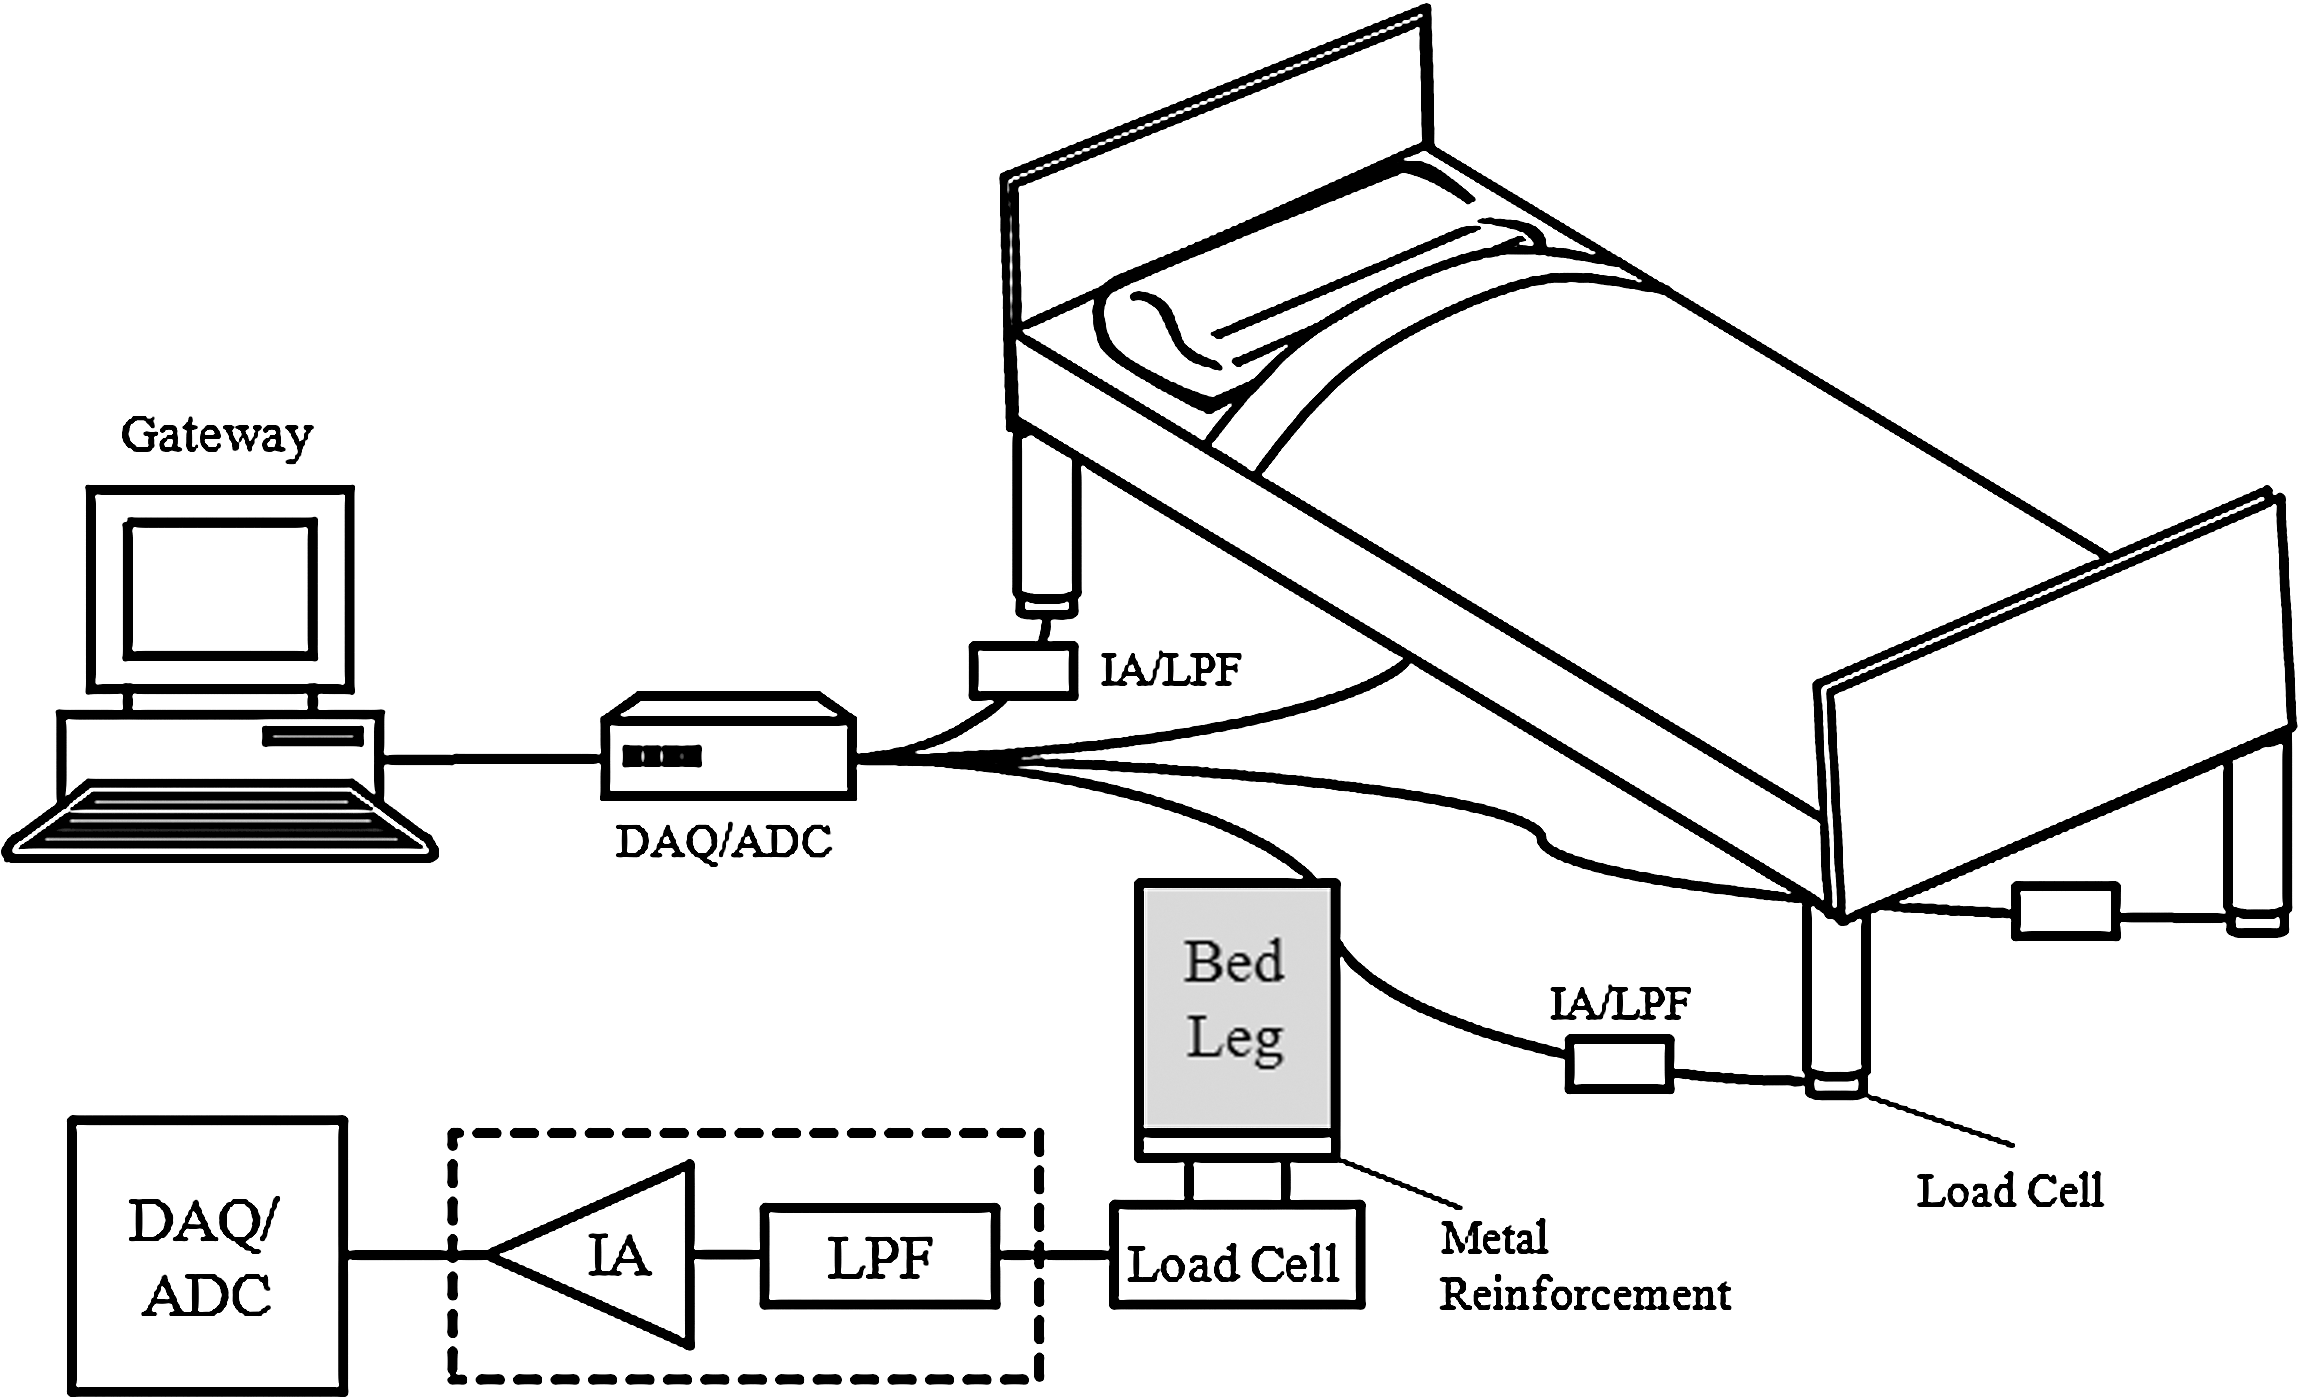
The composition of the smart bed. IA, instrumental amplifier; LPF, low-pass filter; DAQ, data acquisition device; ADC, analog/digital converter.
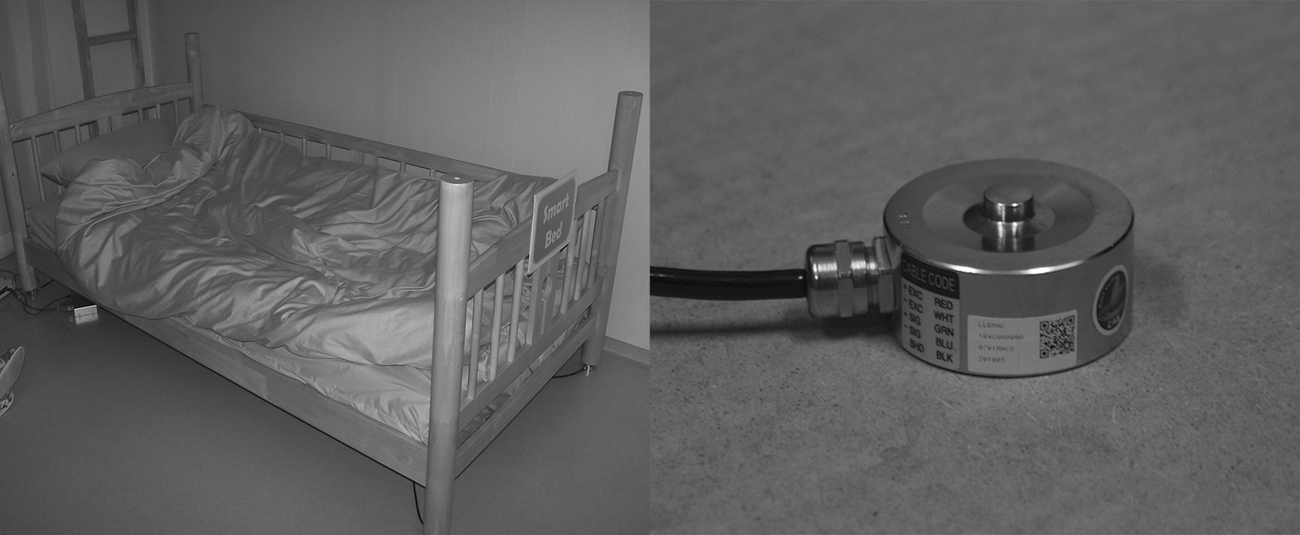
The picture of the smart bed and a strain gauge-based load cell, installed at each corners of the bed.
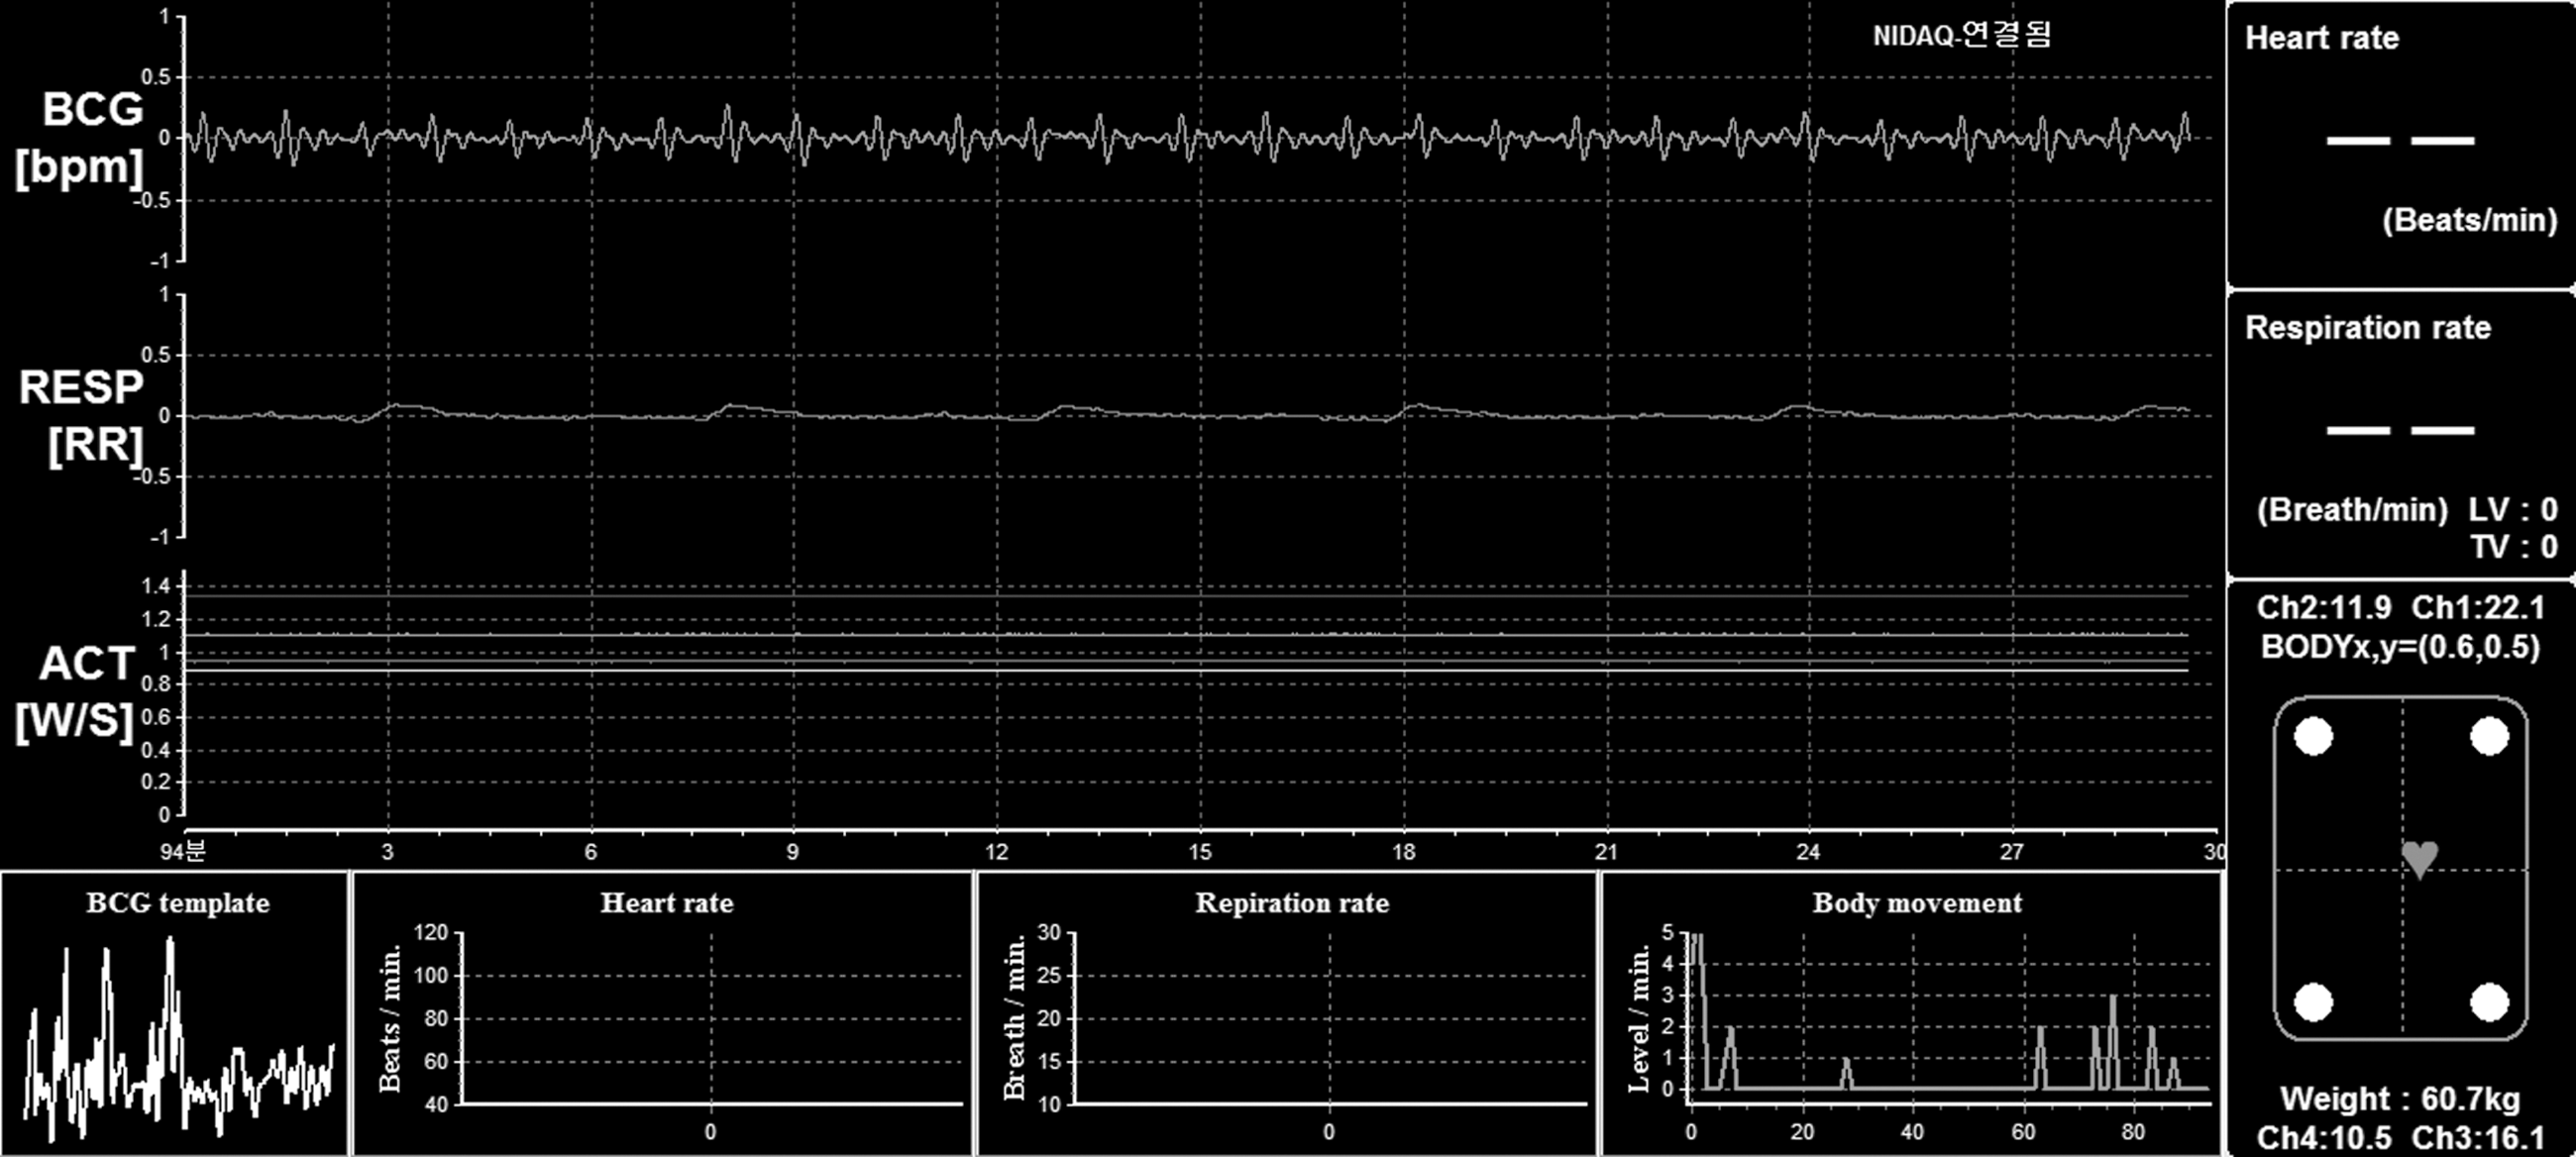
The real-time monitoring display shows the signal from the smart bed: ballistocardiogram (BCG), respiration, subject's movement, weight, and the center of weight distribution among four load cells. Heart rate, respiration rate, and BCG template are not displayed, as they were not a real-time feature in the development stage.
Our experiments were performed at the u-House, which is a residential environment equipped with the ubiquitous devices (u-Devices), such as the smart bed (u-Bed), the smart chair (u-Couch), and the smart toilet seat (u-Toilet seat). 15 The u-Bed measures BCG during sleep using a load cell sensor. The u-Couch with a capacitive electrode measures ECG out of the subject's clothes. The u-Toilet seat measures blood pressure using the nonintrusive blood pressure estimating technique. These devices were developed to obtain residents' biological signals without awareness of being monitored; therefore, the u-House does not disturb residents' daily life during monitoring.
When a u-Device is used by a resident, it measures the user's physiological status (based on its own role) and sends the data to the u-House gateway. Data received from the u-Devices are stored in the u-House gateway and sent to the remote central repository server every 5 min. The central repository server classifies the received data by type and adds a timestamp for further needs. The study of the u-House mainly describes those three types of u-Devices; however, our feasibility experiment was focused on the smart bed.
Signal Processing
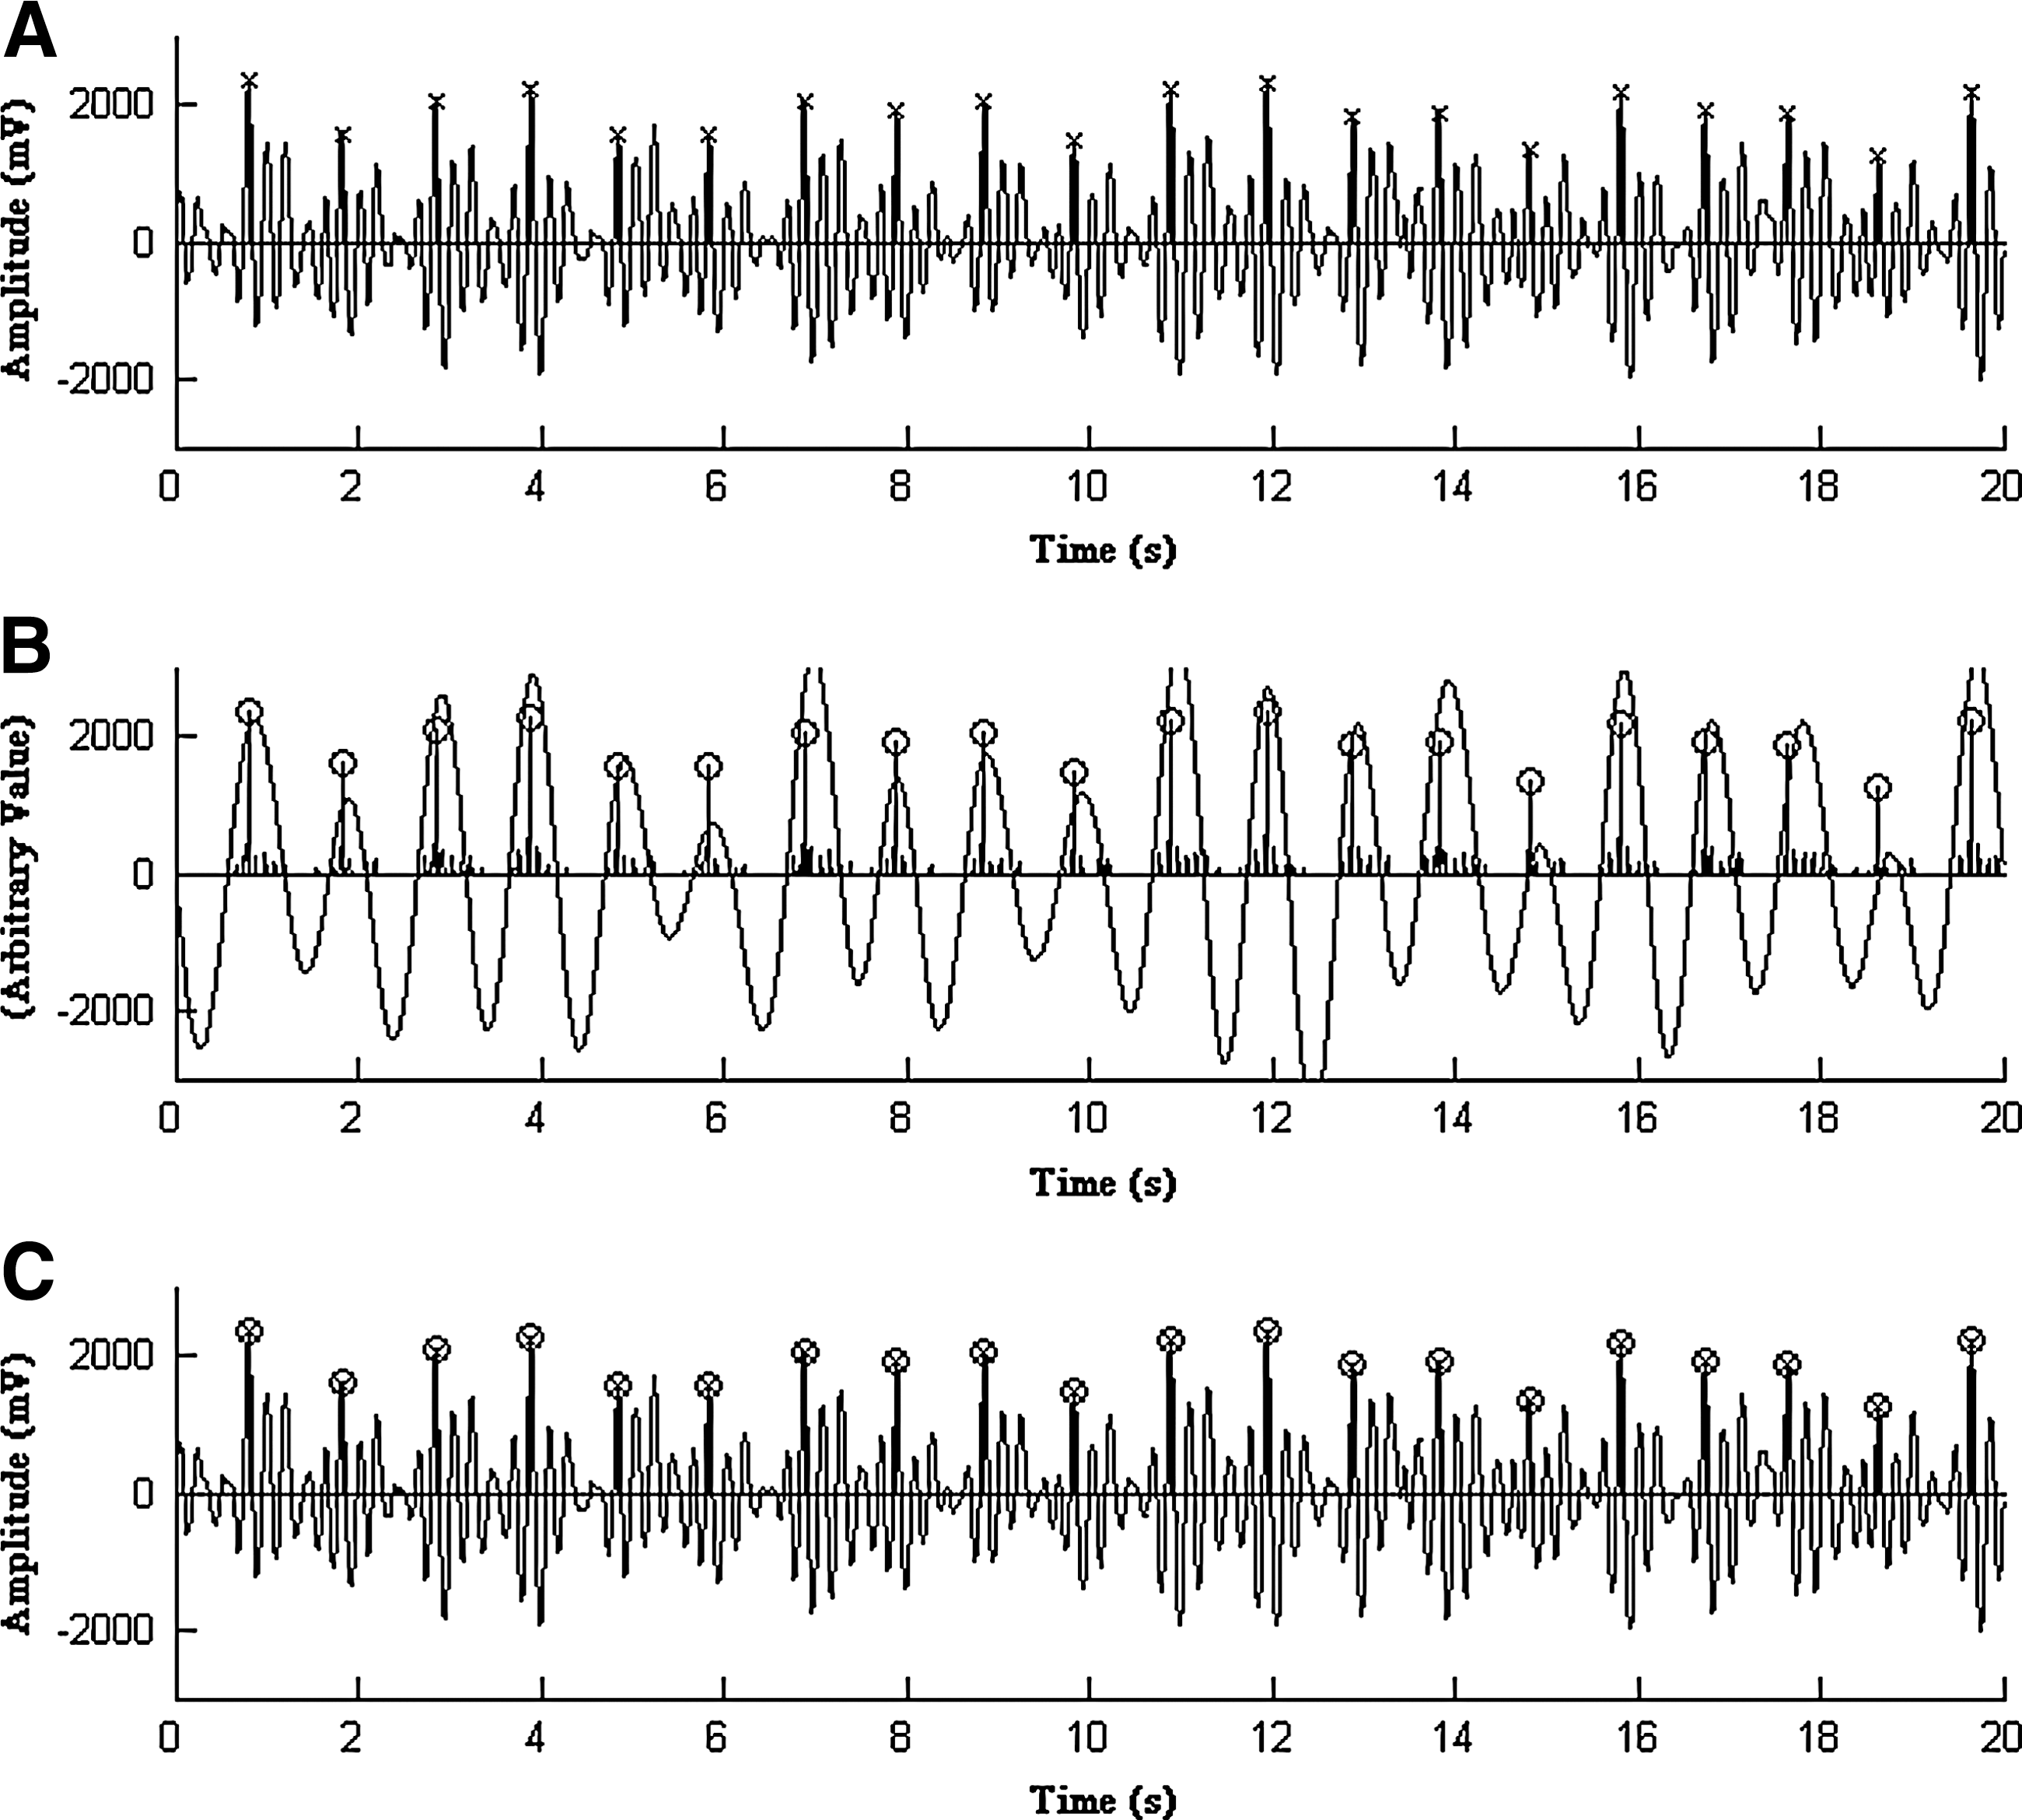
The BCG signal from the smart bed is highly periodic, which can be easily classified into two groups (Fig. 4). Of the two, a peak is the high amplitude part of each signal cycle. Since peaks are generated from forceful contraction of the left ventricle, analyzing the subject's heartbeat is closely related to determining the peak of each cycle. We focused our efforts on the extraction of peaks from the signal.

In an ideal ECG signal, peaks are expressed in the highest amplitude in a periodic cycle. However, during real-world measurements, various forms of peaks were observed even in small portions of the signal. In this situation, peaks cannot be simply detected, particularly when the signal is weak. The BCG signal data is a recording of continuous mechanical vibration, and unfortunately, both an initial impulse and its subsequent residual vibrations are transferred to the weight sensor. The varying residual vibrations resulted in noisy data were difficult to be distinguished from actual peaks. In fact, residual vibrations often showed higher amplitudes than the actual peaks that were related to heart activity. To address this problem, we applied a highly effective peak detection algorithm that was able to interpret noisy signal data. Among numerous peak detection solutions, we chose the AF2 algorithm, because it is particularly effective at analyzing noisy signals. 17,18 A flow diagram (Fig. 5) shows the processing steps of the AF2 algorithm. In the AF2 algorithm, a threshold is determined, which is 0.4 times of maximum value within the window. The signal is then rectified to the positive values. The rectified values are passed through a low-level clipper, which clips low-amplitude values in the window. The first derivatives are calculated among clipped, rectified values. The upper 30% of the first derivatives are chosen to be the peak candidates.
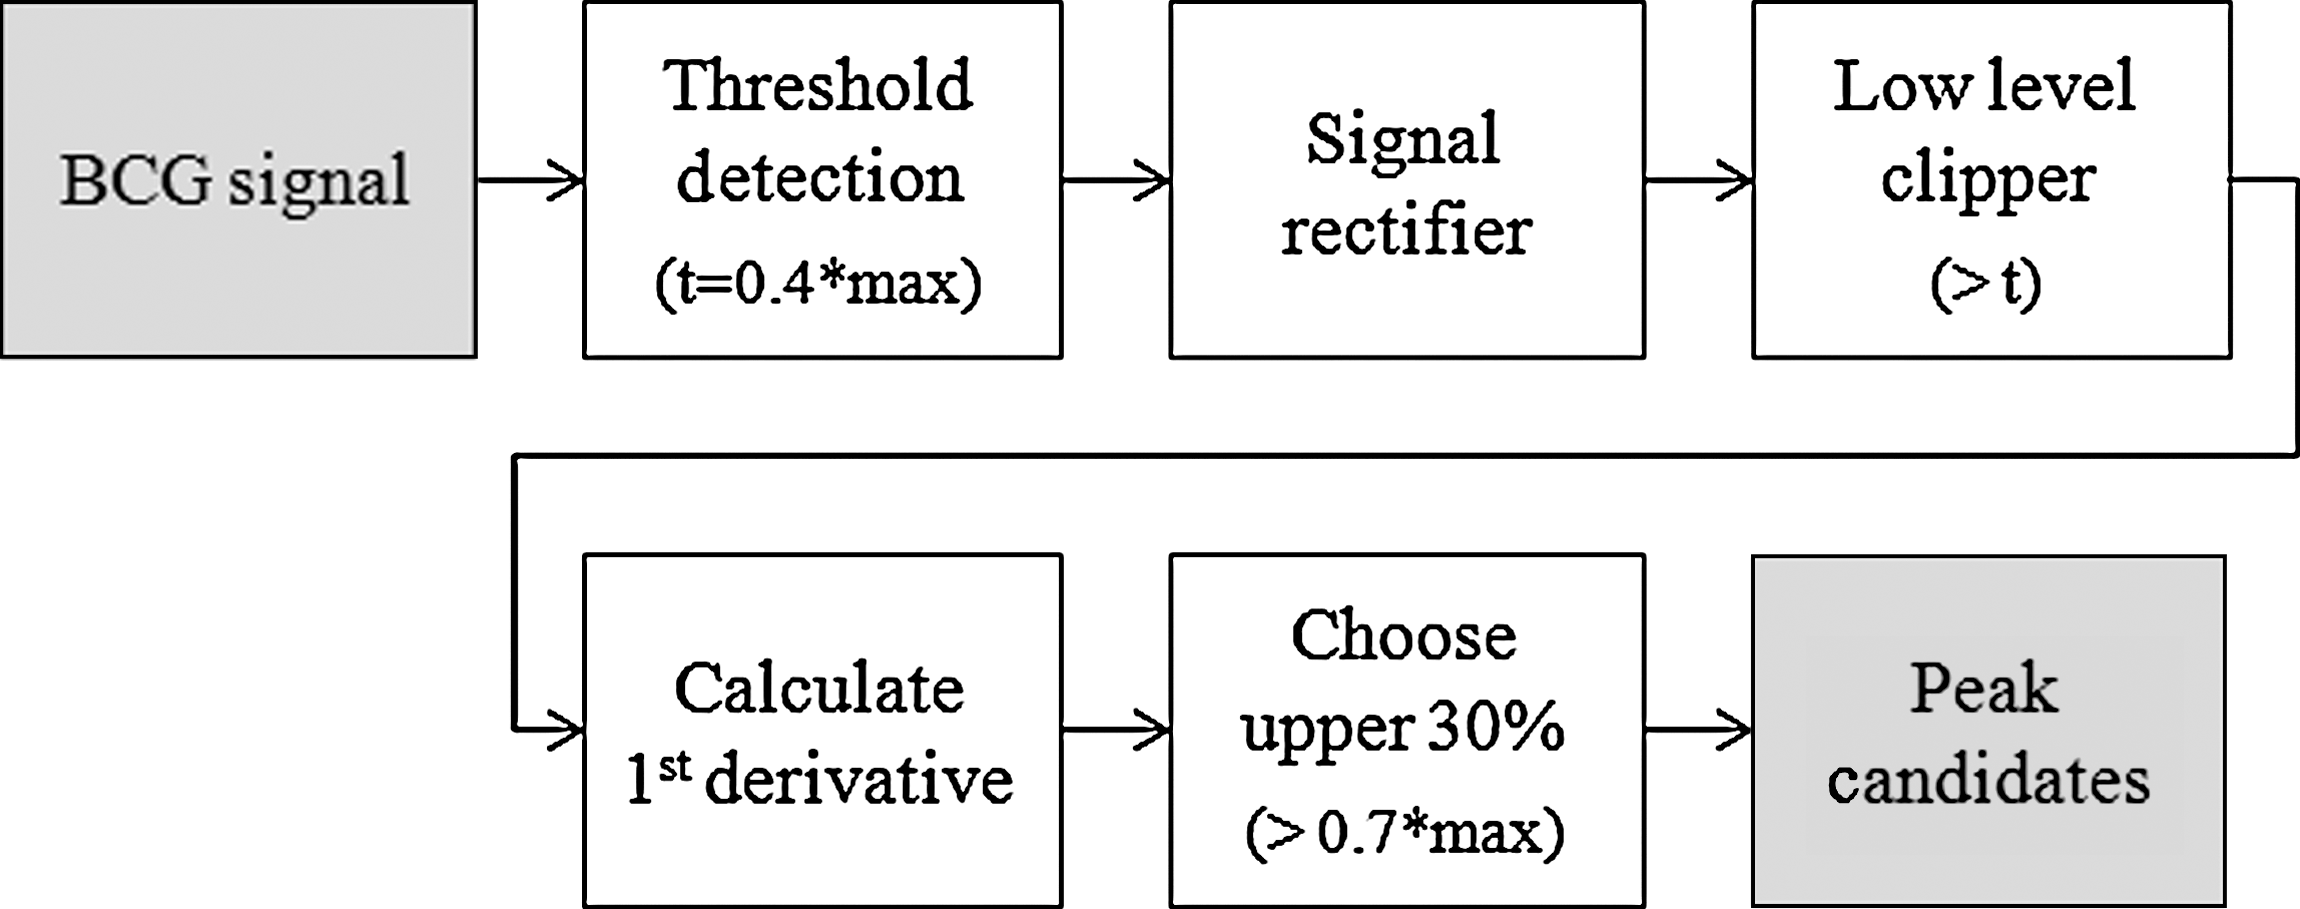
The signal processing steps of AF2 peak detection algorithm.
When the algorithm was applied, multiple peak candidates were detected in a cycle (Fig. 4). Since there can only be one peak for every cycle, we applied a low-pass filter. The cutoff frequency of the low-pass filter was determined by observing intervals between peak groups. After applying the low-pass filter, the signals were then smoothed to show the maximum point of a wave. The first peak around the maximum point was chosen as an anchoring point for calculating heartbeats (Fig. 6).
In the signal data, we observed a number of sections that did not have regular peaks. Two cases were considered to be the main causes of these abnormal sections. The first case was occasional subject absence during the experiment. The empty signal was observed in the case. The other case was a result of the subject's movements during sleep. When a subject's limb or body moves, the subtle vibrations from the cardiac beating is masked. For this reason, the signals in these sections were removed during the preprocessing stage. For the detection of the empty signal, the weight measurement was used to determine whether the subject was in bed. For the detection of body movements, an adaptive threshold was applied. A signal that contained abnormally high amplitudes that exceeded the threshold was classified as movement. The threshold for the noise in body movements was calculated from a 30 s moving window analysis over the signal.
Feasibility Experiment of the Smart Bed
Eleven healthy subjects participated in the feasibility experiment (7 men, 4 women). The subjects were between the ages of 19 and 25 and weighed between 40 and 100 kg (Table 1). Before the experiment, a survey was conducted to collect basic information about their lifestyles and sleeping habits that may have affected the experiment. In addition to the survey, a 5 min ECG study was performed to confirm that the subject was not showing any sign of arrhythmia. Each subject slept 8 h on the smart bed from 11 pm to 7 am for 2 days. To check the adverse effects arising from the unfamiliar environment, each subject slept for two nights with the same setting for the later comparison. As a result, 22 BCG signal recordings were collected.
The Distribution of the Age, Gender, Height, and Weight of the 11 Subjects
After the measurements, collected BCG data were analyzed. Before the feasibility evaluation, the accuracy of the AF2 peak detection algorithm was assessed. AF2 peak detection algorithm and subsequent processing steps were used to recognize heart beats from each cycle of BCG signal. Since the accuracy of the algorithm determines the reliability of the results, the accuracy should be high enough. We prepared 10 min of continuous test signals from each subject's experiment that did not show any movement noises.
Manual peak detection by a human tester was conducted for the evaluation. After the preparation of the test signal, a human tester manually annotated the peak of each periodic cycle. A graphical annotation tool was provided for the manual peak detection (Fig. 7). Evaluation of the AF2 peak detection algorithm was done by matching peaks detected by the algorithm with the peaks that were detected manually. Overall matching score was calculated by counting peaks that appeared at the same location of the plot. We measured the number of correctly matched peaks over the test signals.

Graphical user interface for manual peak annotation. Peak annotation was done by clicking on the signal plot. Annotated peaks were marked with an “o.”
For the feasibility test, the length of the meaningful period was calculated. Signals that exclude abnormalities were classified by meaningful period. If the smart bed can yield a large amount of meaningful period, we consider the system feasible.
Results
The Accuracy of the Signal Processing
In the signal processing stage, peaks were detected from BCG signal. For the evaluation, the peaks detected by the algorithm were matched with peaks detected by a human tester. The detected peaks from both methods showed a high agreement ratio (Fig. 6). We ran our test over 19 test signals extracted from each experimental result, excluding three datasets that were composed primarily of sensor noise. The comparison revealed that 95% of peaks detected by AF2 were matched to those manually marked (10,419 out of 10,968 peaks).
It should be noted, however, that since the signal resolution of 250 Hz is too precise for human annotators to mark the exact point, sometimes peaks marked are actually annotated a few samples out of the real peaks. To address this problem, we allowed a small tolerance of 15 samples. Nineteen test signals were tested with the tolerance, and the results are summarized in Table 2.
The Comparison Results Between Manual Peak Annotation and Automatic Peak Detection by the AF2 Algorithm
The letters after the subject number denote the first and second night of the experiment.
Results of the Feasibility Experiment
Table 3 shows data from all test results of the 11 subjects including the total summed duration of meaningful periods and that of abnormal periods in minutes. The average meaningful periods accounted for 92.8% of total sleep. Length of meaningful periods among the subjects was mostly consistent. However, more than 120 min of noisy sections were consistently observed in the result of subject 10 for two consecutive nights.
The Evaluation Results of the Feasibility Test
The letters after the subject number denote the first and second night of the experiment.
In the final stage of the experiment, heart rate was finally calculated from the analysis of the experimental data (Fig. 8). The gray line in the background shows original measurements, and the solid line plot shows 11-point averaged values of heart rate. From the resulting graph, we can easily observe trends of surrounding heart rate change during sleep.
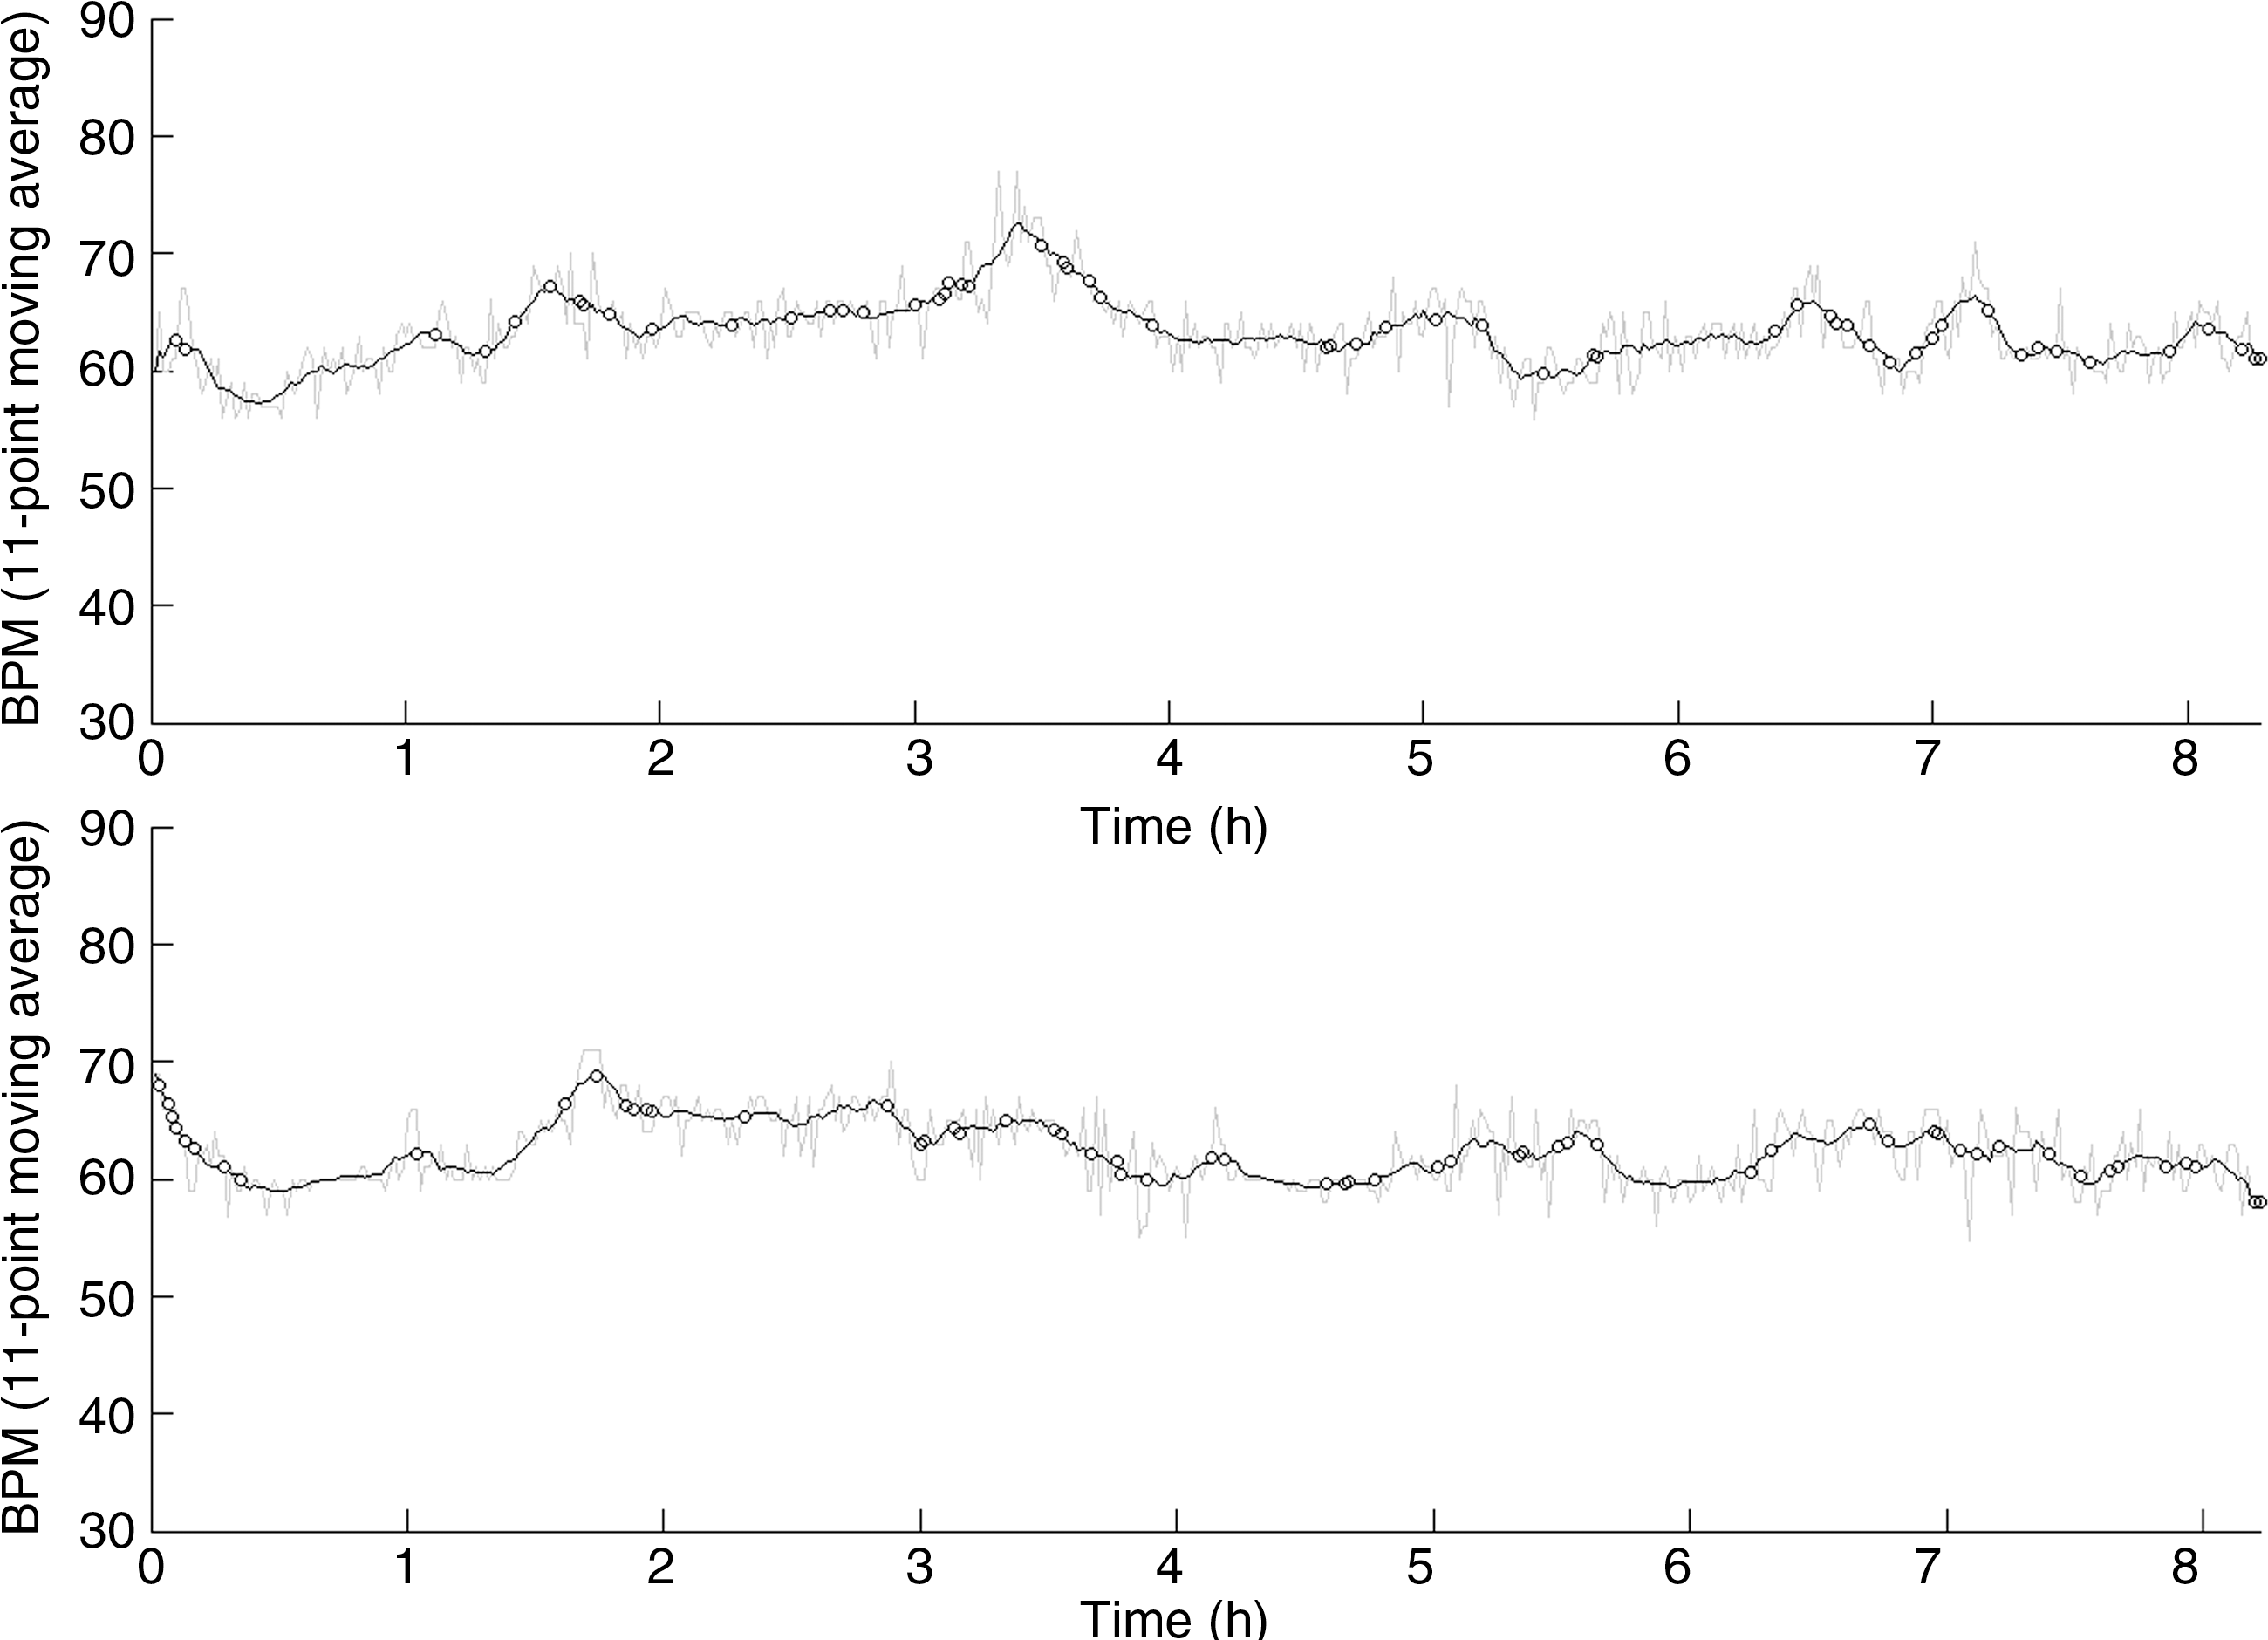
Heart rate of subject 1 calculated from first and second night of the experiment. The small circles on the plot show removed signal sections due to movement.
Discussion
In the evaluation process, three experimental results were excluded because of system issues. One result of subject 4 and two results of subject 6 were excluded from the evaluation, because no discernable signal was observed. The main cause of the problem arose from the contact point between the bed leg and weight sensor. Wooden bed legs are easy to deform, and the weight of the bed was concentrated on the narrow tip of the weight sensor. As a result, the tip of weight sensor proceeded into the bed leg, and signal attenuation appeared. We fixed this problem by reinforcing the bed legs with metal plates.
A low-pass filter was used to smooth a group of peaks and help the algorithm identify the primary peak in a cycle. However, this smoothing process hindered the sensitivity of the algorithm, which resulted in a loss of capability to trace aperiodic or sudden peaks. Since aperiodic peaks frequently appeared in the data of subject 3, the data accuracy for subject 3 was significantly lower compared with the other subjects.
We expected that an unfamiliar sleeping environment would disturb a subject's first night of sleep more than the second night. In contrast to this expectation, the difference in length of the meaningful sleep periods between the first night and second night were small, with an average difference of 1.8%. In subjects 3, 5, 8, and 11, an increase in meaningful sleep periods was observed with regard to the second night.
There were some events that caused subjects to leave the bed for physical needs, such as urination or drinking water. Subjects 3, 5, 10, and 11 reported that they had left the bed during the experiment for these occasions. Despite these occasions, the difference in the meaningful sleep periods were not significant.
In this study, the smart bed was designed to observe heart activity through analyzing BCG signals. In a pathological situation, cardiac dysrhythmia or also known as arrhythmia, the heart beat would be too fast or slow and irregular. In a mild case, the arrhythmia could be merely annoying or even could not be noticed by patients. In a severe case, arrhythmias can cause a life-threatening medical emergency that can result in cardiac arrest and sudden death. 19 The smart bed can help detect this symptom when used with suspected patients.
ECG and BCG methods share many similar properties, so they are usually used for the same purpose, although applied under different conditions. In another pathological situation, there is a case of an electrical depolarization of the heart without synchronous myocardial movement. It is known as cardiac mechanoelectric dissociation or electromechano dissociation. ECG and BCG methods can be applied simultaneously here; electromechano dissociation can be easily detected when there is an electrical signal without mechanical movement. In this case, the smart bed also can be a useful tool when it is conjoined with other monitoring techniques.
Conclusions
We conducted a series of experiments using the smart bed to monitor heart rate during sleep. Heart rate was detected algorithmically by identifying the peaks in the BCG signal recordings. In the experiment, the smart bed measured large volumes of biological signal data easily. The experiment also demonstrated the smart bed capability to provide large proportions of meaningful signals with a high quality. Future research should be directed at analyzing abnormal situations and improving system stability, which will allow the smart bed to be a useful means for long-term health monitoring at home.
Footnotes
Acknowledgments
This work was supported by the Korea Science and Engineering Foundation (KOSEF) and a grant of the Korea Healthcare technology R&D Project, Ministry of Health, Welfare, and Family Affairs, Republic of Korea (A070001).
Disclosure Statement
No competing financial interests exist.