
Abstract
Introduction
Tuberculosis (TB) is a growing problem in South Africa. 1 In 2008 the estimated incidence of all forms of TB was 948 cases per 100,000 people and the estimated incidence of new sputum smear-positive pulmonary TB cases has increased from 141 per 100,000 people in 1997 to 358 per 100,000 in 2007. 2 This increase in disease burden has occurred despite an increase in total expenditure on TB control from approximately US$ 1,000 per patient in 2005 to US$ 2,000 per patient in 2008. 3
Directly observed treatment short-course (DOTS) regimen is the cornerstone of controlling TB. One of the aims of DOTS is to ensure patient medication compliance. Approximately 10%–15% of patients in South Africa default on treatment and treatment success rates remain low. 4,5 Failure of compliance is associated with the development of multiple drug-resistant TB (MDR-TB), the prevalence of which increased from 1.8% in 2004 6 to 9.6% in 2011. 7
Facilitating cost-effective delivery of healthcare services is a key objective of telemedicine in developing countries. 8 Emerging good practice suggests that a combined approach, integrating human “face-to-face” support with technology that improves communication, may provide advantages for TB-control programs. Short message service (SMS) technology has been used to support patient adherence in a number of TB-related projects. 9 Smart pill boxes have also been used to attempt to improve compliance. Of eight different devices described in a review of “Smart-Pillboxes” designed to improve medication compliance, 10 one included a capability of uploading data to an online database. None of the eight devices provided for real-time communication to treatment supporters in the event that the patient persistently failed to open the pill bottle at the correct time.
The SIMpill® system (Simpill Pty Ltd., Western Cape, Cape Town, South Africa) is a cellular telephone SMS-based medical adherence support (MAS) system developed in South Africa. It consists of a device that attaches to a standard pill bottle or blister pack and communicates with a Web-based application by SMS every time the patient opens the bottle or removes a tablet from the blister pack. This is taken as a surrogate marker of the patient taking their medication. The solution enhances existing SMS-alert systems by only sending SMSs when patients do not take the medication (open the bottle or use the blister pack) as prescribed. 11 A patient motivated to “fake” adherence, however, can cheat the system.
Caregivers discuss medication schedules with patients and agree reasonable time windows within which each dose should be taken. This information is entered into a Web-based application that stores a profile of each patient and collects information about medication events each time the MAS device is opened. By comparing medication events with expected time windows, the application detects noncompliance and provides appropriate SMS notifications to patients and caregivers in real time. Patients require only a few minutes of direction to ensure that they are able to operate the device correctly.
The Web-based application collects and reports compliance information. Patients and approved healthcare professionals or analysts can be given access to real-time information regarding medication use and compliance through a private secure account on a Web site. Healthcare providers can monitor utilization patterns in real time to help identify interventions that might support adherence, make changes to patients' medication schedules, and generate compliance reports. The SMS notifications can be complemented with email notifications.
If medication is taken outside the prescribed times, an SMS is sent to the patient advising of the mistake and reminding the patient when the next prescribed medication event should take place. If the SMS reminder fails to prompt the patient to take their medication, an SMS can be sent to a person identified by the patient when they registered with the program, such as a family member or home-based caregiver. Additional escalation levels can be added if necessary and an SMS sent to the professional nurse responsible for supervising home-based caregivers. This allows prioritization of patients requiring additional support. The system monitors medication refills and additional SMSs can be sent to the pharmacy or clinic to advise that the patient will soon need a new prescription.
Habituation, the decreased behavioral responsiveness caused by repetitive stimulus, 12 is avoided by not sending an SMS if medication is taken as prescribed. Kenyan investigators sending scheduled SMSs to improve antiretroviral treatment adherence site habituation as the reason that weekly SMS reminders improved adherence by 13%, whereas daily reminders resulted in no improvement. 13
In 2008, the South African National TB Treatment Program budget was US$ 7.2 per capita while the total cost for TB control was US$ 12 per capita. Treatment adherence in South Africa is poor, resulting in retreatment and the development of MDR-TB and more recently, extensively drug-resistant TB (XDR-TB). 14,15 This further increases treatment costs.
In 2005 a limited pilot project was undertaken at a clinic in the Northern Cape Province, using the MAS device as an addition to standard DOTS. Cost effectiveness of the pilot was never assessed. The local department of health is now considering implementing an MAS solution in the expectation of improving outcomes and managing costs.
Before considering wider implementation of this type of electronic treatment adherence support, the related costs and benefits, if any, need to be calculated. E-health economic assessment is complex. 16,17 Telemedicine economic evaluations remain rare 18 and few are conducted in accordance with standard evaluation techniques. 19 Challenges to adequate economic evaluation include frequently inadequate sample sizes, complexities of valuating health and nonhealth outcomes, and rapidly changing technology. 20 No literature has been found that proposes or evaluates a structured method of comparing the return on investment (ROI) obtained from conventional DOTS with that achieved by integrating DOTS with real-time SMS adherence support.
The study examines the costs and health outcomes of a pilot implementation of an MAS solution and compares it with a control group supported by conventional DOTS methods only. The appropriateness of the ROI method for evaluating MAS solutions in a developing world setting, where data are often limited, is discussed.
Background
To avoid confusion, terminology is defined.
Cost effectiveness analysis (CEA) expresses results in a single dimension such as “per lives saved” or “per pain free day” to enable direct comparison. 21
Cost-utility analysis (CUA) aims to overcome the one-dimensional limitations of a CEA by using utility-based outcome units to compare different interventions. 22,23 Utilities are cardinal values assigned to health states 24 based on a scale of 0 to 1, where 0 represents death and 1 perfect health. Utility can be expressed in “quality adjusted life years.”
Cost-minimization analysis (CMA) is used to compare two interventions and identify which is least costly. It is applicable when interventions are expected to have similar outcomes. 25 CMA is less complex than CEA, which includes both costs and outcomes of treatments and is sufficient if the outcomes for each intervention are equivalent. Since few procedures are likely to have the same outcome, CMAs are considered to be of limited use. 26
Cost benefit analysis (CBA) is a highly flexible method of economic evaluation 27 that has been described as “the methodological foundation for turning theory into a pragmatic evaluation tool.” 28 It aims to measure both costs and consequences in monetary units. 21 Approaches such as the Cost-Effects-Utility-Benefits model of Drummond et al. 29 combine elements of all the previous methods. The ROI analysis considers the impact of an investment.
The application of CEA, CUA, or CBA can be challenging in the developing world setting where accurate patient follow-up is often difficult or incomplete and adequate data are not readily available. 30 To overcome this, this study utilizes CMA as a precursor to a more definitive study. CMA is used to arrive at a cost comparison between patients using the MAS and the controls. ROI assessment calculates discounted break-even analysis and net present value (NPV). Direct and indirect costs and benefits are included. Intangible costs and benefits are not considered. Health outcomes are assessed to establish whether extension to CEA will be of value.
Until recently, few reports have evaluated the use of telemedicine in live projects, despite considerable literature describing the potential value of telemedicine in developing countries. 31 A review of telemedicine experience in the developing world emphasizes that cost effectiveness is a fundamental aspect of the introduction of telemedicine and cautions that very few studies were found in which the topic was addressed. 32 This study proposes evaluation of costs and health outcomes as a precursor to more extensive analysis, utilizing data that are usually readily available and a method that allows for a less cumbersome though useful assessment to be conducted. Expansion to full CEA or CBA, which requires considerably more data and expertise, will be appropriate for selected studies.
Methods
A pilot study utilizing the MAS device was undertaken at the Betty Gaetsewe Clinic located near Kimberly in the Northern Cape Province of South Africa in 2005. The Northern Cape is one of nine provinces in South Africa. It has a relatively stable population recorded as 2.3% of the country in 2005 and 2.2% in 2010 33 served by 34.3 doctors per 100,000 people. 34 Data were obtained from officials of the Northern Cape Department of Health and Betty Gaetsewe Clinic.
Twenty-four outpatients were enrolled in the MAS study group, the maximum number permitted by the funding allocated to the pilot by the Department of Health. All were new smear-positive TB patients who commenced the 6-month treatment regimen on first line anti-TB medication during 2005. Entry to the study was voluntary and subjects were sequentially enrolled during 1 month. Illiterate patients, reinfected patients, and patients without mobile phones were excluded. The average number of patients seen per month during 2005 was 21.
Frequency matching was utilized to match the MAS pilot participants with controls in a 4:1 ratio. Controls were selected from new smear-positive TB patients who presented to Betty Gaetsewe Clinic and commenced the 6-month treatment on first line anti-TB medication during the time that the MAS pilot was running. It was not possible to match the month in which the MAS cohort started treatment since all the eligible patients presenting during the month were enrolled in the pilot. Patient records for the months during the time that the MAS pilot was running were examined to identify controls who were frequency matched for TB treatment, local clinic, and gender and age.
Six of the study group died of acquired immune deficiency syndrome (AIDS)–related illness during the study. An attempt was made to identify controls who had died during treatment, to match for this potential confounder; however, none of the controls identified were found to have died. Clinic personnel believed that this was because the folders of patients who died are removed from the clinic, stored elsewhere, and because of the elapsed time could no longer be retrieved. The analysis was therefore split into two scenarios as follows: (1) scenario one included all 24 MAS patients and their 96 controls and (2) scenario two excluded the six MAS patients who died, along with their 24 matched controls, thereby reducing the cohorts to 18 MAS patients and their 72 controls.
Costs were calculated for the treatment of new smear-positive drug-sensitive patients, retreatment of drug-sensitive patients, and treatment of MDR-TB. For the purpose of this evaluation, XDR-TB was not considered since at the time of the study there was only one case in the entire Northern Cape Province and none at Betty Gaetsewe Clinic.
Financial values are shown in South African Rand (ZAR) and United States Dollar (US$). Exchange rates were US$ 1=ZAR 6.60 (June 1, 2005) and US$ 1=ZAR 7.69 (June 1, 2010). Statistical analysis of the differences in outcomes between the groups was conducted using two-tailed Fisher's exact test with alpha set at 5%.
The data are applied to two hypothetical implementations, each utilizing 1,000 MAS devices to support DOTS with new smear-positive TB patients. One hypothetical implementation starts mid 2005 and the other mid 2010. Discounted break-even analysis is utilized to determine the duration of implementation required until the net revenue stream is positive and to derive the NPV for the hypothetical implementation. The NPV is a technique used to determine today's value of a proposed intervention. It is the sum of discounted net benefits over time. These net benefits are the sum of a series of cash flows, both incoming and outgoing, discounted to convert future benefits into present values. 35
Results
The demographics of the subjects and their controls in scenarios one and two are shown in Table 1.
Participant Demographics
MAS, medical adherence support; SD, standard deviation.
Costs
The costs are determined by direct comparison of the costs of each group of patients. The average costs per patient in each group are summarized in Table 2.
Summary of Average Cost per Patient (Values in South African Rand)
Healthcare personnel costs are derived by multiplying the average time each personnel type allocates per TB patient by the total cost-to-employer for each personnel type.
For the calculation of projected costs, the cost of the MAS device is based on a rental model thereby eliminating concerns about the potential lifespan of a device. Although new smear-positive patients are put on a standard 6-month treatment regimen, the possibility of delays due to battery changes and maintenance results in the average utilization per device taking more than 6 months. For the purposes of this study the average number of clients serviced by one device per year was set at 1.71. This is calculated by assuming that each device will serve a TB patient for 6 months, after which 1 month will be allowed for the device to be serviced, repaired, and prepared for the next patient.
The average medication costs for the different drug-sensitivity profiles at the time of study were ZAR 295.58 (US$ 44.78) for drug-sensitive new smear-positive patients, ZAR 1,732.17 (US$ 262.45) for retreatment of drug-sensitive patients, and ZAR 27,117.28 (US$ 4108.68) for treatment of MDR-TB. The large treatment cost difference between TB and MDR-TB patients is the dominant cost driver that results in cost savings when MDR-TB cases are reduced, despite the additional technology investments required.
The retreatment rate varied considerably between MAS and control cohorts. No subjects in the MAS group required retreatment, while 16.7% of the control group of scenario one and 19.4% of the scenario two controls required retreatment. This becomes significant because retreatment requires the patient to undergo an additional 9 months of treatment, with intramuscular Streptomycin injections being administered daily at the local clinic. The additional cost of the medication, as well as the human resource allocation, is an important element of the costing analysis.
MDR-TB is more expensive to treat than TB that is susceptible to either first line or second line (with the addition of Streptomycin) treatment regimens. A costing line is therefore also allocated to the MDR rate. No MAS cohort patients developed MDR-TB. Since patient-specific data were not available on progression of the control subjects to MDR, this was estimated using the MDR incidence of 1.7% 36 reported by government officials for the region in which the study took place and used for projected costing. The prevalence of MDR-TB has risen in the Northern Cape from 164 cases in 2005 to 482 in 2010. 37 It appears that good adherence among new smear-positive cases may be protective against MDR-TB in much the way that adherence was found to ensure that patients did not require retreatment.
For the purpose of this evaluation, XDR-TB was not considered.
Effects
The effects (health outcomes) evaluated were the smear conversion rate after 2 months of treatment, the treatment outcome after completing treatment (where negative sputum in the last month of treatment was regarded as treatment success or cure) and the MDR-TB rate. For both of the participant scenarios, the MAS pilot group was compared with the corresponding control group using the Fisher's exact two-tailed test. The results are summarized in Table 3.
Treatment Outcomes
Break-Even Analysis
Break-even analysis is used to determine the theoretical point in time from starting a hypothetical implementation of 1,000 MAS devices, to the time that the deployment will have generated benefits equal to cost (T R=T C). Present value tables are used to discount annual figures and inflation is set at 8% per annum. The figures used for the break-even analyses are shown in Tables 4 and 5, for hypothetical implementations starting in 2005 and 2010, respectively.
Break-Even Analysis, 2005–2010 (Values in South African Rand)
ROI, return on investment.
Break-Even Analysis, 2010–2014 (Values in South African Rand)
Break-even analysis is of little relevance in this study, which shows a positive net stream from the first year of implementation for both the 2005 and 2010 hypothetical starting points. There is therefore no break-even point. The break-even analysis and discounted break-even analysis for each hypothetical implementation are shown in Figures 1 –4.
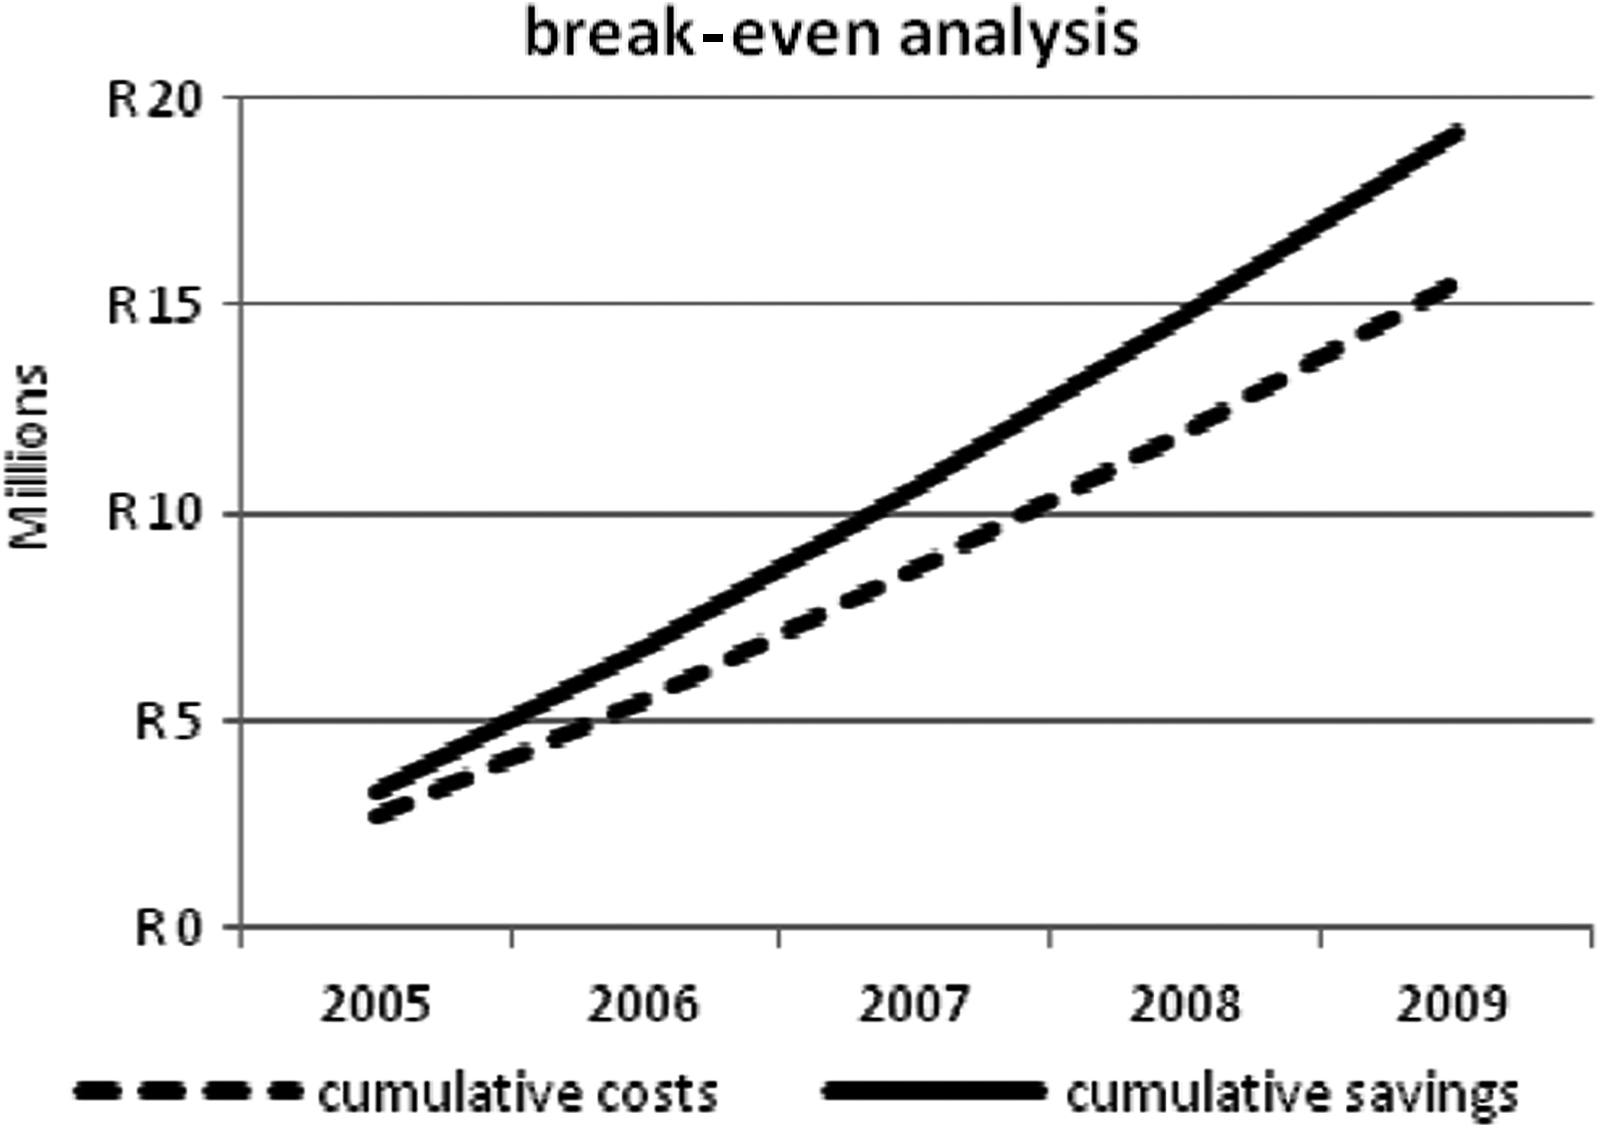
2005–2009 break-even analysis.

2005–2009 discounted break-even analysis.

2010–2014 break-even analysis.

2010–2014 discounted break-even analysis.
Net Present Value
NPV of the hypothetical deployment of 1,000 MAS devices is the sum present position of the time series of cash flows for the period. NPV>0 is regarded as a promising prospect and NPV<0 an unjustified investment. For this analysis the lifespan of an MAS project is estimated to be 5 years and present value tables are used to discount annual figures.
For a theoretical implementation of 1,000 units in the Northern Cape Province, the net stream for both the 2005 and the 2010 starting points was positive from the first year of implementation. Discounted NPV for the hypothetical implementation starting in 2005 was ZAR 3,255,256 (US$ 493,221) while starting in 2010 resulted in a discounted NPV of ZAR 4,747,636 (US$ 487,339). This is an ROI of 23% over the 5-year period.
These calculations assume that the incidence of MDR-TB remained at 1.7% for the duration of the projects and that there is no extreme drug-resistant TB. Since these rates both escalate after 2005, incorporation of these additional variables would increase the NPVs.
Discussion
Full economic assessments of e-health interventions, using methods such as CEA or CBA, are difficult 38 and analysis should be performed from several perspectives, that of the patient, funder, society, healthcare provider, and insurer. 39 This study looks only from the perspective of the health service provider, in this case the government. The results suggest that there is a greater ROI when the MAS solution is used in combination with DOTS than when using DOTS alone. This can be measured in the health outcomes as well as in the average cost per patient borne by the health authorities.
The possibility of using the solution to help caregivers to prioritize patients with poor adherence, thereby freeing up additional caregiver time to be utilized by other healthcare programs, such as support for people living with AIDS, is not evaluated in this study. It may be reasonable to assume that this advantage would enhance the ROI achieved when implementing the MAS solution and further study to evaluate this aspect of the solution would be of value.
XDR-TB was not included in this analysis. The number of cases has since increased nationally from 74 in 2004 to 419 in 2006 40 and inclusion will become relevant in a current evaluation of the MAS solution, as a complication that increases when adherence is poor. Inclusion of XDR-TB in the costing model will further enhance the benefits of the MAS solution. The treatment of XDR-TB is estimated to cost four to five times more than treating MDR-TB. 41
The improved treatment adherence that the MAS solution appears to support is likely to have benefits beyond those evaluated in this study. The public health benefits of improved cure rates are an overall decrease in disease incidence. In the case of infectious disease such as TB, improved cure rates will reduce the risk to citizens of contracting TB in their communities due to exposure to organisms coughed up by patients with active pulmonary disease. This will be of particular significance for people living with human immunodeficiency virus.
The study proposes a methodology whereby public health planners in the developing world can use relatively accessible data to evaluate whether a potential investment in treatment adherence technology will yield positive returns on the investment and whether further analysis using CEA or CBA is justified.
Economic assessment was not considered when the pilot study was implemented in 2005. This causes obvious limitations. It is not a randomized control study, has a small sample size dictated by the budget made available for the pilot, and there is limited possibility to generalize the findings to evaluation of other e-health applications or other countries. Discount rates are not discussed and time delay between the pilot and the analysis may reduce the accuracy of some cost estimations. Expansion of this study to CEA or CBA maybe justified. This will address the impact on caregivers, costs of change, optimism bias, sensitivity analysis, and risk assessment to arrive at a full assessment of the potential value of the MAS.
Despite these limitations, the CMA findings may be of value to public help health planners contemplating economic evaluation of e-health pilot projects in low-resource settings to make more informed decisions when allocating scarce resources.
Footnotes
Acknowledgments
The authors wish to thank the personnel of Betty Gaetsewe Clinic for their assistance with data collection. These dedicated professionals serve patients suffering from TB in the Northern Cape Province with passion and humility.
We also wish to acknowledge the support and motivation provided by the Northern Cape Department of Health Director of TB Services, Ms. Phyllis Baitsiwe.
Disclosure Statement
No competing financial interests exist.