
Abstract
User satisfaction analyses in synchronous telemedicine and teleconsultation environments have been widely performed and generally show satisfied users. In the field of asynchronous telemedicine, however, satisfaction studies were performed only in one single location or with a restricted set of users. With the aim of offering an exemplar evaluation of the impact of the statewide use of a large-scale asynchronous telemedicine network on the satisfaction of the involved users, this study presents the results obtained from a survey of the perceived quality of the service by both patients and healthcare staff. For this purpose, a survey with satisfaction questionnaires was performed with 564 patients from seven upstate municipalities and 56 healthcare professionals from 46 municipalities, using a methodology from the process improvement field. The collected data were quantified and underwent statistical analysis, which showed a clear perception of the improvement in the quality of service by both patients and healthcare professionals. The present findings also showed that both patients and healthcare professionals felt that introducing these new technologies was a positive step, even in upstate areas and when they involved great changes in the usual processes of primary care.
Introduction
This evaluation survey was applied to a statewide telemedicine system in the Brazilian State of Santa Catarina. Located in southern Brazil, the State of Santa Catarina, with a population (2010) of 6,248,436, covers a geographic area of 95,703,487 km2 and is comparable to medium-sized European countries. The 293 municipalities are organized into 33 counties. With a population density of 65.29 inhabitants/km2, this state presents one of the densest and most evenly distributed populations in Brazil. Because of the centralization of medical staff and equipment in the coastal area and a few larger upstate cities, patients from upstate typically need to travel long distances by ambulance or by helicopter when they seek medical treatment, an additional cost for the state health system. A context box, showing the location of Santa Catarina in Brazil, is shown (as an inset) in Figure 1b.
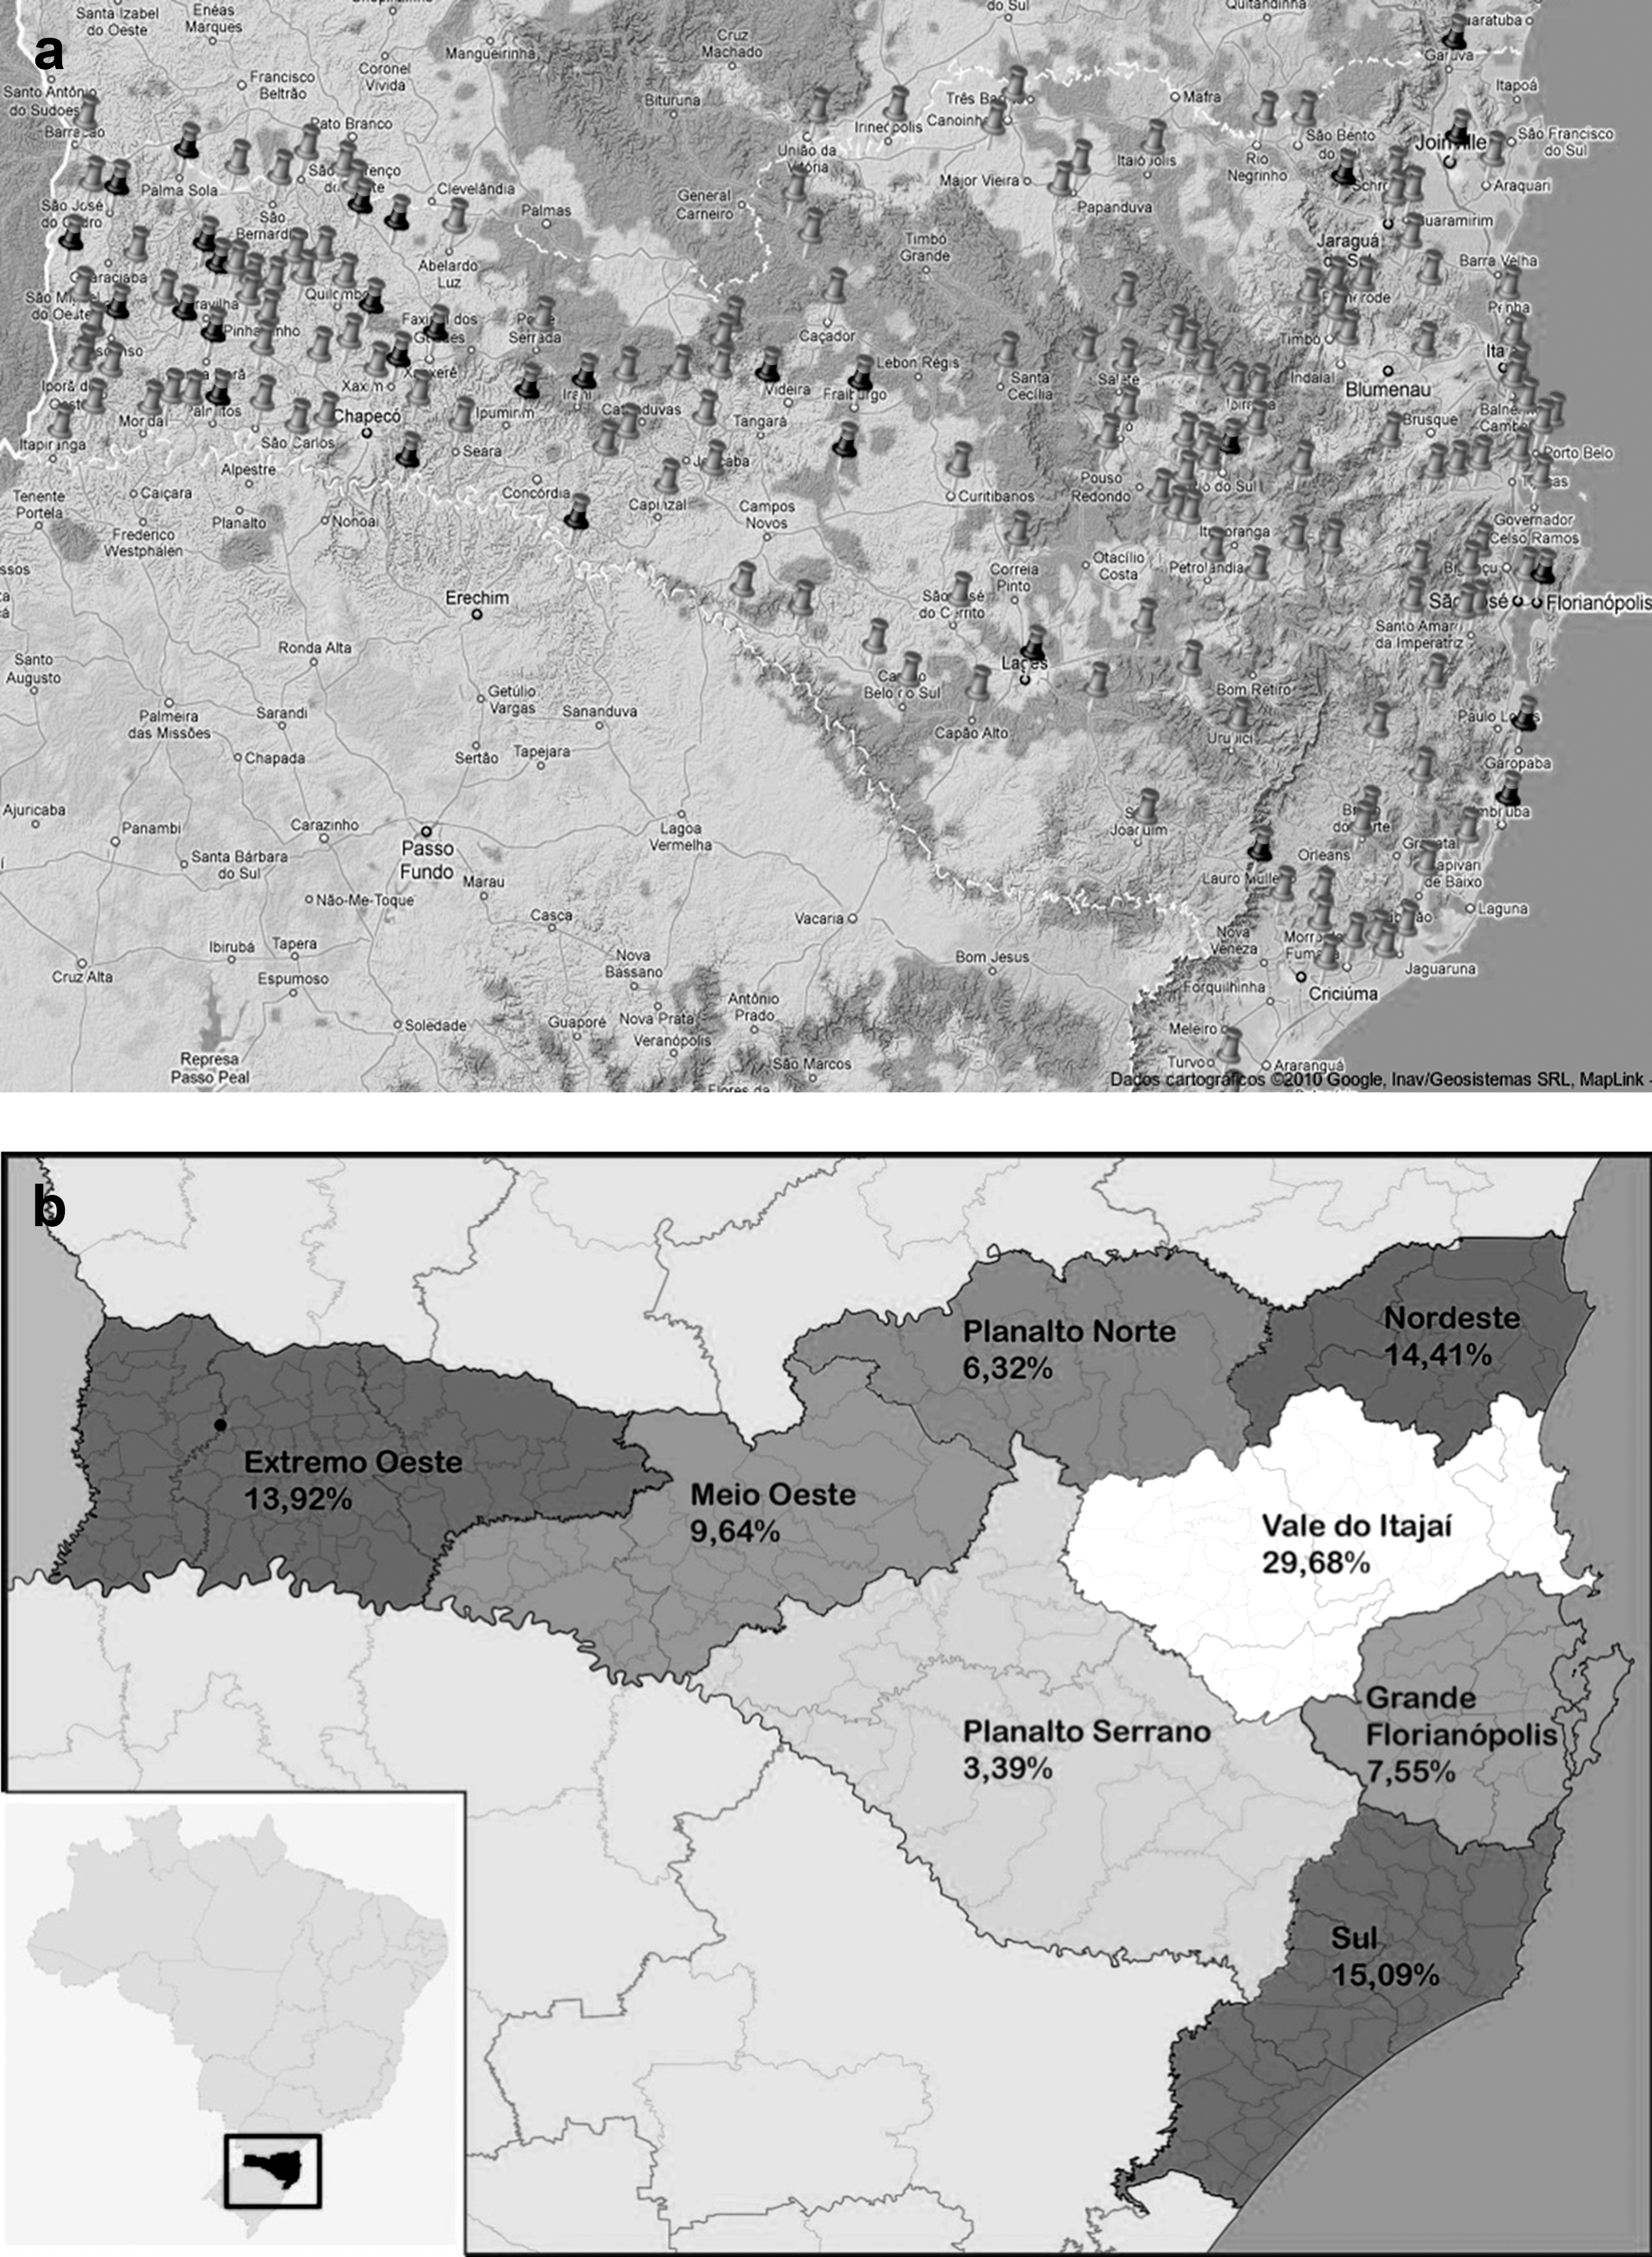
Geographic contextualization of the Santa Catarina Integrated System of Telemedicine and Telehealth.
In May 2005, the State of Santa Catarina began operating the Santa Catarina Telemedicine Network (Rede Catarinense de Telemedicina [RCTM]) as part of the government's plan to decentralize services in the State. 1 During its 5 years of operation, the Network has grown, now offering distance exam services in 287 municipalities and at 360 sites, with approximately 53,000 consultations performed monthly and over 1 million examinations in its database so far, as shown in Figure 1a. In September 2010, the RCTM and the Brazilian Telehealth Program of Santa Catarina were integrated, forming the Santa Catarina Integrated System of Telemedicine and Telehealth (Sistema Integrado Catarinense de Telemedicina and Telessaúde [STT]), which uses an integrated software platform specifically developed for this purpose by the Federal University of Santa Catarina. 2 The STT offers services at a distance, ranging from highly complex exams, such as magnetic resonance imaging, to clinical analyses, as well as continuing education and support services. It involves the active participation of more than 5,400 health professionals. The existence of a telemedicine and telehealth operation on the scale of STT's raises many questions about the adequacy of a model based on a single, specifically developed software and its impact on both patients and health professionals. The study described here analyzes one aspect of this issue: the perception of service quality.
We based this study on two widely referenced systematic literature reviews related to levels of satisfaction with telemedicine and telehealth, which involved 32 and 93 studies of satisfaction levels, respectively. 3,4 The STT is an essentially asynchronous telemedicine system, also referred to as a store-and-forward system. However, the overwhelming majority of the studies of satisfaction analyzed in the reviews were performed in synchronous telemedicine contexts and were almost all based on situations identified as teleconsultation via videoconferencing, which was not an object of our study. In one isolated review, we could identify six studies of satisfaction in asynchronous telemedicine environments, amounting to 7% of the studies reviewed, covering much different areas such as radiology, cardiology, dermatology, orthopedics, endocrinology, and gynecology. 4 Among these studies, we could identify only one that involved a significant sample size (121 telecardiology cases); this study, however, involved only one health institution in a single location and was not executed in the context of a network of institutions. 5 Besides, most studies involving patient or staff satisfaction with telemedicine services focused on specialties, even if some of these specialties were provided in primary healthcare facilities, such as dermatology consultations. 3,4 Very few focused on primary care, and no study at all, as far as we know, was performed in the context of a public statewide telemedicine network encompassing from family telehealth up to tertiary-care telemedicine. 6 Our study focused on two specific services—telecardiology and electronic delivery of lab results—but these are provided as part of a much broader spectrum of services.
Thus, considering the teleconsultation-oriented characteristics of most user satisfaction studies found in the literature and the limited scope of the few user satisfaction with asynchronous telemedicine studies that could be identified, our study differs from those reported in the literature in that it considers the patients and professionals of an asynchronous telemedicine service and encompasses more than 600 interviews with people at 50 different institutions in more than 40 municipalities.
Methods
This study was based on two surveys:
• A study of satisfaction with the Tele-Electrocardiography Service performed on patients living in remote areas of Santa Catarina.
• A study of satisfaction with the electronic service for reporting exam results from clinical analyses performed by the epidemiological surveillance staff of the municipalities of the interior of Santa Catarina.
To systematize this study, we applied the Goals, Questions, Metrics methodology. 7 Goals, Questions, Metrics is a method of improving processes. It stipulates that, for an objective evaluation of a proposal to improve a determined process, a goal for improvement needs to be identified; this goal is evaluated in accordance with the point of view of the group of people involved, based on a set of questions with objective responses defined by a specific set of metrics. We chose this methodology in order to objectively evaluate patients' and health professionals' levels of satisfaction with the process of telemedicine.
With this focus, we defined the perception of improvement in service quality, from both the patient's and the technical-administrative staff member's point of view, as the evaluation's goal. In practical terms, we defined the following subgroups of evaluation goals:
G1. Perception of improvement in service quality in the performance of electrocardiograph (ECG) exams from the point of view of patients in basic healthcare units (BHCUs) in the interior of Santa Catarina. This evaluation method aimed to evaluate, by means of examples, whether patients felt there was a difference in service quality between exams performed directly at the BHCU versus those performed via telemedicine.
G2. Perception of improvement in service quality in the handling of clinical analysis results in the interior of Santa Catarina from the point of view of the epidemiological surveillance staff responsible for the local distribution of these exam results. This evaluation method aimed to evaluate, by means of examples, whether the technical-administrative staff of the Brazilian Unitary Health System (SUS) involved in handling of the results felt that changes in the process stemming from the use of telemedicine were an improvement in the quality of service.
We defined the following questions as our evaluation questions:
Q1. Did the patient who received a telemedicine exam have the impression that there was an improvement in service compared with the way he or she had been treated previously?
Q2. Did the health professional from the interior who acted as the intermediary in the telemedicine encounters have the impression that there was an improvement in service compared with the way in which the service was previously performed?
For each of these questions, we defined a set of metrics, described below together with the rationale behind them.
The metrics we defined for the study of satisfaction with the Tele-Electrocardiography Service were as follows: waiting time for the exam to be performed, delay in receiving results, the need to travel to another municipality, and overall satisfaction with the service. These metrics generated the questionnaire described in the section on the satisfaction study with the Tele-Electrocardiography Service.
The metrics we defined for the study of satisfaction with the service for the electronic delivery of the results of clinical exams were as follows: delay in receiving results, user-friendliness of the system, and overall satisfaction with the service. These metrics generated the questionnaire described in the section on the satisfaction study with the service of electronic delivery of the results of the clinical analyses.
The metrics for waiting times for the exam to be performed and delay in receiving results were chosen as the main metrics for before/after comparison because previous studies had identified the slowness of the SUS as a consistent source of complaint with regard to the quality of care in Brazil. 8 –10 In order to verify whether there was a statistically relevant difference between the pre-telemedicine and post-telemedicine situation for both of the studies, we used the chi-squared test to compare the pre- and post-telemedicine data on the metrics for which a pre/post evaluation was possible.
Satisfaction Study with the Tele-Electrocardiography Service
The experiment was performed during the second half of 2007 by means of an anonymous written questionnaire about satisfaction; the basic service unit nurse offered patients the questionnaire (see Appendix A) when they came to collect their exam results. We chose to ask patients to fill out the questionnaire at the time they obtained their exam results, after the exam had been performed and the findings communicated, so as, on the one hand, to prevent patients from feeling restrained from offering “positive” responses and, on the other hand, so as to allow them to offer their perception of the “delay” in receiving results, which was one factor in the quality metrics.
The study population consisted of 564 patients who received tele-ECG exams in BHCUs in the municipalities of Abelardo Luz, Camboriú, Curitibanos, Içara, Ponte Serrada, Quilombo, and São Domingos; these are municipalities that are distributed along the coast, in the mountains, and in the far-western part of Santa Catarina. Of these patients, 281 indicated that they had previously had ECG exams. The questionnaire consisted of the questions presented in Appendix A. Figure 1 shows that the distribution of telemedicine-based ECG examinations follows the distribution of telemedicine-enabled healthcare facilities, which reflects the population density, with a small bias towards the extreme west region, which relies more on telemedicine for diagnostic services.
The questionnaire did not include any questions about a delay in receiving the results via telemedicine because the STT was obliged to provide the results of any ECG and imaging exams within 72 h, and BHCU patients who were given tele-ECG exams were instructed to return after 3 days to collect the results. To perform the comparisons, we used the length of times for reports to be registered in the system for the 3,251 tele-ECG exams performed by telemedicine in Santa Catarina during the month of June 2007.
Satisfaction Study with the Service of Electronic Delivery of the Results of the Clinical Analyses
The research was performed during the first half of the year 2010 using an anonymous electronic questionnaire (see Appendix B) applied using a Lime Survey tool installed at the Federal University of Santa Catarina. Fifty-six members of the epidemiological surveillance staff from 46 municipalities from all eight regions of the State participated. The inclusion criterion to be invited to participate in the study was that the epidemiological vigilance had to have produced at least 10 reports using the telemedicine system by the time the study was performed. We contacted the staff of every epidemiological surveillance department that met the inclusion criteria by telephone and asked them to participate in the research. Those who agreed to participate received instructions on how to access and complete the online questionnaire. All staff members using the STT are specially trained and are considered computer and Internet literate, which was one reason this study used an electronic questionnaire. The questionnaire consisted of the questions found in Appendix B.
Results
Satisfaction Study with the Tele-Electrocardiography Service
In this part of the study, we considered the responses of all 564 patients so as to generate graphics for the telemedicine exam. To generate the graphics for the situation experienced by patients prior to telemedicine (Figs. 2a, 3a, and 4a), we used the responses of the 281 patients who said they had previously had an ECG exam.
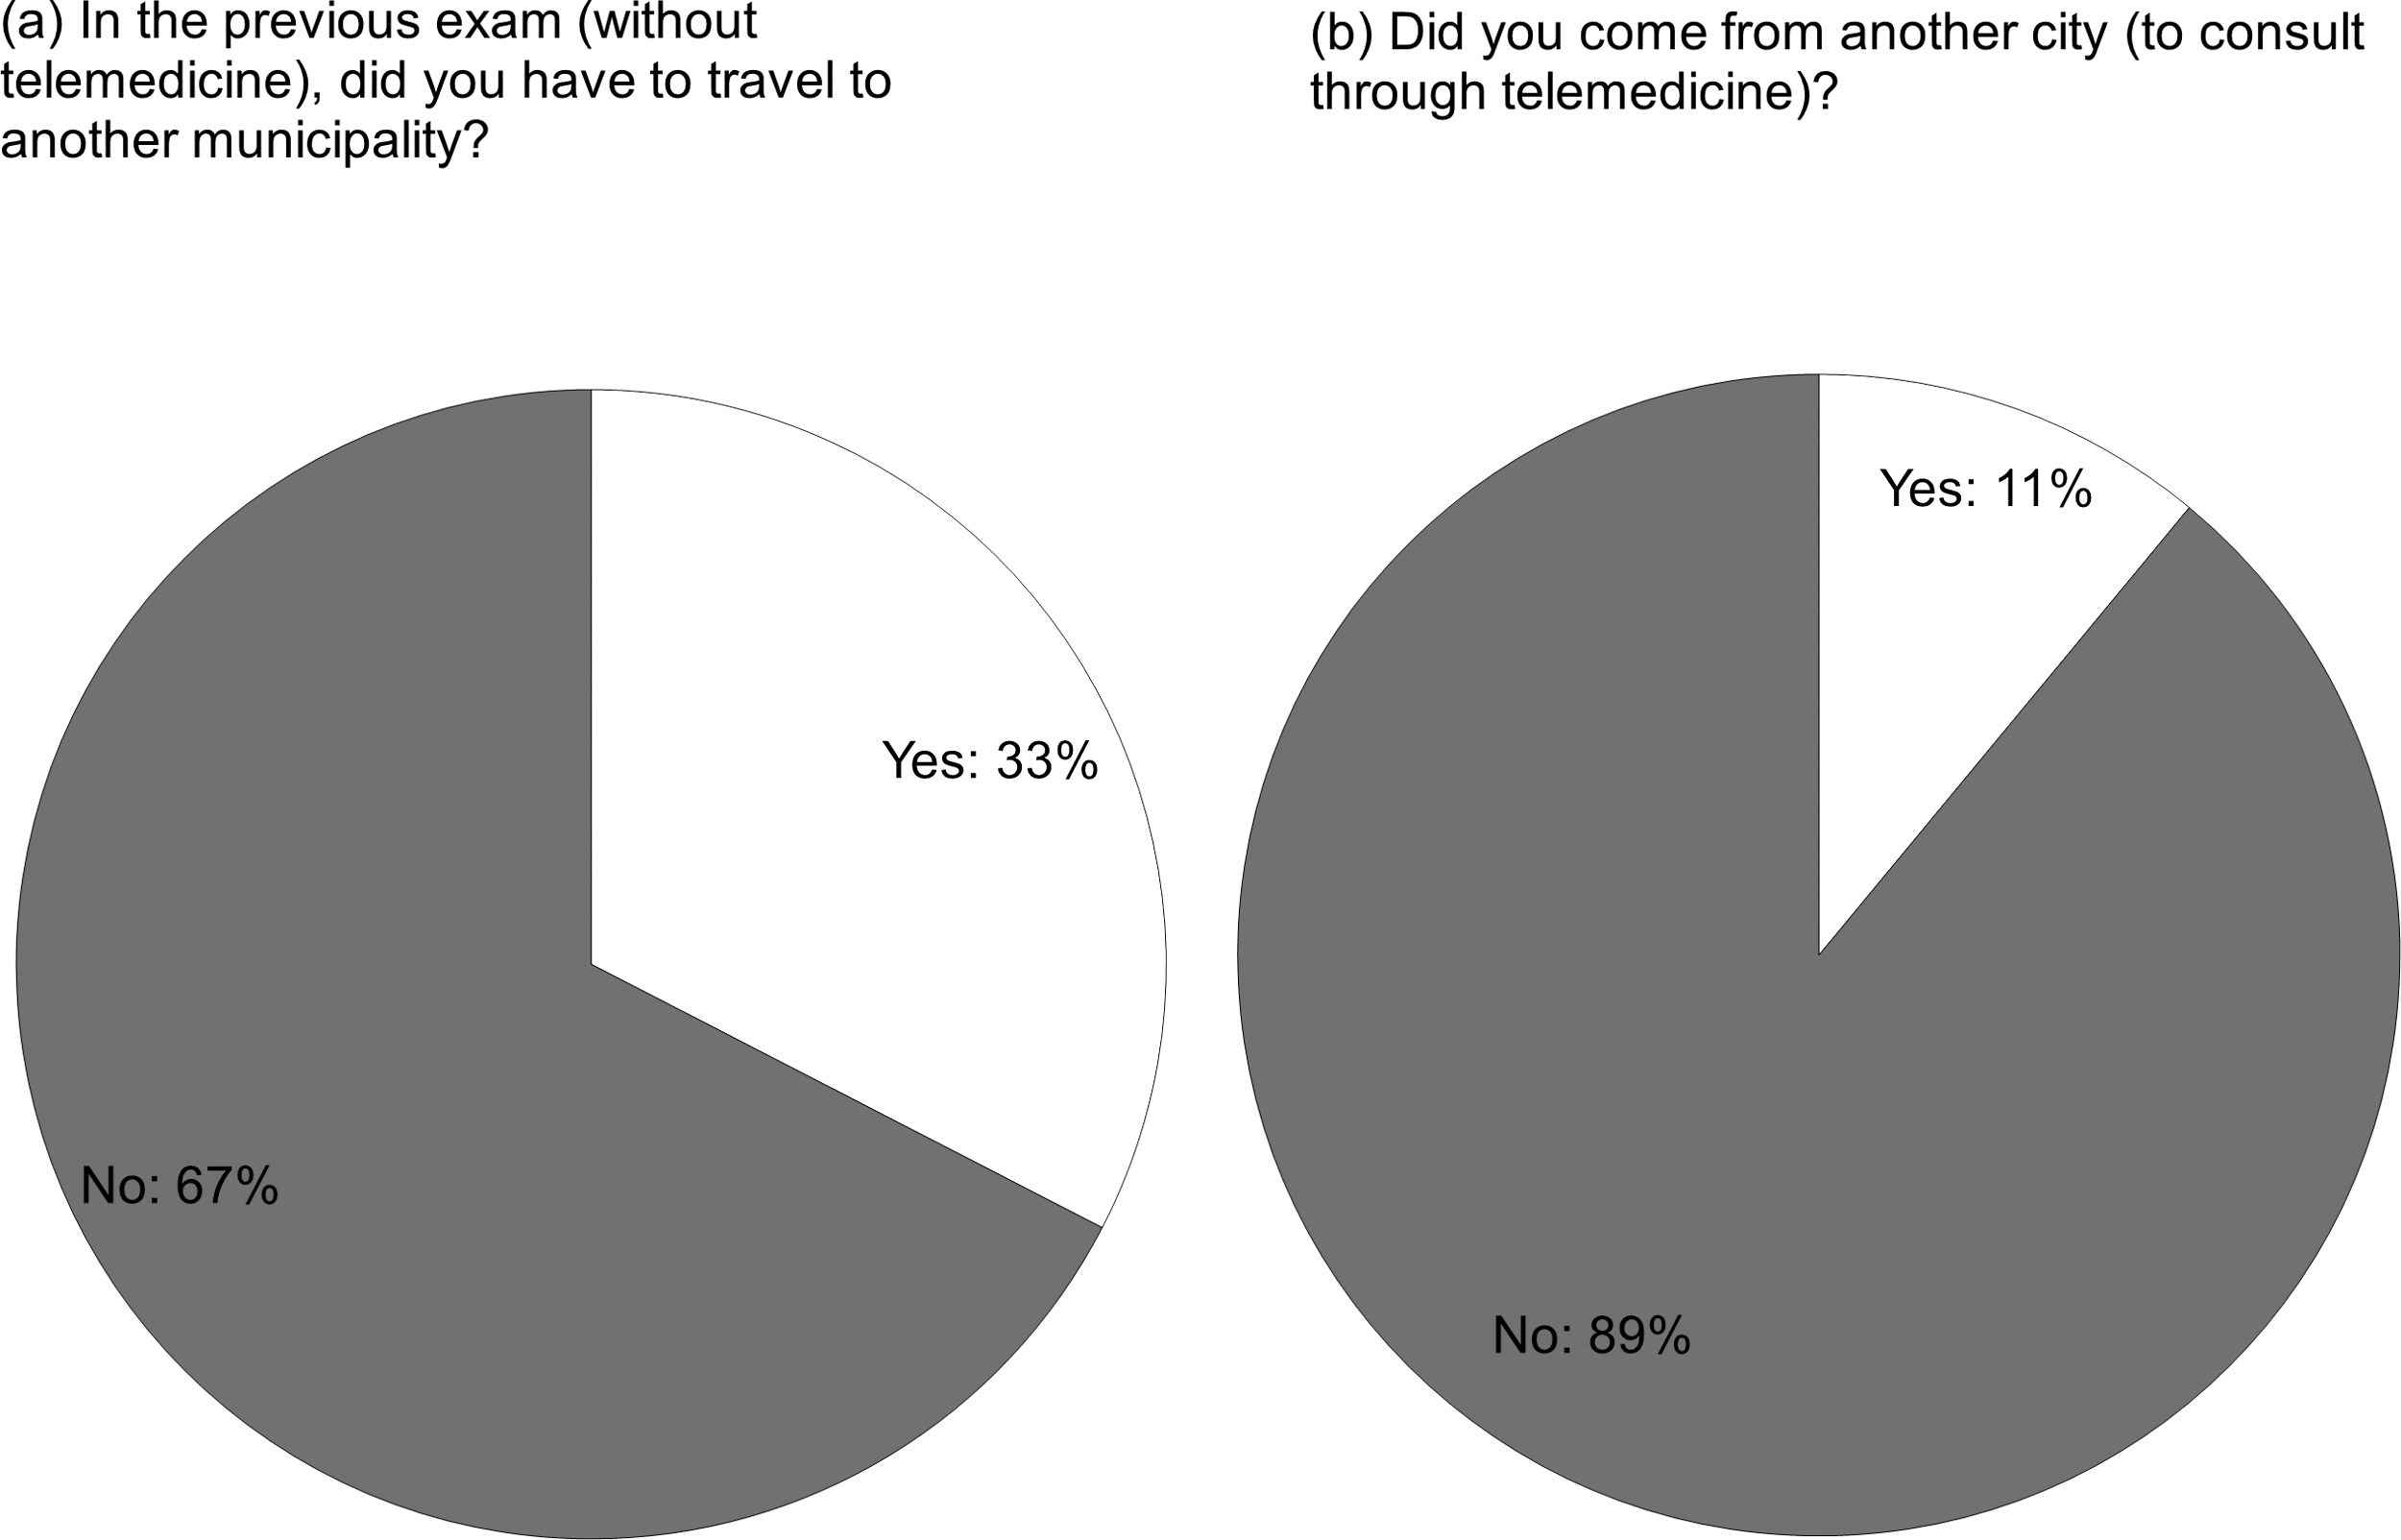
Metric: the need for the patient to travel to another municipality.

Metric: patient's waiting time for the exam to be performed.

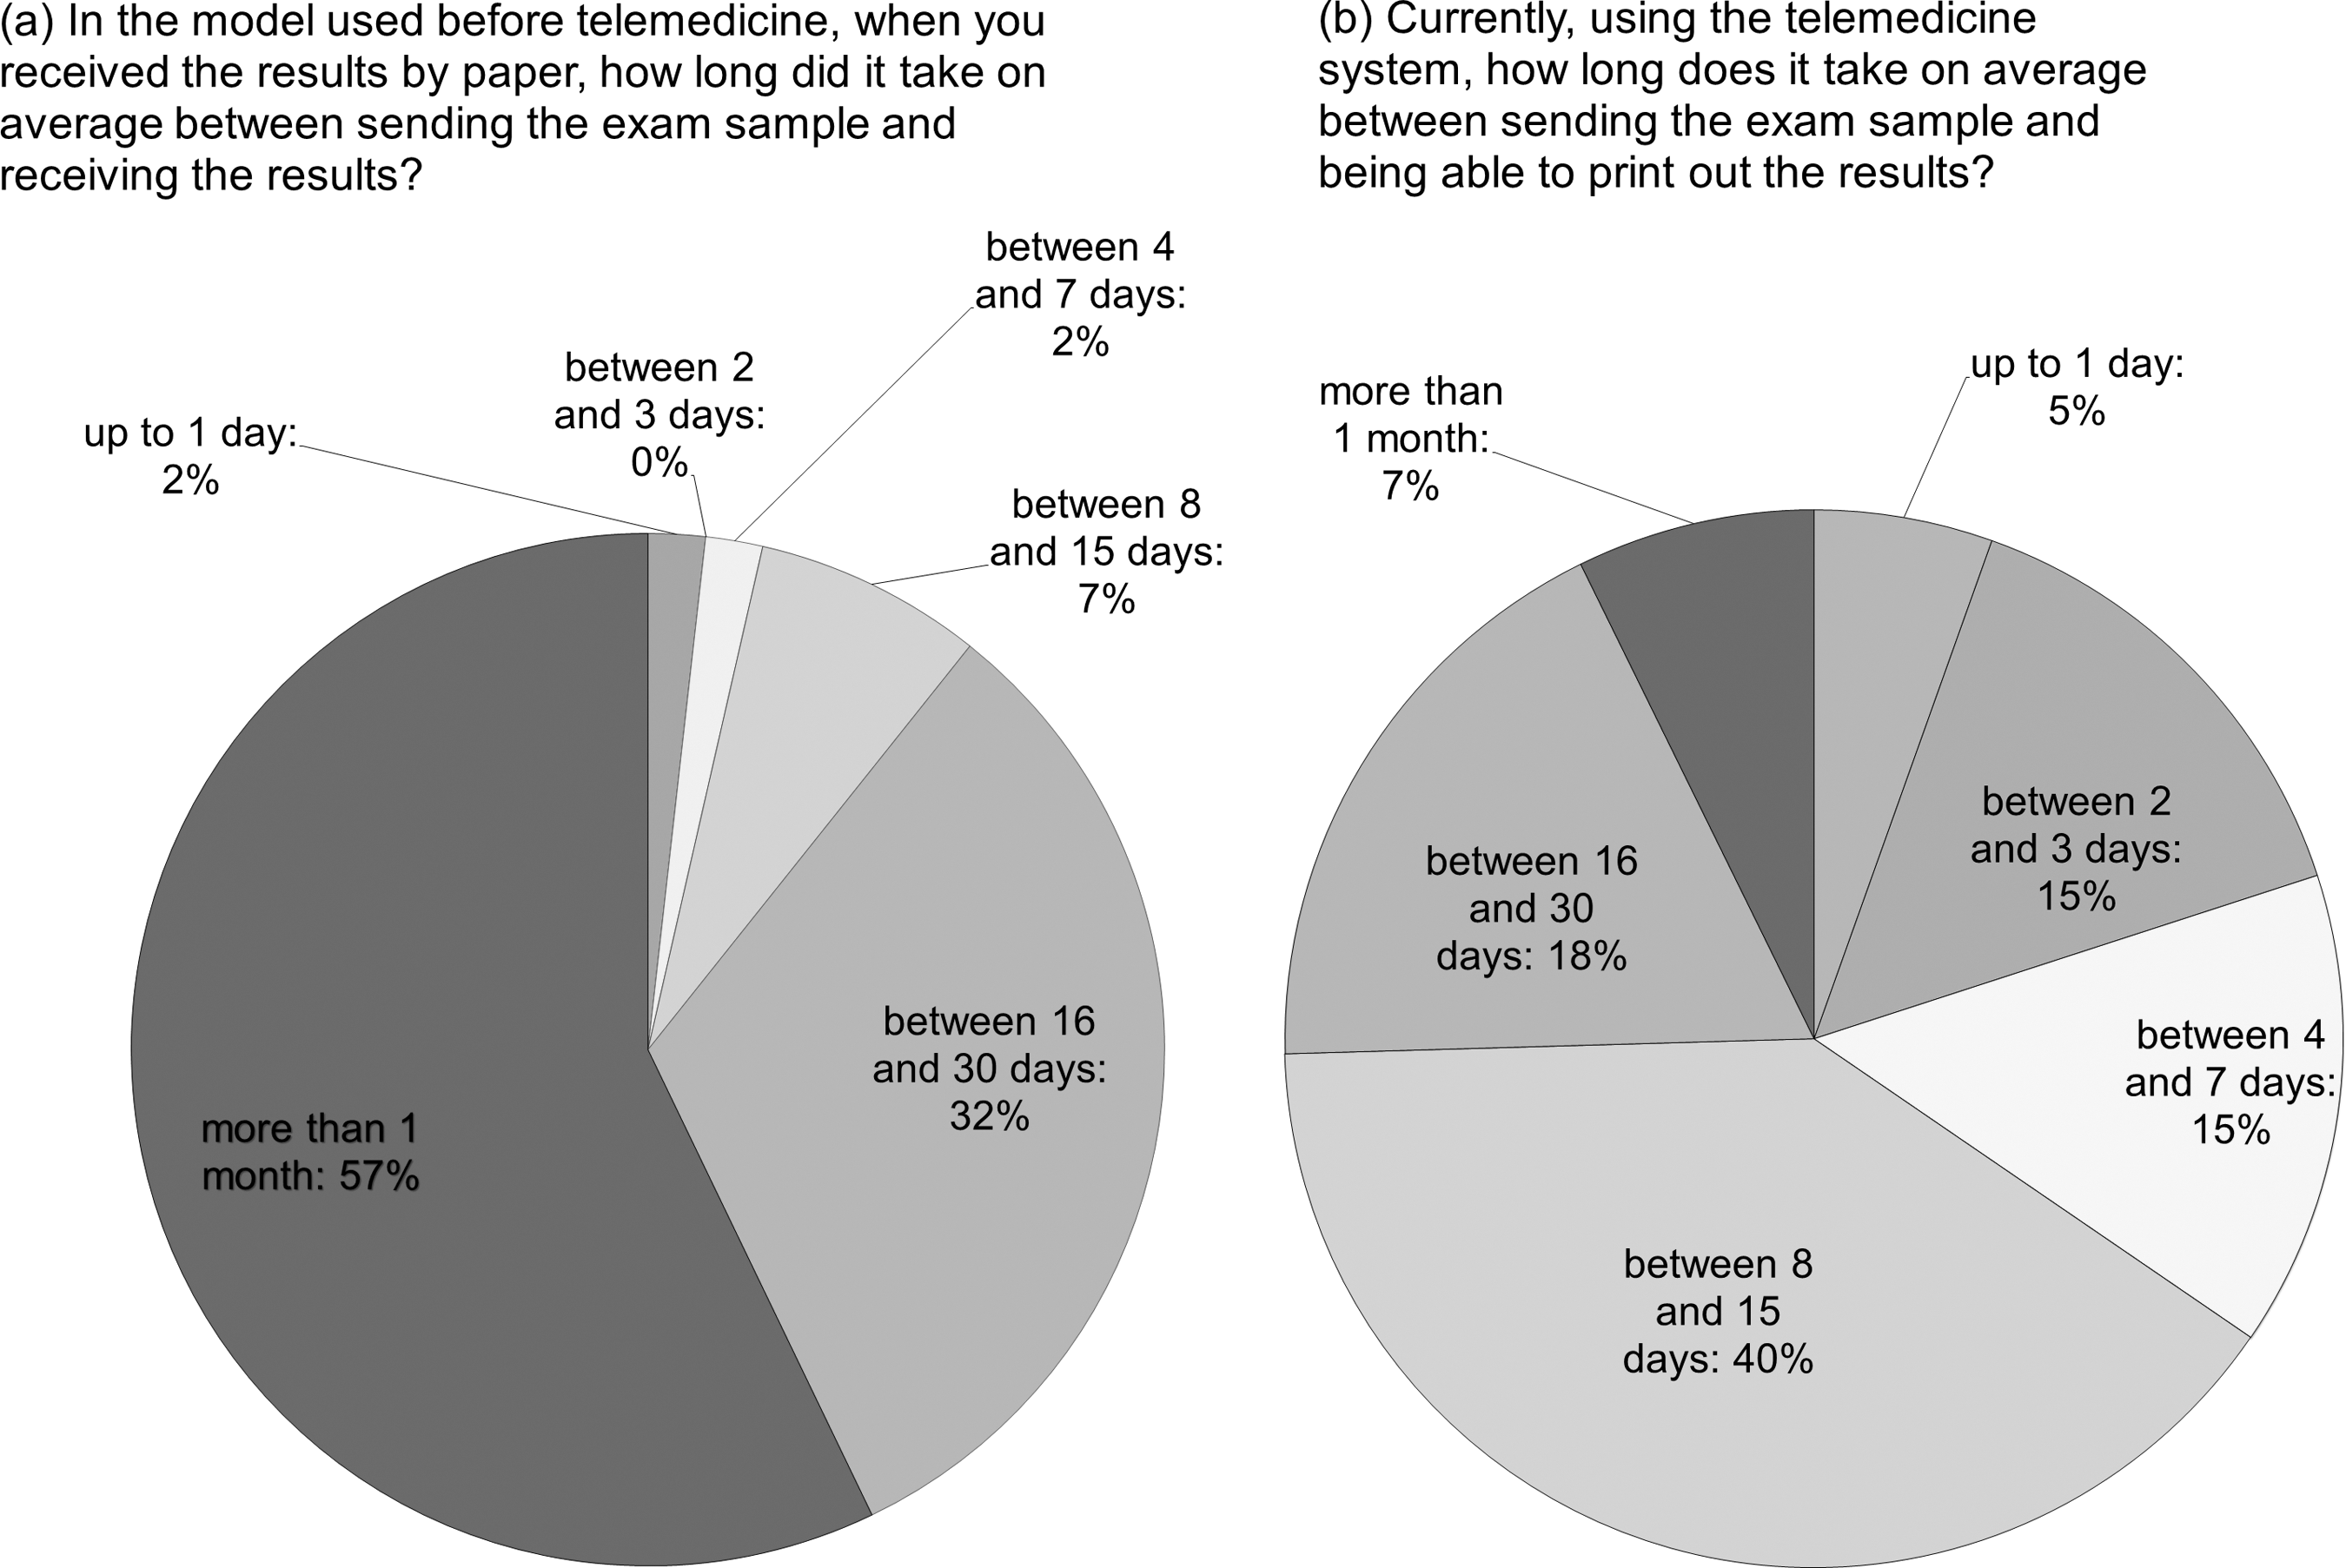
Metric: delay in receiving results.
Tables 1 –3 give the statistical analyses of the data gathered on the performance of the Tele-Electrocardiography Service.
Metric: Need to Travel to Another Municipality
Chi-square=62.35 with 1 degree of freedom and p<< 0.001.
Metric: Waiting Time for the Exam to Be Performed
Chi-square=177.32 with 5 degrees of freedom and p<< 0.001.
Metric: Waiting Time to Receive an Exam
Chi-square=1799.84 with 3 degrees of freedom and p<< 0.001.
For statistical analysis here the last three categories shown were merged into “more than 1 week.”
Satisfaction Study with the Electronic Delivery of the Results of Clinical Analyses Exams
Here we show the results obtained with the study encompassing epidemiological surveillance staff from 46 municipalities in upstate Santa Catarina. Statistical analysis of the data gathered is given in Table 4.
Metric: Waiting Time to Receive an Exam
Chi-square=50.29 with 3 degrees of freedom and p<< 0.001.
For statistical analysis here the last three categories shown were merged into “more than 1 week.”
Discussion
In spite of the considerable quantity of telemedicine satisfaction studies available in the literature, all that could be identified were either aimed at synchronous teleconsultation or, when considering asynchronous telemedicine, were performed in a limited context such as one single medical institution. We do not believe that it makes sense to compare the results obtained by these studies with those obtained by ours, even if a general conclusion—that telemedicine improves user satisfaction—could be identified as a general result of all these studies.
Metric: The Need for the Patient to Travel to Another Municipality
In telemedicine, only 11% of the patients stated that they had to travel for the exam to be performed (see Fig. 2), whereas prior to telemedicine, three times as many patients (33%) stated that they had to travel to another city. Although the difference may not seem important, its significance was confirmed by a chi-squared statistical test, which showed p<< 0.001.
Metric: Patient's Waiting Time for the Exam to be Performed
This metric was compared before versus after telemedicine in the patient study. Without telemedicine (see Fig. 3), the distribution of times that patients wait for exams to be performed varied greatly, and although 5% stated that they had waited more than 1 month for an exam, 66% stated that the exam was performed within a week of the consult at which the exam was requested. With telemedicine, 94% of the patients stated that their exams were performed within a week of the consult at which the exam was requested, with the majority (55%) stating that the exam was performed on the same day or the next day. Only 1% stated that the exam was performed 15–30 days after being requested.
The data for the situation prior to telemedicine for these two metrics were surprising: both the small number of patients who had to travel to another city (only 33%) and the speed with which patients were attended (66% attended within a week) were unexpected. Here, it must be considered that the patients were only asked whether they had previously had an ECG exam, not whether this exam was performed by the SUS or in any other way. The interior of Santa Catarina is relatively well supplied with private cardiology services, which in some situations have been contracted by the prefectures to perform exams (a situation that telemedicine has changed). We must consider that among those 67% of exams that patients received in their own cities, before telemedicine services were deployed, a good percentage were probably private exams or exams covered by health plans, in addition to private consultations paid for by the prefectures. Despite the pre-telemedicine data being better than what common sense would have led us to believe, the post-telemedicine times were nevertheless considerably improved, with the significance of this difference being corroborated by a chi-squared statistical test, with p<< 0.001.
In the case of patients' waiting times, we chose not to cross-reference the data with statistics from the Treatment outside the Patient's Home Area (Tratamento Fora de Domicílio da SES/SC [TFD]) database, a database that was available to use during the performance of this study. In our current study, the objective of this metric was to capture patients' subjective perceptions of the amount of time they waited for the reading and results of their exams, before and after telemedicine, based only on their memory. The idea was that it is patients' perceptions that lead them to form their opinions about whether the service is better or worse. In future and continuing data collection, we will examine the potential of cross-referencing with the TFD data to uncover further insights in this metric.
Metric: Delay in Receiving Results
This metric was used for the before versus after comparison in both studies (see Figs. 4 and 5). For telemedicine, the BHCUs were instructed to schedule patients to come and collect their results after 3 days. The STT provided us with exact statistics for the timing of the reports, which is why we did not include a question about how much time the results took for telemedicine on the questionnaire for the patient study. Prior to telemedicine 9% of patients reported that that their reports took more than a month after the exam. On the other hand, 69% of the patients stated that they received their results within a week of the exam. In the study performed on the municipal epidemiological vigilance staff members, the maximal intervals for delivery of results were very much like those that occur with telemedicine: this is because these are clinical exams, and the times for results to be returned include the time of delivering the sample to the Florianópolis Central Laboratory or one of the Regional Laboratories, as well as the time needed to process the samples. In both cases, however, the reduction in the time needed to deliver the results was pronounced, with the significance of this difference being corroborated by chi-squared statistical analysis, with a p value of 0.0 for the tele-ECG exam and p<< 0.001 for the clinical analyses.
Metric: delay in receiving results.
Metric: User-Friendliness of the System
To exclude the possibility that the user was dissatisfied with the service because of problems related to using it, we included a metric on the perception of the system's user-friendliness. The results for this metric (see Fig. 6) show that 85% of the users stated that they did not have any major difficulties in using the system, with only 2% saying that using the system got in the way of the task.

Metric: system's user-friendliness.
Metric: Overall Satisfaction with the Service
We achieved the same results for both studies: the vast majority (98%) of users, both patients and epidemiological vigilance staff, were satisfied or very satisfied with the new process. Only 2% were neutral, and none considered the new way of working to be negative (see Fig. 7).
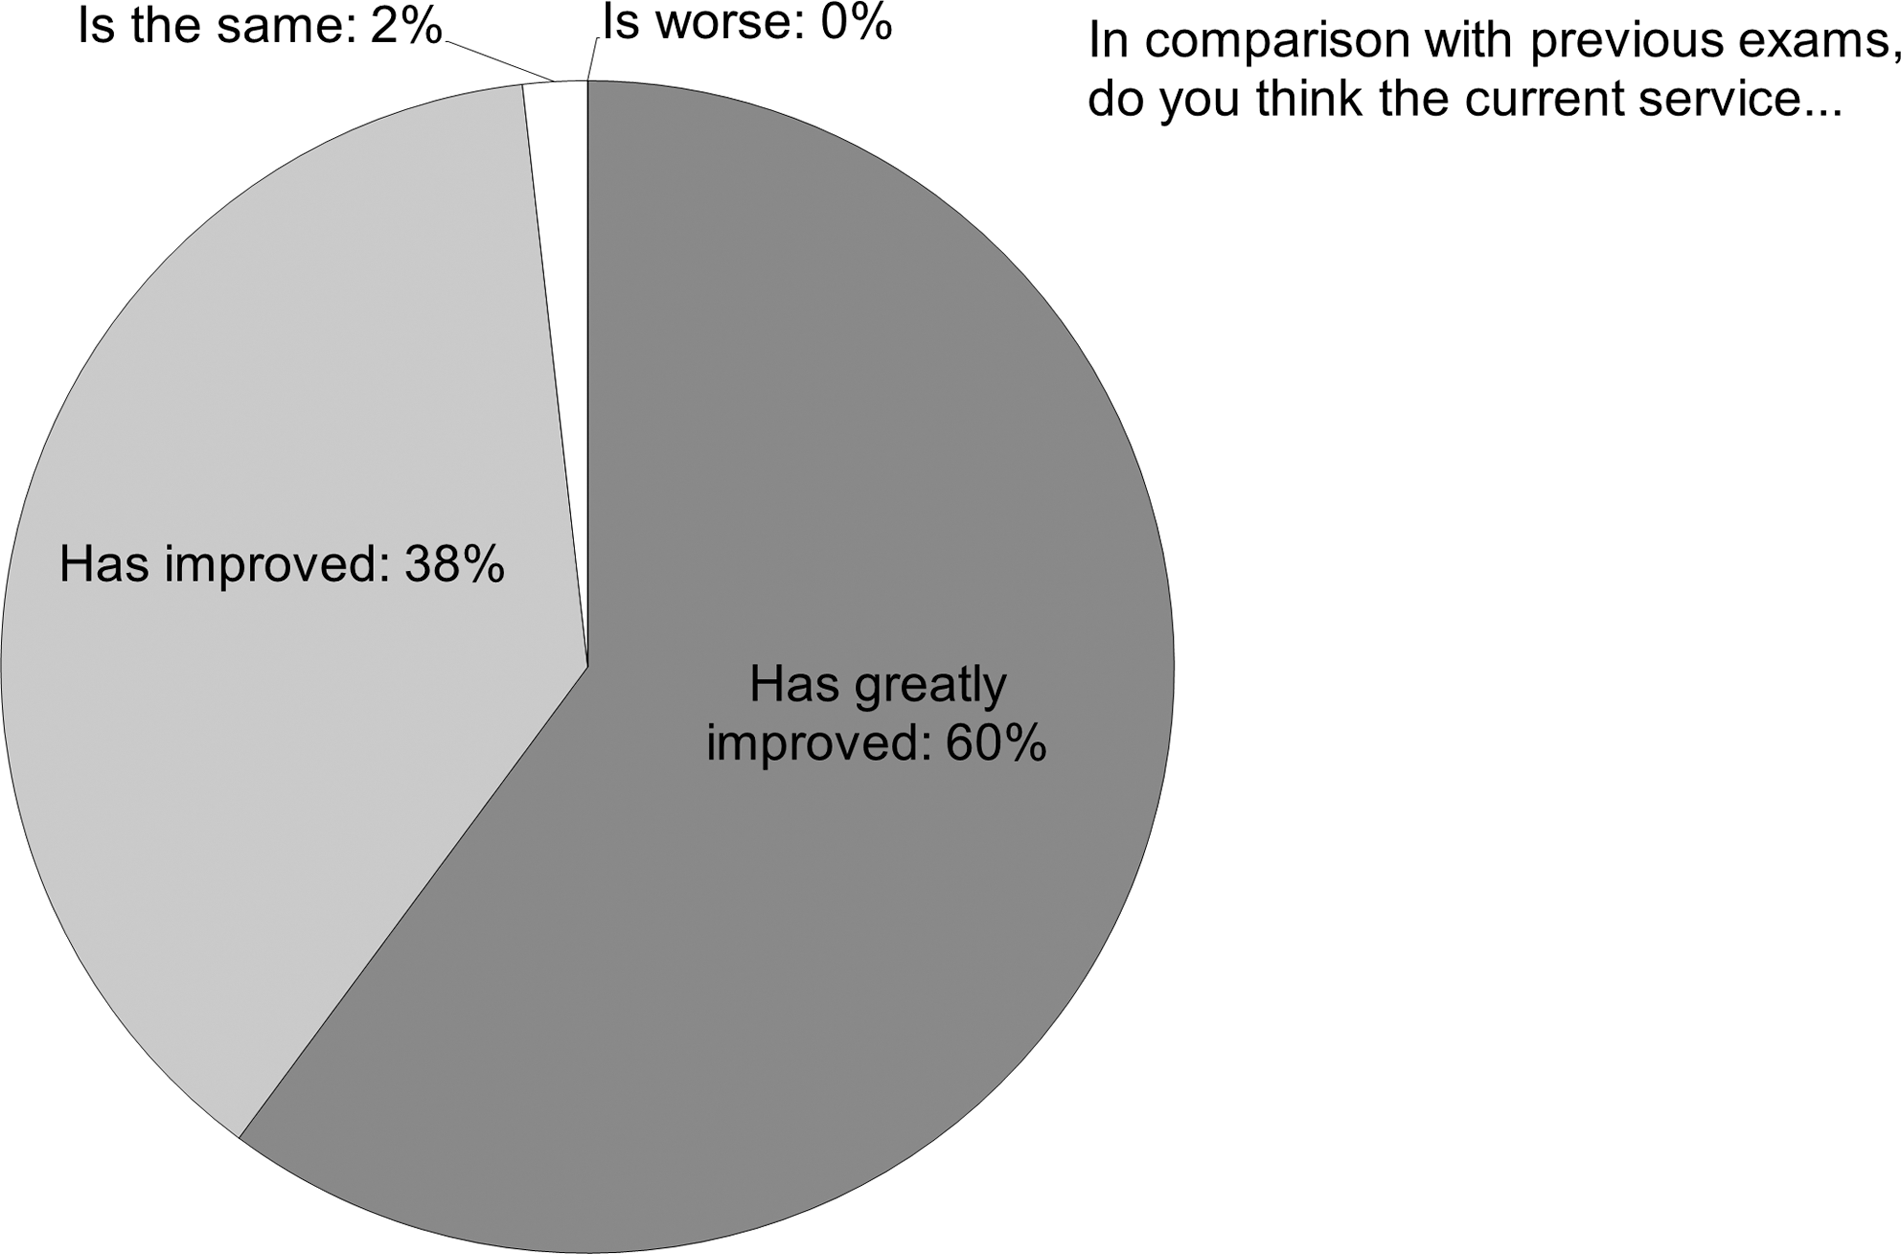
Metric: overall satisfaction with the service.
A comparison with the historical healthcare statistics of the Brazilian public healthcare system for the State of Santa Catarina for municipalities under 20,000 inhabitants (provided online at
Conclusions
This study demonstrates that introducing telemedicine services in healthcare facilities brings an improvement in results and that these results are statistically significant in terms of making it easier to get support from through the system. The present findings also show that both patients and professionals feel that introducing these new technologies, even in upstate areas and even when they involve great changes in healthcare processes and in the way technical-administrative health professionals' work, is a positive step.
Footnotes
Disclosure Statement
No competing financial interests exist.
Appendix A: Questionnaire Given to Patients
| (1) Did you come from another city? [Metric: need to travel to another municipality] | |
| ( ) Yes | |
| ( ) No | |
| (2) With telemedicine, how long did you wait between making an appointment for the exam and having it? [Metric: waiting time for the exam to be performed] | |
| ( ) Up to 1 day | ( ) Between 8 and 15 days |
| ( ) Between 2 and 3 days | ( ) Between 16 and 30 days |
| ( ) Between 4 and 7 days | ( ) More than 1 month |
| (3) Have you had an electrocardiogram before? | |
| ( ) Yes | |
| ( ) No | |
| (4) In the previous exam, did you have to travel to another municipality? [Metric: need to travel to another municipality] | |
| ( ) Yes | |
| ( ) No | |
| (5) When you had an exam, before telemedicine, how long did you have to wait between making an appointment for the exam and having it performed? [Metric: waiting time to receive an exam] | |
| ( ) Up to 1 day | ( ) Between 8 and 15 days |
| ( ) Between 2 and 3 days | ( ) Between 16 and 30 days |
| ( ) Between 4 and 7 days | ( ) More than 1 month |
| (6) After an exam, before telemedicine, how long did you wait to get your results? [Metric: delay in receiving the results] | |
| ( ) Up to 1 day | ( ) Between 8 and 15 days |
| ( ) Between 2 and 3 days | ( ) Between 16 and 30 days |
| ( ) Between 4 and 7 days | ( ) More than 1 month |
| (7) In comparison with previous exams, do you think the current service [Metric: overall satisfaction with the service] | |
| ( ) Has greatly improved | |
| ( ) Has improved | |
| ( ) Is the same | |
| ( ) Is worse | |
Appendix B: Electronic Questionnaire for Staff
| (1) Currently, using the telemedicine system, how long does it take on average between sending the exam sample and being able to print out the results? [Metric: delay in receiving the results] | |
| ( ) Up to 1 day | ( ) Between 8 and 15 days |
| ( ) Between 2 and 3 days | ( ) Between 16 and 30 days |
| ( ) Between 4 and 7 days | ( ) More than 1 month |
| (2) In the model used before telemedicine, when you received the results by paper, how long did it take on average between sending the exam sample and receiving the results? [Metric: delay in receiving the results] | |
| ( ) Up to 1 day | ( ) Between 8 and 15 days |
| ( ) Between 2 and 3 days | ( ) Between 16 and 30 days |
| ( ) Between 4 and 7 days | ( ) More than 1 month |
| (3) Do you consider this system... [Metric: system's user friendliness] | |
| ( ) Easy to learn and use | |
| ( ) Takes some time to learn and use, but after you “get it,” it is very easy. | |
| ( ) Was hard to learn and at times still causes problems | |
| ( ) Hard to use | |
| (4) Compared with the way exams were previously performed, do you think that the current service [Metric: overall satisfaction with the service] | |
| ( ) Has greatly improved | |
| ( ) Has improved | |
| ( ) Is the same | |
| ( ) Is worse | |