
Abstract
Introduction
In view of the increasing popularity of traditional Chinese medicine (TCM), particularly as it becomes integrated into Western medicine for health management 1,2 and in view of the trend toward using telemedicine, making tele-TCM consultation feasible is a new challenge to researchers.
TCM pulse diagnosis is one of the four basic assessments during a TCM consultation. 3 Until now it has been an assessment needing face-to-face consultation because the TCM doctor needs to palpate the wrist at six locations: left and right cun, guan, and chi (Fig. 1). Recent literatures proposed assessing pulses based on the intensity of eight elements at these locations. 3,5,6 The eight elements are depth, rate, regularity, width, length, smoothness, stiffness, and strength. 7 –12 A previous study 13 demonstrated that the eight elements at the six locations were able to differentiate diseases. The authors believed that developing an electronic TCM pulse diagnostic system with the eight elements can probably put TCM consultation into a telehealth system.

The six locations and their corresponding organ meridians. 4
Many studies done over several decades have demonstrated the association between the physical parameters of the arterial pressure waveform in time domain and the eight elements. 7,11,14 –23 In the time domain, researchers have extracted physical parameters from the arterial pressure waveform, such as h 1 and h 3, and generated new parameters from them. Figure 2 shows a typical arterial pressure waveform. Depth has been associated with the hold-down pressure with the relatively largest h 1, rate with t, and regularity with the interval between two individual arterial pressure waveforms and the consistency of the contour of the waveforms. Width has been associated with h 4/h 1, t 1, and h 1. The pulse described as “surging” has been found to have a smaller h 4/h 1 and t 1 and a larger h 1. Length has been associated with h 1 at cun, guan, and chi. The pulse described as “short” has been observed to have a small h 1, although association with the other physical parameters in the arterial pressure waveform has not been discernible. Smoothness in a pulse has been related to W/t, h 4/h 1, t 1, h 5, and h 5/h 1. A smaller h 4/h 1 and a larger h 5 have been observed for a “slippery” pulse, and h 3/h 1, h 4/h 1, and h 5/h 1 are associated with a “stiff” pulse. A larger h 3/h 1 and h 4/h 1 and a smaller h 5/h 1 have been observed for a “string-like” pulse. Four types of arterial pressure waveform have been identified for the string-like: lower h 1 than h 3, h 3 equal to h 1, h 3 higher than h 1, and h 3 merged with h 1. Strength is associated with a pressure difference at the 80% maximum average h 1.

A typical arterial pressure waveform. 7
Application of the Artificial Neural Network in Digitalizing TCM Pulse Diagnosis
The high degree of complexity of TCM pulse diagnosis necessitates a more advanced modeling technique to develop an electronic TCM pulse diagnostic system. 24 –26 The artificial neural network (ANN) is a nonlinear statistical modeling technique commonly used in the modeling of complex nonlinear relationships among independent and dependent variables. 27,28 The presence of hidden layers in the network greatly increases its capacity to deal with various complicated relationships. Its use was proposed in clinical decision-making in order to increase the diagnostic accuracy in Western medicine. 29 –33 A handful of studies were found to quantify TCM pulses with ANN. 34,35
Wang and Xiang 34 compared the accuracy of fuzzy inference and ANN in predicting TCM pulses. They reported the successful application of ANN in identifying four pulses—the “normal,” the “string-like,” the “slippery,” and the “fine”—and showed that ANN had an 87% predictive accuracy, which was 12% higher than that of fuzzy inference. Xu et al. 35 compared the predictive accuracy of traditional ANN and the fuzzy neural network in predicting eight pulses. Three traditional ANNs using back propagation were developed, each of which had three layers: an input layer, a hidden layer, and an output layer. The input neurons were 17 physical parameters of the arterial pressure waveform in the time domain, and the output neurons were the eight pulses, which, unfortunately, were not specified. The number of hidden neurons used in the three traditional ANNs was 10, 15, and 20. The fuzzy neural network was a composite of four sub-fuzzy neural networks and was used to model 17 physical parameters and the four pulse characteristics (position, frequency, shape, and trend) proposed by Zhou Xuehai (1856–1906) 19 separately. The four sub-fuzzy neural networks were then combined to predict the eight pulses. The three traditional ANNs obtained 86–88% accuracy, but the fuzzy neural network outperformed these networks by 4%. They concluded that it was beneficial to combine fuzzy inference and ANN to quantify pulses. The researcher queried how the four pulse characteristics are measured because they were believed to be a composite of more than one of the eight elements. The approaches they model limit the number of pulses that could be quantified. Modeling on the basis of the eight elements will not have such a restriction. The quantified elements can form infinite combinations, and thus all pulses can be quantitatively identified.
In this study, we aimed to develop an electronic TCM pulse diagnostic system on the basis of the eight elements at the six locations with ANN. The objectives were (1) to examine the relationship between arterial pressure waveform in time domain and the eight elements at the six traditional pulse-taking locations and (2) to evaluate the validity of the developed diagnostic system.
Materials and Methods
Pulses were taken in a TCM laboratory of the School of Nursing at The Hong Kong Polytechnic University. The temperature in the laboratory was kept at 22°C throughout the data collection, as fluctuations in the environmental temperature are known to affect the pulse. 7 The aim of using a consistent setting was to avoid systematic bias.
Selection of Participants
Volunteer subjects were recruited through e-mail and posters on the university campus and in community health centers and hospitals and from advertisements placed in newspapers. Inclusion criterion was age over 18 years. Exclusion criteria were pregnancy and loss of limbs and cognitive impairment.
Procedure
The whole procedure for participants lasted 45–60 min. The purpose, procedure, and potential harm of the study were described and explained to the subjects. They were told that they could withdraw from the study at any time without penalty. Written consent was obtained before the data collection/pulses were taken.
The participants were asked to lie on a bed for 20 min before data collection. The TCM doctor whose inter- and intra-reliabilities were tested previously 13 was blinded to the health status of the subjects and was not allowed to communicate with the subjects during the pulse assessment. He assessed the pulse at the six locations and rated the intensity of the eight elements on a visual analog scale.
After the pulse assessment by the TCM doctor, the researcher acquired arterial pressure waveforms at the six locations with a pulse acquisition system according to the following procedure: 1. Ask the subject to put his or her forearm into the forearm holder. 2. Acquire pulses on both left and right sides. Start the pulse acquisition in a sequence from cun to chi. 3. Apply hold-down pressures from 0 mm Hg to 400 mm Hg with 30 mm Hg intervals by rotating the lever of the tonometer holder. 4. For each hold-down pressure, acquire and record on the computer a 15-s tracing of the arterial pressure waveform. 5. Repeat steps 4 and 5 at the six locations.
As the hold-down pressure temporarily affected the blood flow to the radial artery, the arterial pressure waveform was acquired in the sequence given in step 2 to minimize the effect of the hold-down pressure on the arterial pressure waveform. Because it is technically impossible to acquire the arterial pressure waveform continuously, an interval of 30 mm Hg was chosen as an alternative.
Pulse Acquisition System
A pulse acquisition system was developed to acquire the arterial pressure waveform. The system was made up of three components: a tonometer, a forearm holder, and a tonometer holder. A tonometer (model SPT-301; Millar Instruments Inc., Houston, TX) was used to acquire the arterial pressure waveform. The validity of this instrument has been demonstrated by Kelly et al. 36 Its maximum output value was 4.00 V, which is equivalent to 400 mm Hg. It was connected to a pressure control unit (model PCU-2000; Millar Instruments Inc.) and then to an A/D converter. Labview was used as the pulse acquisition interface, and the sampling frequency was set at 400 Hz in accordance with the Nyquist Theorem, as the frequency of the arterial pulse is less than 40 Hz. 37,38 The pressure signal of a tonometer is not readily recognized by computers, and thus the pressure control unit and the A/D converter were used to convert the pressure signal into a recognizable digital signal. To ensure the reliability of the pulse acquisition unit, it was calibrated just before data collection according to the manufacturer's recommendations.
The tonometer and the forearm holders (Fig. 3) were designed to minimize the measurement error caused by any motion artifacts such as involuntary movement of the subjects.
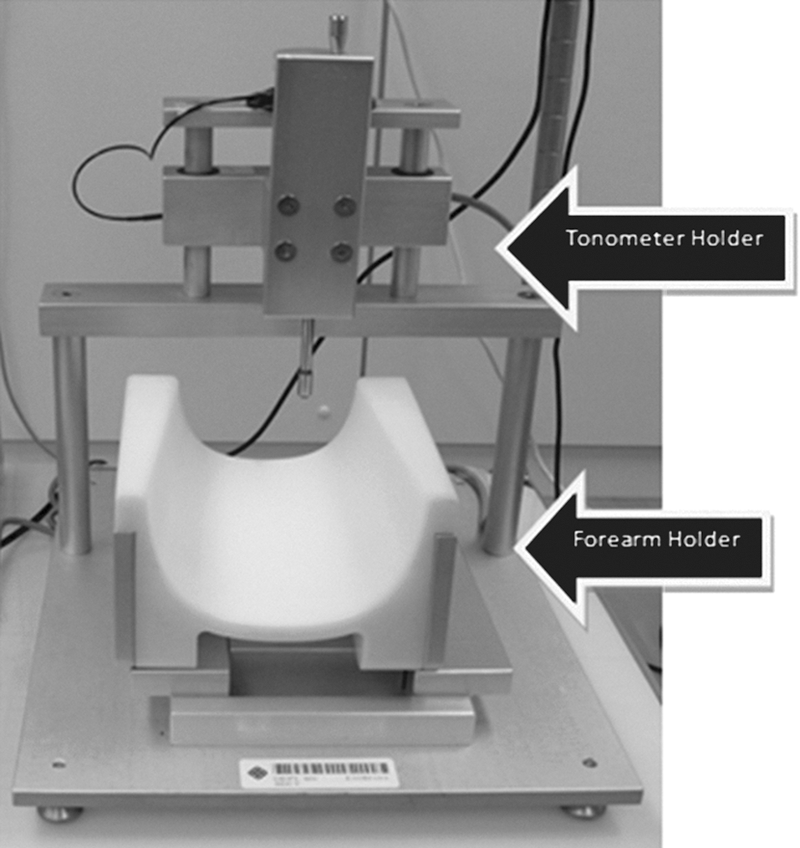
Forearm holder and tonometer holder.
Variables
Arterial pressure waveform in time domain
Sixteen physical parameters were extracted from the arterial pressure waveform in the time domain in the best tracing at each location. The definition of “best tracing” is the one with the largest peak and with most of the other features preserved. Sixteen physical parameters were generated from the arterial pressure waveform by an in-house–designed feature extraction program, including pa max, Δ80%pa max, amp peak, h 3/h 1, h 4/h 1, h 5/h 1, h 1/t 1, W/t, t, t 1/t, t 4/t, t 5/t, A T, A S, A D, and SD-PPI. Their operational definitions are given in Table 1, where “average” is defined as the mean of 7–10 arterial pressure waveforms in a tracing free from noise or minimally affected by noise.
Sixteen Physical Parameters and Their Operational Definitions
Eight elements at the six locations
Depth, rate, width, length, smoothness, stiffness, and strength were measured using a visual analog scale. Their operational definition is given in Table 2. The six locations were operationalized in accordance with Mai Jing. 6 All the ratings were measured to the nearest 0.1 cm.
Operational Definitions of the Eight Elements
VAS, visual analog scale.
Statistics
Mean, standard deviation, and frequency were computed to determine the characteristics of the subjects with Statistical Package for Social Sciences (SPSS) version 15. An ANN was used to model the relationship with MatLab version 8.0.
Three factors could be manipulated in the modeling: the number of hidden layers, the number of hidden neurons, and the training algorithms used. As there is no protocol in ANN studies to guide the training process, the three factors were systematically adjusted during the modeling to generate the best results.
To increase the efficiency of the training, the input data and target data were preprocessed before training commenced. The input and target data were first normalized to a zero mean and a unity standard deviation, and the numbers of neurons in the input and output layers were fixed. Principal component analysis was used to reduce the redundancy of the data set. The identified components were then used as the input neurons. The eight elements at the six locations were the output neurons. Because each element except length was rated individually at each location (7×6=42) and length was rated across cun, guan, and chi (1×2=2), there were 44 output neurons in total. A back propagation network and a radial basis network were the two training algorithms used.
Back propagation
Initially one hidden layer was used; the number of hidden neurons was set at 20 and then increased in five-neuron intervals until the performance leveled off or decreased. If the three-layer network failed to train the models, then a four-layer network was attempted using the same number of hidden neurons in successive trainings and criteria for stopping the training as for the three-layer network.
Log-sigmoid function was used as the transfer function to connect the input layer to the first hidden layer and subsequent hidden layers, if any. A pure linear function was used as the transfer function connecting the nth hidden layer to the output layer. The Levenberg–Marquardt algorithm, resilient back propagation, and Bayesian regularization were used separately to train the back propagation model.
To increase the training efficiency, two parameters—learning rate and momentum—were adjusted. Learning rate, which determines size of weight adjustment, was set at 0.02. Momentum, which prevents the training from converging to some local noise, was set at 0.8. The number of training cycle was set at 500. Because there is no standard rule to govern the value of learning rate, momentum, and training cycle, they were set in our study by trial and error.
Radial basis networks
Unlike back propagation, radial basis networks have only one hidden layer, which is called the radial basis layer. 39 A radial basis function is used in the hidden layer as a transfer function, and a pure linear function is used to connect the hidden layer and the output layer. The generalized regression neural network, which is one of the training algorithms used in radial basis networks to perform function approximation, was used to model the relationships among the physical parameters and the eight elements at the six locations. The data division and assignment processes were the same as those in back propagation.
The performance of the modeling process was then determined by calculating the r 2 of the predicted value from the models and the target value using linear regression. A value of p<0.05 was considered to be statistically significant.
Results
Two hundred twenty-nine subjects were recruited, approximately equally distributed by gender. Over 50% were 35–64 years old and were of normal body mass index. Regarding their medical history, nearly 60% had good past health, and 40% had hypertension. Table 3 summarizes their background information.
Background Information of the Subjects (n=229)
The results from principal component analysis performed in MatLab version 8.0 led to 10 components. The 10 components and medical history were used as the input neurons for the ANN training.
The initial attempt using a three-layer network failed to establish the models for the four training algorithms. In successive trainings, 20, 25, 30, 35, 40, and 45 hidden neurons were tried. The r 2 values for the three training algorithms in the back propagation were low, ranging from 0.20 to 0.30. The r 2 for generalized regression neural network ranged from 0.40 to 0.50, which was somewhat better. As the structure of the generalized regression neural network cannot be manipulated, a second attempt at back propagation was made using a four-layer network.
In the second attempt, the Levenberg–Marquardt algorithm and Bayesian regularization showed a similar pattern of performance, with their r 2 increasing with an increasing number of hidden neurons until reaching an optimum at 45, at which point the r 2 decreased. The r 2 of the resilient back propagation also increased until the level of 45 hidden neurons was reached, but its performance was poorer than that of the Levenberg–Marquardt algorithm and the Bayesian regularization. The r 2 at the optimum for the Levenberg–Marquardt algorithm and the Bayesian regularization was about 0.70, and whereas that of the resilient back propagation was only 0.45 at most.
The best algorithm for modeling the relationships was the Levenberg–Marquardt algorithm, the r 2 of which improved until it reached the optimum at 45 hidden neurons for depth, rate, regularity, width, smoothness, stiffness, and strength and decreased with further increases in hidden neurons. For length, it achieved optimal performance at 25 hidden neurons. Table 4 summarizes the r 2 of the models.
Summary of the Performance of the Best Models for the Eight Elements at the Six Locations Using the Levenberg–Marquardt Algorithm (n=229)
LM, Levenberg–Marquardt algorithm.
The model performed similarly for the same elements across the locations. The best performance was achieved for the model of length, with an r 2 of 0.86. The second best was the model of strength, with an r 2 of 0.80. These results demonstrate that the models established for length and strength accounted for most of the variance in these elements. The models for the other six elements showed a moderate performance, with r 2 ranging from 0.60 to 0.70, meaning that about 30–40% of the variance could not be explained.
In sum, the best models were trained by the Levenberg–Marquardt algorithm with 45 hidden neurons in two hidden layers. The validities of these models ranged from 0.60 to 0.86.
Discussion
This is the first report of an electronic TCM pulse diagnostic system based on readings of the eight elements at the six traditional pulse-taking locations. It is true that the relationships among the eight elements at the six locations and the physical parameters established by the ANN are still somewhat obscure, but with more resources and further study we believe they could be thoroughly elucidated. Despite the successful establishment of the models using ANN, medical research favors models with high explanatory power. 40 –42 Regression analysis is commonly used in medical research for function approximation. 27,43 To the best of our knowledge, no studies have examined the relationships using regression analysis. Instead, more advanced statistical techniques, such as fuzzy inference and ANN, have been suggested for modeling the relationships 24 –26 because of the high complexity. In fact, these researchers have tried to model the relationships with regression analysis. Results were discouraging because the r 2 values of the models were too low to account for the variance. The failure of modeling their relationship with regression analysis may indicate that their relationship is not linear.
Compared with the methodology of Wang and Xiang 34 and Xu et al., 35 ours is more advantageous as the digitalization of TCM pulse diagnosis with the eight elements at the six locations fully covers all types of TCM pulses without limiting to a few of them. Varieties of TCM pulses can therefore be digitalized with these models. However, the moderate r 2 attained here indicates that the physical parameters only moderately explain the eight elements at the six locations. This could probably be explained by the limitations of our study (see Limitations and recommendations).
Conclusions
This article presents a new approach to digitalize TCM pulse diagnosis with the eight elements at the six locations. The ANN models suggest a nonlinear relationship between the eight elements and the physical parameters at the six locations. It is definitely more advantageous than merely digitalizing TCM pulses because varieties of TCM pulses can be fully present in the proposed models. Much future work is required to fully validate these models before applying them in tele-TCM consultation.
Limitations and Recommendations
There are several limitations in this study. First, TCM doctors usually assess pulse at the six locations both individually and simultaneously. However, in this study the pulse acquisition device used was a single-probe type, as no validated three-sensor pulse acquisition device is available, and the arterial pressure waveforms could only be acquired one at a time. Thus, the simultaneous manipulation of pulse at the six locations as carried out in a typical TCM pulse assessment could not be achieved. Second, the pulse acquisition process was fairly long-lasting (about 1 h), which may have provoked motion artifacts in the subjects that affected the quality of the arterial pressure waveforms acquired. Third, the baseline of the arterial pressure waveform fluctuated because of the movement and breathing pattern of the subjects, and the feature extraction program was insufficiently developed to remove this noise from the waveforms. The rescaling of the fluctuating baseline into a horizon would have distorted the arterial pressure waveform and introduced errors into the features extracted. Furthermore, the peak-to-peak interval could not be extracted by the program and thus could not be used in the modeling. The program also could not extract arterial pressure waveforms in which h 3 augmented or superimposed h 1. This may have affected the accuracy of the results because of biased samples in the hypertensive subjects. Fourth, the pulse acquisition device limited the hold-down pressure to a maximum of 400 mm Hg, but the amplitude of the arterial pressure waveform did not decrease in some of the hypertensive subjects, and thus Δ80%pa max could not be calculated.
Fifth, the sample size required by the ANN was too large to be recruited in this clinical study, and the smaller sample size used may have lowered the effect size of the models. According to Lisboa, 40 sample sizes for exploratory studies should be 5–10 times the number of independent variables. By this token, the number of samples required for modeling the relationship of the eight elements and the physical parameters at the six locations is 10×10=100 samples. As the dataset for the ANN was split into a training set and testing set, there was an issue with the sample size of the testing set. 41 Wasson et al. 44 proposed that an ANN testing set should contain at least five examples per item of the input data per class. Based on this suggestion, the sample size of the testing set required for modeling the relationship of the elements and the physical parameters at the six locations would be 5 examples×10×100 (the unit of rating was 0.1)=5,000 samples. As it was impossible to have 5,000 samples in this testing set, the researcher eventually followed the recommendation from Lisboa. 40
Finally, the majority of the subjects recruited were normal, and the hypertensive subjects recruited had a stable prognosis; thus, the intensity of the eight elements was confined to a narrow range. The model cannot be extrapolated to other conditions such as severe hypertension and hypotension. Such homogeneity in the samples may have lowered the r 2 values.
In view of the limitations of the study, four recommendations are made for further studies in this area. First, the feature extraction program requires further enhancement to extract all of the useful features from the arterial pressure waveform. Some studies have tried to develop techniques to overcome this issue. 21,45,46 The development of the feature extraction program is a major part of the study because the physical parameters are calculated based on the features extracted by the program. Second, it is suggested that a validated three-sensor pulse acquisition device be developed so that the effect of simultaneous hold-down pressure on the arterial pressure waveforms at cun, guan, and chi can be examined. Third, more subjects should be recruited to verify the models. The models established are preliminary models that demonstrate a moderate r 2, but a larger sample is required to fully test the models. Fourth, as only normal subjects or subjects with a stable hypertension were recruited, the models cannot be extrapolated to patients with more severe health conditions. It is thus recommended to recruit subjects with severe health conditions in future studies to increase the generalizability of the models.
Footnotes
Acknowledgments
This study was part of A.C.Y.T.'s Ph.D. thesis titled "Developing an Objective Traditional Chinese Medicine Pulse Diagnostic Model in Essential Hypertension" submitted to the School of Nursing, The Hong Kong Polytechnic University, in 2010. Heartfelt thanks for the guidance from Professor Thomas Wong and Professor Joanne Chung and the assistance from the Centre for Integrative Digital Health, School of Nursing, The Hong Kong Polytechnic University.
Disclosure Statement
No competing financial interests exist.