
Abstract
Introduction
National Health Service (NHS) Direct operates a telephone-based health service that offers individuals advice either to self-manage symptoms or to direct them to the most appropriate form of care, with a further aim being to reduce demands on other NHS services, thus improving cost-effectiveness of the NHS and increasing accessibility. 1 NHS Direct, introduced in 1997, 2 has become a popular telephone advice and information healthcare provider as evidenced by its increased utilization and satisfaction. 3 –5 However, locally based research has highlighted that NHS Direct is underutilized by men 6 and ethnic minority groups 6,7 alongside older people (65+ years old). 8,9 There has also been research that has suggested lower utilization among less advantaged social groups, 7 although these results have shown great variation. 10
For example, Shah and Cook 7 analyzed data from the 2004–2005 British General Household Survey, which included 20,421 participants. A subsample of 7,634 (87.7%) households was asked if they had used NHS Direct, with 1,624 households (20.7%; range, 19.7–21.8%) reporting use in the last year. Results indicated NHS Direct use was higher in larger households and among those with children but lower in households with older people. Furthermore, there was a direct association of low utilization of NHS Direct with material deprivation and low social status, low household income, living in social housing, manual occupation groups, and income support. Furthermore, they found that when accounting for limiting and long-standing illness, material deprivation had a stronger relationship of low utilization for the poorest individuals when compared with the most affluent.
However, ecological studies have provided contrasting findings. 10 –12 To date there have been three published localized ecological studies that have matched data from NHS Directs Clinical Assessment System with geographical ward level in urban areas, which have included South East London, 12 Lancashire, 10 and West Yorkshire and West Midlands. 11 Bibi et al. 10 found that there were no significant differences for socioeconomic deprivation in relation to NHS Direct utilization. However, conversely, Burt et al. 12 mapped 75,928 calls to Jarman and Townsend scores 13 and found that lower use of NHS Direct was seen in both the most affluent groups and the most deprived groups. Cooper et al. 11 further explored this and confirmed that call rates for the 0–4 year age group were lowest in the most deprived wards, although call rates for adults 15–64 years of age rose with increasing deprivation. It is interesting that there were no socioeconomic factors associated with call rates for older people (65+ years).
However, it is important to note that these studies could be distorted as they only focused on one area rather than offering a national geographic perspective. Furthermore, the aforementioned studies used ward data, which only capture use at the district level, thus assuming that each district manifests the same level of deprivation, which is not the case when taking into account smaller geographies such as the lower super output area (LSOA). A further limitation of two of the research studies is that conclusions are drawn from census-based measures such as Jarman 14 and Townsend 13 indexes, which are now dated. Therefore, this research study focuses on the characteristics of a national population in England to determine if deprivation, age, and gender impact on the utilization of NHS Direct using a smaller unit of geography to match utilization by postcode to smaller population counts in England.
Subjects and Methods
Call data from 1 month (July 2010) was collected from the Clinical Assessment System for all 0845 4647 calls made in England. It is important to note that it was the patient's data that were collected, not necessarily data of the caller. Ethical approval was provided by the NHS Essex 1 Research Ethics Committee (reference protocol 10/H0301/29). Postcodes were mapped using geographical software (Arc GIS) to analyze for geographical dispersal of calls. Descriptive statistics were also used to analyze for age and gender characteristics of patients.
To analyze for deprivation, age, gender, and full postcode were taken for all calls, with all missing cases excluded from analysis. Age, gender, and full postcode were aggregated to every age/gender count for all LSOAs (these are geographical boundaries, of which currently there are 32,482 in England, which have between 1,000 and 3,000 people living in them with an average population of 1,500 people) in England aggregated by age and gender using mid-2009 population estimates. 15 Because of the age categories available through the population statistics, NHS Direct data was aggregated using the age groups <15, 16–29, 30–44, 45–64, and ≥65 years for males and <15, 16–29, 30–44, 45–59, and ≥60 years for females. As both males and females had different age ranges, the datasets were recoded separately for both genders and then remerged.
The Index of Multiple Deprivation (IMD) 2007 score was used as a measure of deprivation 16,17 and matched to postcode using Geo Convert software. All IMD measures were divided into five deprivation quintiles, with each quintile composing 20% of the population of England. A higher IMD score or deprivation quintile indicated increasing deprivation.
SPSS (version 19) software was used to provide descriptive statistics and to complete a negative binominal regression, which was fit for modeling count variables and usually for overdispersed count variables. 18 To compensate for the issue of including false zero calls (i.e., where you wouldn't expect a call as the population count was too small), the aggregated files were merged to the LSOA population statistics. This then provided a population count for every age/sex category across every LSOA. The mean expected call rate across the whole sample was calculated, and this was then applied to the cell population counts. A threshold expected number of calls was set at 0.4. If a population cell had zero calls recorded and its expected number of calls was below 0.4, this was computed as a missing value, and the cell was removed from the analysis. All cells with zero recorded calls that had expected call numbers above 0.4 were seen as true zeros and were included in the analysis. From this, in total, 9,275 cases were excluded, accounting for only 2.6% of the total sample. This procedure was preferred to including a population-based offset term in the regression as this would have meant call rate could not have been the dependent variable, thus reducing comparison with previous research. The unit of analysis for this model was the 1-month call rate per 1,000 population in 10 age/gender subgroups. The main predictor variables were gender, age, and IMD quintile, and all two-way interaction terms were included in the model.
Results
In total, 359,758 calls were made to the NHS Direct core 0845 4647 service during July 2010. Figure 1 illustrates the geographical dispersal of calls in England, United Kingdom. Calls made were geographically mapped per primary care trust 19 (these are local organizations that manage all primary care in England; currently, there are 151 primary care trusts in England) as a percentage of the population. Lowest call rates were characterized as 0.3–0.55% of the population, compared with the highest call rates ranging from 0.78% to 1.13%. Calls were seemingly higher in more urbanized cities (London, Leicester, Nottingham, Leeds, and Liverpool) and in the South of England, with lowest calls shown in more urbanized areas located toward the North of England.
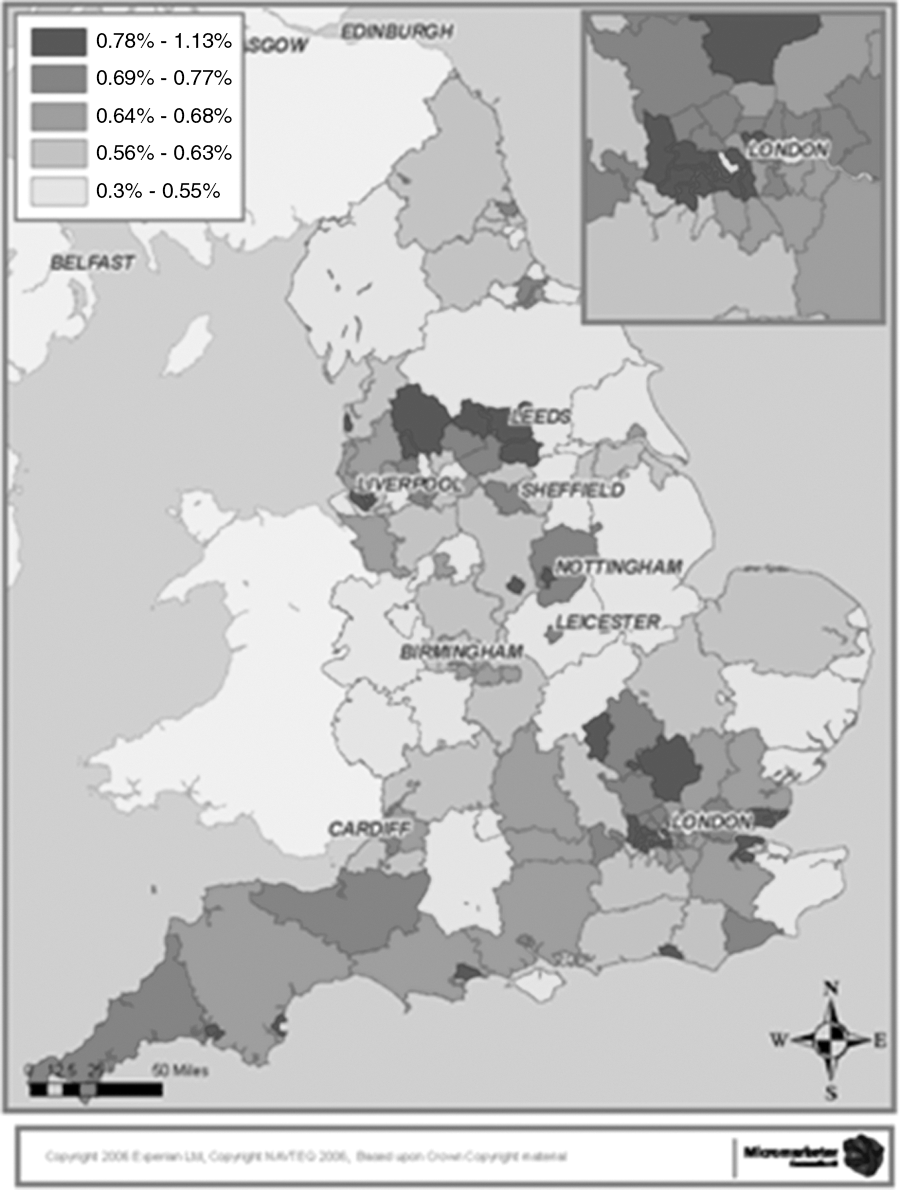
Calls to National Health Service Direct per primary care trust in July 2010 as a percentage of the population.
Most of the calls were on behalf of female patients, which accounted for 59.3% (n=202,659), with the remaining 40.7% were on behalf of males (n=139,004). In total, 18,095 cases were missing and so were excluded from analysis, leaving an aggregate of 341,663 remaining cases analyzed. Figure 2 displays the percentage of calls made by or on behalf of males and females by age for the month of July 2010. The highest number of calls can be seen in the 0–4 year old age range, with calls made on behalf of males accounting for 22.8% of all calls, almost 10% more than females. This pattern then changes, with lower call rates shown for both males and females in the younger age groups 5–9, 10–14, and 15–19 years old. There is a notable rise in the age range for 20–34 years, especially for females. Both males and females show similar rates of calls for age groups 35–90+ years, after which a downward trend is found with increasing age, with adults of 90+ years only accounting for 0.7% and 0.4% of all calls for females and males, respectively.

Percentage of calls made to National Health Service Direct in July 2010 for males and females.
AGE, GENDER, AND DEPRIVATION
A negative binominal model was used to analyze the data. The model highlighted that there was a significant interaction between age and gender (χ2=536.28, df=4, p<0.001) and age and IMD (χ2=180.16, df=16, p<0.001) alongside gender and IMD (χ2=9.06, df=4, p=0.06).
Tables 1 and 2 present the analysis from the negative binominal regression and show call rates made by or on behalf of the five age groups across all IMD quintiles for both males and female patients who used NHS Direct in July 2010. For males, call rates were lowest in the most deprived LSOAs (95% confidence interval, 0.94–1.14) in the youngest age group (0–15 years old), with highest call rates found in moderate deprivation areas (95% confidence interval, 1.03–1.26) (Table 1). However, for males 16–59 years old deprivation increased use (p<0.001), with lowest call rates found in the most affluent LSOAs. It is interesting that for males who were older (65+ years), lowest use was found in the most deprived areas; however, this was not significant (p>0.05), with both quintiles 4 and 5 showing similar call rates areas (95% confidence interval, 0.95–1.29 and 0.96–1.30, respectively).
Call Rate Ratios for National Health Service Direct Calls During July 2010 in England for Males by Age Group and Index of Multiple Deprivation Quintile
Comparison group call rates per thousand are in parentheses.
CI, confidence interval.
Call Rate Ratios for National Health Service Direct Calls During July 2010 in England for Females by Age Group and Index of Multiple Deprivation Quintile
Comparison group call rates per thousand are in parentheses.
CI, confidence interval.
For females, a similar pattern was found where lowest call rates were found in the most deprived areas in the lowest age group (0–15 years old) (95% confidence interval, 0.63–0.78) with highest call rates found in the most affluent LSOAs (Table 2). It is interesting that females had highest call rates in quintiles 4 and 5 (16–29 years old, p<0.001; 30–44 years old, p<0.001) compared with males who had highest call rates in quintile 5. For females 45–60 years old, deprivation increased use (p<0.001), and call rates for or on behalf of females 60+ years old were highest in moderately deprived areas (95% confidence interval, 1.10–1.34) and slightly decreased in areas with highest deprivation (95% confidence interval, 1.08–1.31, p<0.001), although it remained lowest in the most affluent LSOAs (p<0.001).
Discussion
SUMMARY OF MAIN FINDINGS
The data suggest that call rates vary by age, gender, and deprivation. Highest call rates were found on behalf of children 4 years and under alongside adults 20–34 years old, with the lowest users characterized as males and older people. This trend, except for older people, is representative of the utilization pattern found within primary healthcare services in England. 20 –22 Therefore the question that arises is why older people appear to be the lowest users of NHS Direct although they continue to be one of the largest cohorts of primary healthcare users. 22 –24 This suggests that older people may have less awareness of NHS Direct. This issue has been examined previously. For example, David 25 interviewed a sample of patients 70 years old and above in a general practice surgery in the West Midlands, United Kingdom; findings highlighted that awareness of NHS Direct declined with age, with only 32% being aware of NHS Direct. Furthermore, qualitative research that has explored older people's views of out-of-hours services has found that satisfaction with current healthcare among a reluctance to seek healthcare over the phone could be distinct barriers to using services such as NHS Direct 26 ; however, this research is now dated, and therefore more recent research is needed to highlight if there are any changes.
When analyzing for deprivation there were age and gender differences demonstrated. For males, deprivation increased use, with highest call rates found for those 16–65 years old. This population subgroup are often not frequent users of healthcare, 22,27 and therefore this presents a positive public health finding and opens a debate about how telephone-based healthcare can increase access to low users of healthcare. However, for children (0–15 years old) and older men (65+ years old) call rates were highest in areas of moderate deprivation (quintile 4) and reduced in areas of extreme deprivation. These findings are similar to those found by Cooper et al. 10 ; however, this pattern was not replicated by females. Lowest call rates were found in the most deprived areas in the lowest age group (0–15 years old); calls in age groups were more evenly spread between the two most deprived quintiles (16–44 years old), with call rates dropping in areas of extreme deprivation for older females (60+ years old).
When focusing on research that has explored the distribution of utilization of healthcare services, research suggests that deprivation increases use to out-of-hours services, with highest utilization found for younger children. 4,28,29 However, this study has suggested that use of NHS Direct is most likely to be used on behalf of children 0–15 years old regardless of gender and deprivation. However, for adults there was increased use among deprived areas. This pattern may well be due to satisfaction of current healthcare and perhaps lack of knowledge. However, to date no research has qualitatively explored barriers to using NHS Direct in deprived neighborhoods, which is essential to determine stringent factors that impact on NHS Direct utilization.
STRENGTHS AND LIMITATIONS OF THE STUDY
This research is the first national analysis that has used current NHS Direct data that has adopted a methodologically sound approach to understanding the sociodemographic characteristics of NHS Direct users. The statistical advances have also been a clear strength of this research, where the IMD 2007 has been a more current deprivation proxy with the addition of including LSOAs in the analysis that have made no calls so that the analysis was not biased.
However, there have been some limitations that should be recognized. First, the data have been collected via the NHS Direct clinical database, where there were some missing postcodes and data for age and gender that had to be excluded for the binominal regression analysis; however, the number excluded was not thought to impact on the statistical interpretation of analysis. Furthermore, this study did not take into account the measurements of the subscore quintiles of the IMD, which could be used to determine if any specific type of deprivation is related to percentage of calls to NHS Direct, which could provide an interesting scope for future research. This study did not look at out-of-hours as an outcome variable; therefore it would be interesting to determine how NHS Direct has impacted on the out-of-hours utilization in today's climate. When the data population estimates aggregated from mid-2009 were used, 15 these are only estimates and thus are not as accurate as census; however, the last census was 2001, and the latest census data were not available. Furthermore, age categories had to follow the structure of the population estimates so analysis was limited to five age categories. One final limitation that should be acknowledged is that this research did not separate symptomatic calls from health information calls, which may provide an interesting scope for future research.
Conclusions
These findings will assist the development of promotional campaigns to target particular sections of the population, encouraging increased use of telephone-based health advice and information. Further research is needed to explore the underlying factors that contribute to the variation in uptake of telephone-based health services. As uptake of NHS Direct services increases, it is imperative to examine whether there has been any consequential impact on the uptake of other NHS services. This evidence base will assist the commissioning and provision of future remote telephone-based health services.
Footnotes
Acknowledgments
We would like to thank NHS Direct for the contribution of their data to this study and Mosaic for the support with the geographic information system mapping. This research was jointly funded by NHS Direct and the University of Bedfordshire.
Disclosure Statement
No competing financial interests exist.