
Abstract
Introduction
Numerous studies evaluating effectiveness of screening for vision-threatening diseases (VTDs) such as glaucoma, diabetic retinopathy (DR) and macular edema, age-related macular degeneration (AMD), cataracts, and retinopathy of prematurity have been published. 1 –4 Although not without certain barriers to implementation, 5 the overarching conclusion of these studies was that such programs are feasible and potentially cost-effective. The utility of such efforts in the early detection of blinding diseases where prompt diagnosis, referral, and treatment may be vision-saving or -preserving should not be overlooked. For example, up to half the people with glaucoma or glaucomatous visual field changes may not be aware that they are affected, yet early institution of therapy can preserve vision and delay blindness. 6,7 Similarly, an early diagnosis of AMD may be followed by initiation of necessary treatment based on disease subtype.
Supplementing current vision screening methods, which predominantly use digital color fundus photos, with novel imaging modalities and/or techniques to improve analysis of acquired digital images may result in a program with enhanced detection of VTDs. 8 The application of digital filters in the early detection and timely intervention in individuals with DR and AMD has been previously reported. 9 In the following, we describe the use of software-assisted analysis of non-mydriatic color fundus images during a comprehensive ocular screening.
Subjects and Methods
The New Jersey National Guard–50th Infantry Brigade Combat Team returning from active tours of duty and veterans from New Jersey were screened in two separate locations (Atlantic City, NJ; and Lakewood, NJ). In total, 128 subjects participated in the screening process. This research was approved by the University of Medicine and Dentistry of New Jersey Institutional Review Board.
Our screening program has been described in detail previously. 10 In brief, the screening team consisted of medical and pre-optometry students, an imaging specialist, and an on-site medical director. The students were responsible for focused information intake (e.g., medical, ocular, and family history), measurement of blood pressure, heart rate, pulse oximetry, and calculation of body mass index, visual acuity (VA) (SIMAV, Padova, Italy), and visual field analysis (frequency doubling technology; Carl Zeiss Meditec Inc., Dublin, CA) (Fig. 1A). The obtained Snellen VA was converted to the logarithm of the minimum angle of resolution (logMAR) in order to calculate the mean VA. Mean logMAR VA was then converted back to mean Snellen VA. The imaging specialist determined intraocular pressure (IOP) (model Tx-F full auto non-contact tonometer; Canon, Tokyo, Japan) and performed non-mydriatic fundus imaging of the anterior and posterior segments (model CR-DGi camera with EOS-20D 8.2-megapixel camera back; Canon) (Fig. 1B). At the end of the screening process, an on-site medical director reviewed the screening information and output from software-assisted image analyses, counseled the screening participants, and made referrals for ophthalmology examination as deemed necessary (Fig. 1C). Information packets in English or Spanish on topics such as diabetes, hypertension, and smoking cessation were provided based on the history obtained or determined predispositions. On average, 13 subjects were screened per hour (not including the time needed to review results and counsel participants).
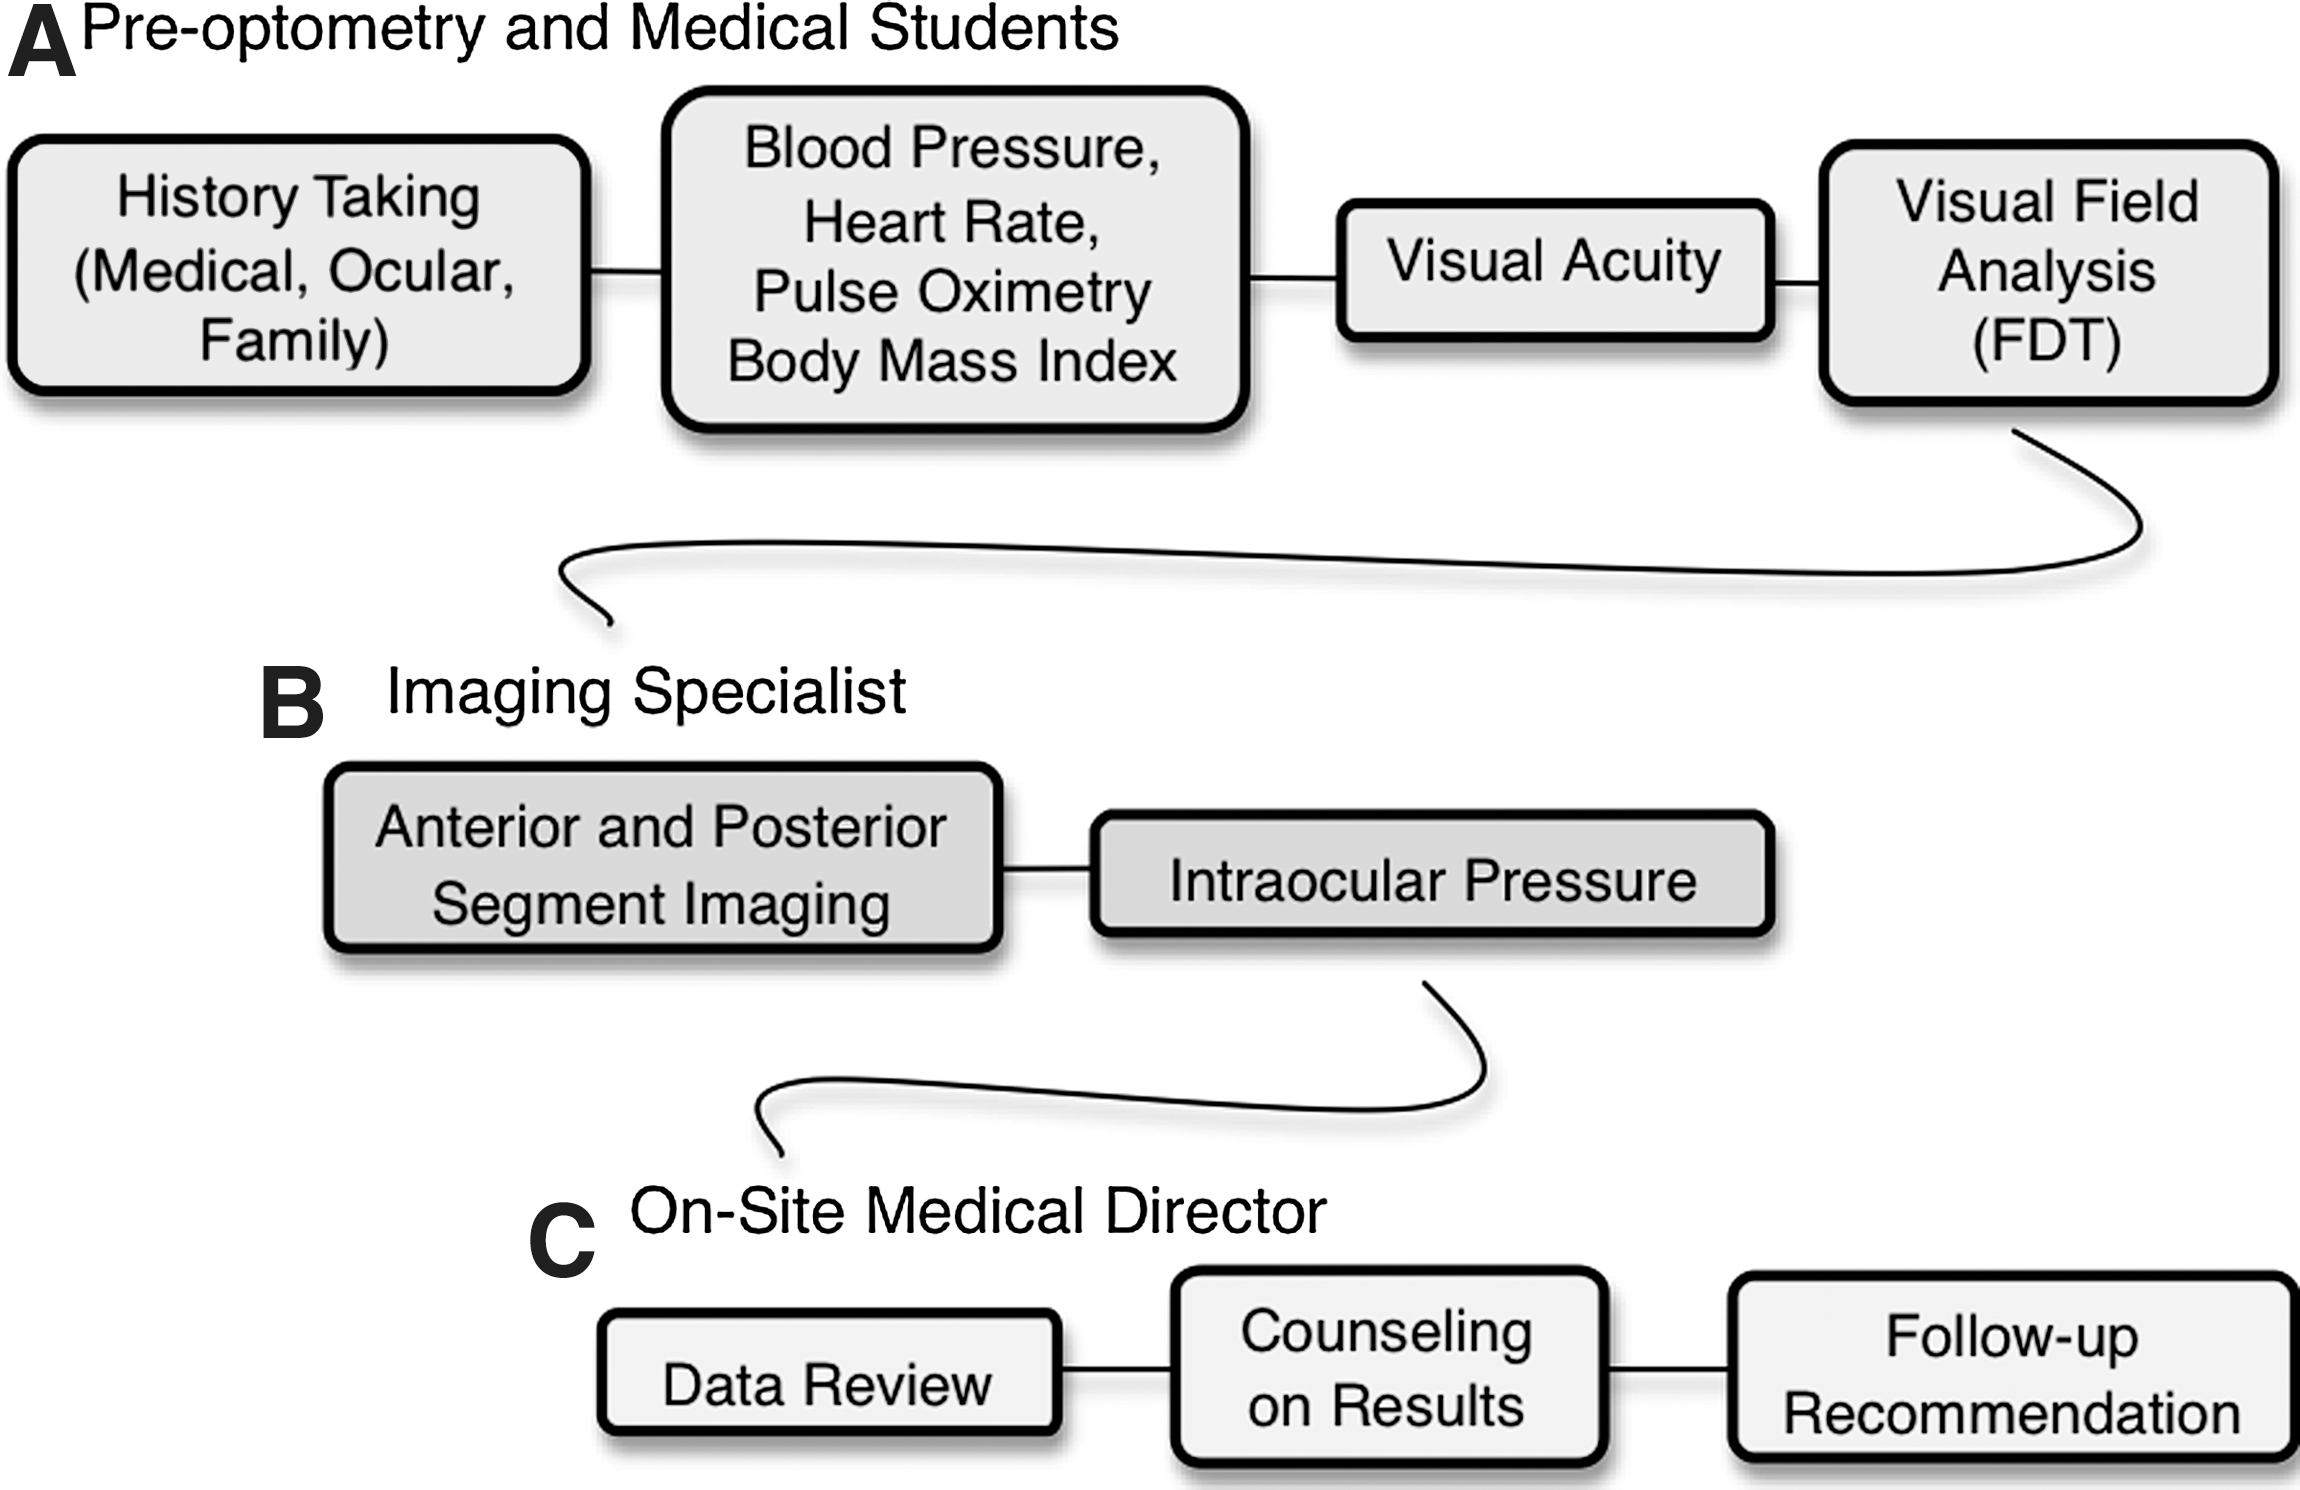
Screening workflow. FDT, frequency doubling technology.
Non-mydriatic color fundus images were obtained via the CR-DGi camera with EOS-20D 8.2-megapixel camera back and saved on a laptop (Fujitsu, Kanagawa, Japan) with a high-resolution, wide-screen (1440×900 pixels; 32-bit color quality) preview. Detailed image analysis was performed using Canon Medical Systems (Irvine, CA) Eye-Q software with a Digital Imaging and Communications in Medicine–compliant imaging, which allowed for separation of one image into three monochromatic channels (i.e., red, green, blue [RGB]) to aid in the identification of potential VTDs (Table 1): the blue (490 nm) filter highlighting the nerve fiber layer was used to evaluate eyes for glaucomatous change, the green (550 nm) filter highlighting the neural retina was used to evaluate eyes for diabetic and vascular changes, and the red (610 nm) filter highlighting the pigmented retina and the choroid was used to evaluate eyes for changes associated with degenerative retinal diseases. A fourth “emboss” digital filter allowed for a topographical map evaluation of the posterior pole for graphic illustration of elevations or depressions; the two modes of the “emboss” digital filter were the “positive” (148°), focusing on the macula/peripheral retina, and the “negative” (–32°), focusing on the optic nerve. Data were encrypted without degrading image interpretation by the aforementioned software. 11 Images were reviewed side by side for simultaneous bilateral comparison of the right and left eyes when available. They were evaluated for optic nerve size, neuroretinal rim color, cup-to disc ratio and asymmetry, nerve fiber layer integrity, artery-to-vein ratio, microvascular changes, pigment changes, and macular and peripheral drusen.
Software-Assisted Digital Filters
Canon Medical Systems Digital Imaging and Communications in Medicine–compliant Eye-Q imaging software.
Evaluates elevation (i.e., macula, peripheral retina).
Evaluates depression (i.e., optic nerve).
Results
Mean±SD age was 37.5±11.6 years. Males represented 66% of the study population. Forty-three percent were white versus 26% African American, 23% Hispanic, and 8% other. Seventy-one (56%) participants reported having had a comprehensive, dilated fundus examination within the past 2 years. Mean VA was 20/29 in the right eye and 20/30 in the left eye. Twelve (9.4%) right eyes and 11 (8.6%) left eyes had a VA<20/40, ranging from 20/50 to 20/100 and 20/50 to finger counting in the right and left eyes, respectively. Eight (6.3%) participants (mean age, 32.3 years) were classified as having functional visual deficiency (VA<20/40 in the better seeing eye). The one participant with a finger counting vision in the left eye reported blunt ocular trauma with a rock in childhood. The mean IOP was 14.1 mm Hg and 14.2 mm Hg in the right and left eyes, respectively, with two (0.4%) hypertensive eyes (IOP=22 mm Hg in both).
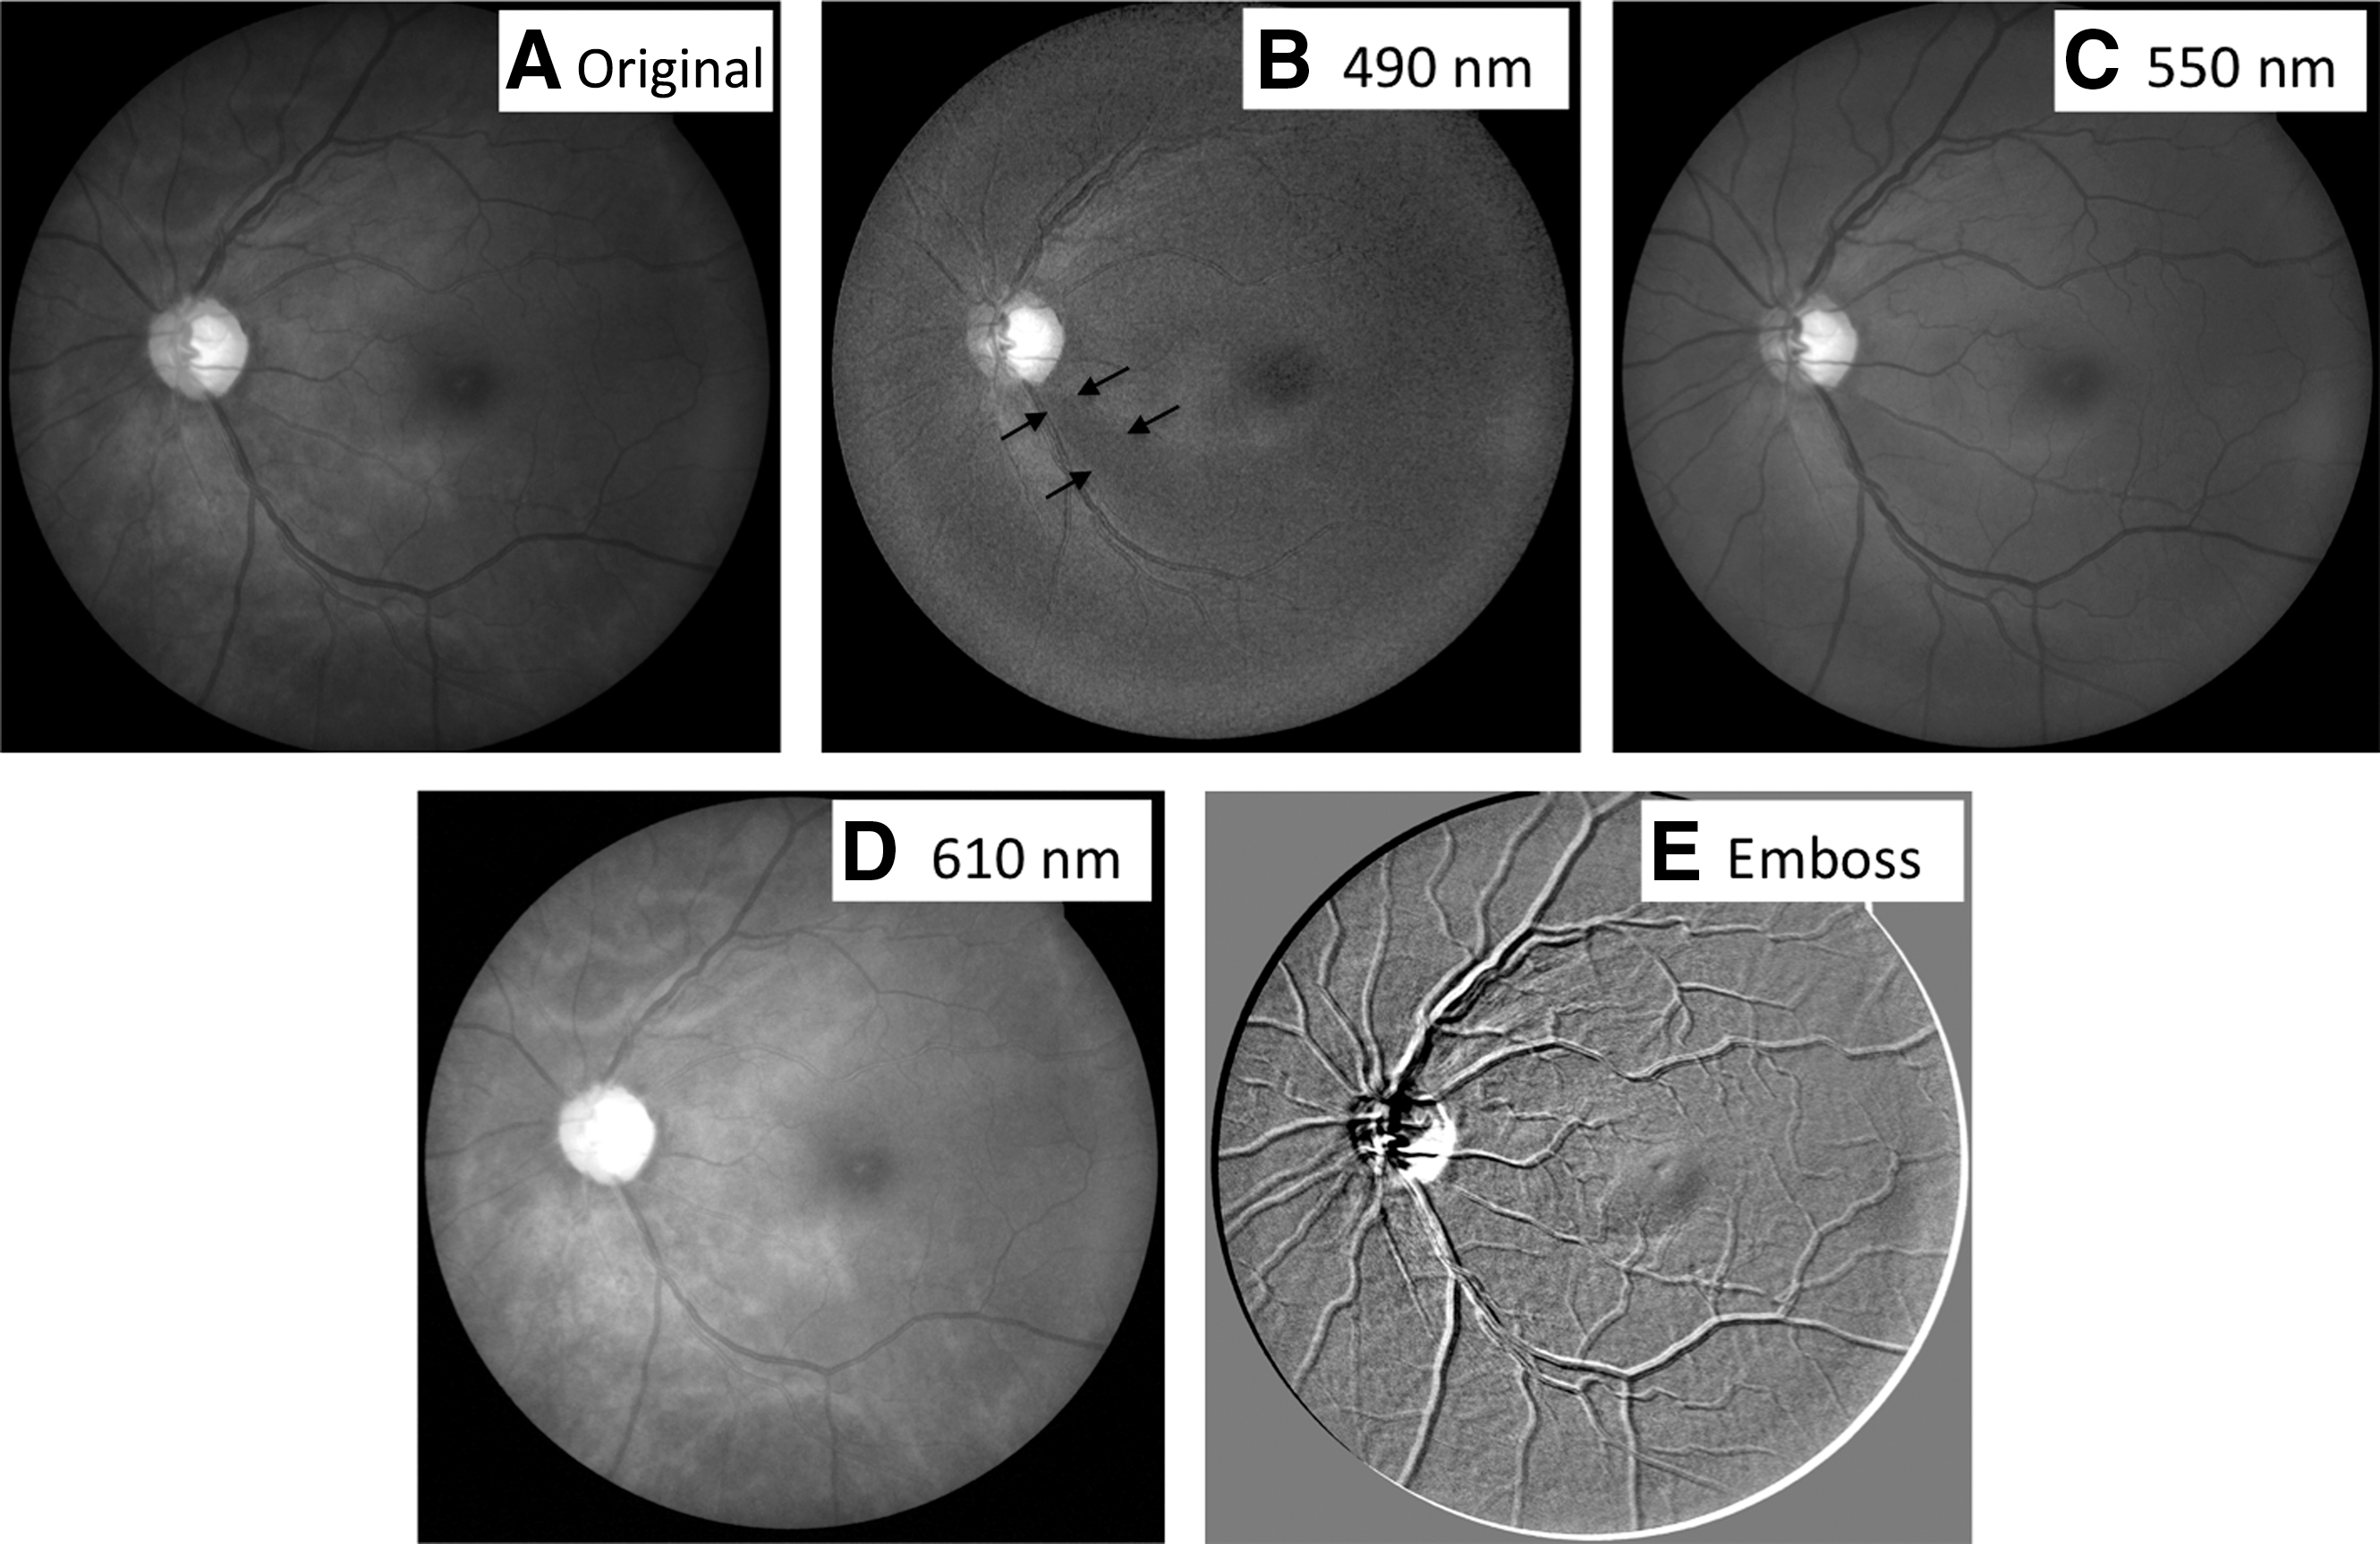
On average, 26 eyes were imaged per hour. Separating each color fundus photo into RGB monochromatic channels and converting it into an “embossed” image resulted in an evaluation of 130 images/h. We identified 6 (4.7%) participants with macular/perimacular drusen with retinal pigment epithelium changes (highlighted in the red channel and by “positive emboss”) (Fig. 2), 3 (2.3%) participants with findings suspicious for glaucoma (nerve fiber layer drop off in the blue channel and increased cup-to-disc ratio in “negative emboss”) (Fig. 3), 2 (1.6%) participants with proliferative DR (cotton wool spots in the blue channel, preretinal and dot-blot hemorrhage in the green/blue channels, and “positive emboss”) (Fig. 4), 1 (0.8%) participant with a choroidal nevus (highlighted in the red channel), and 1 (0.8%) participant with a cataract. Based on these findings, 9 (7.0%) participants were referred to a primary ophthalmologist, 3 (2.3%) to a glaucoma specialist, and 1 (0.8%) to a retina specialist (Fig. 5). One (0.8%) subject was referred to an ophthalmologist because of the inability to obtain adequate fundus images secondary to small pupil size.

Subject with age-related macular degeneration, left eye.
Subject with glaucoma, left eye.
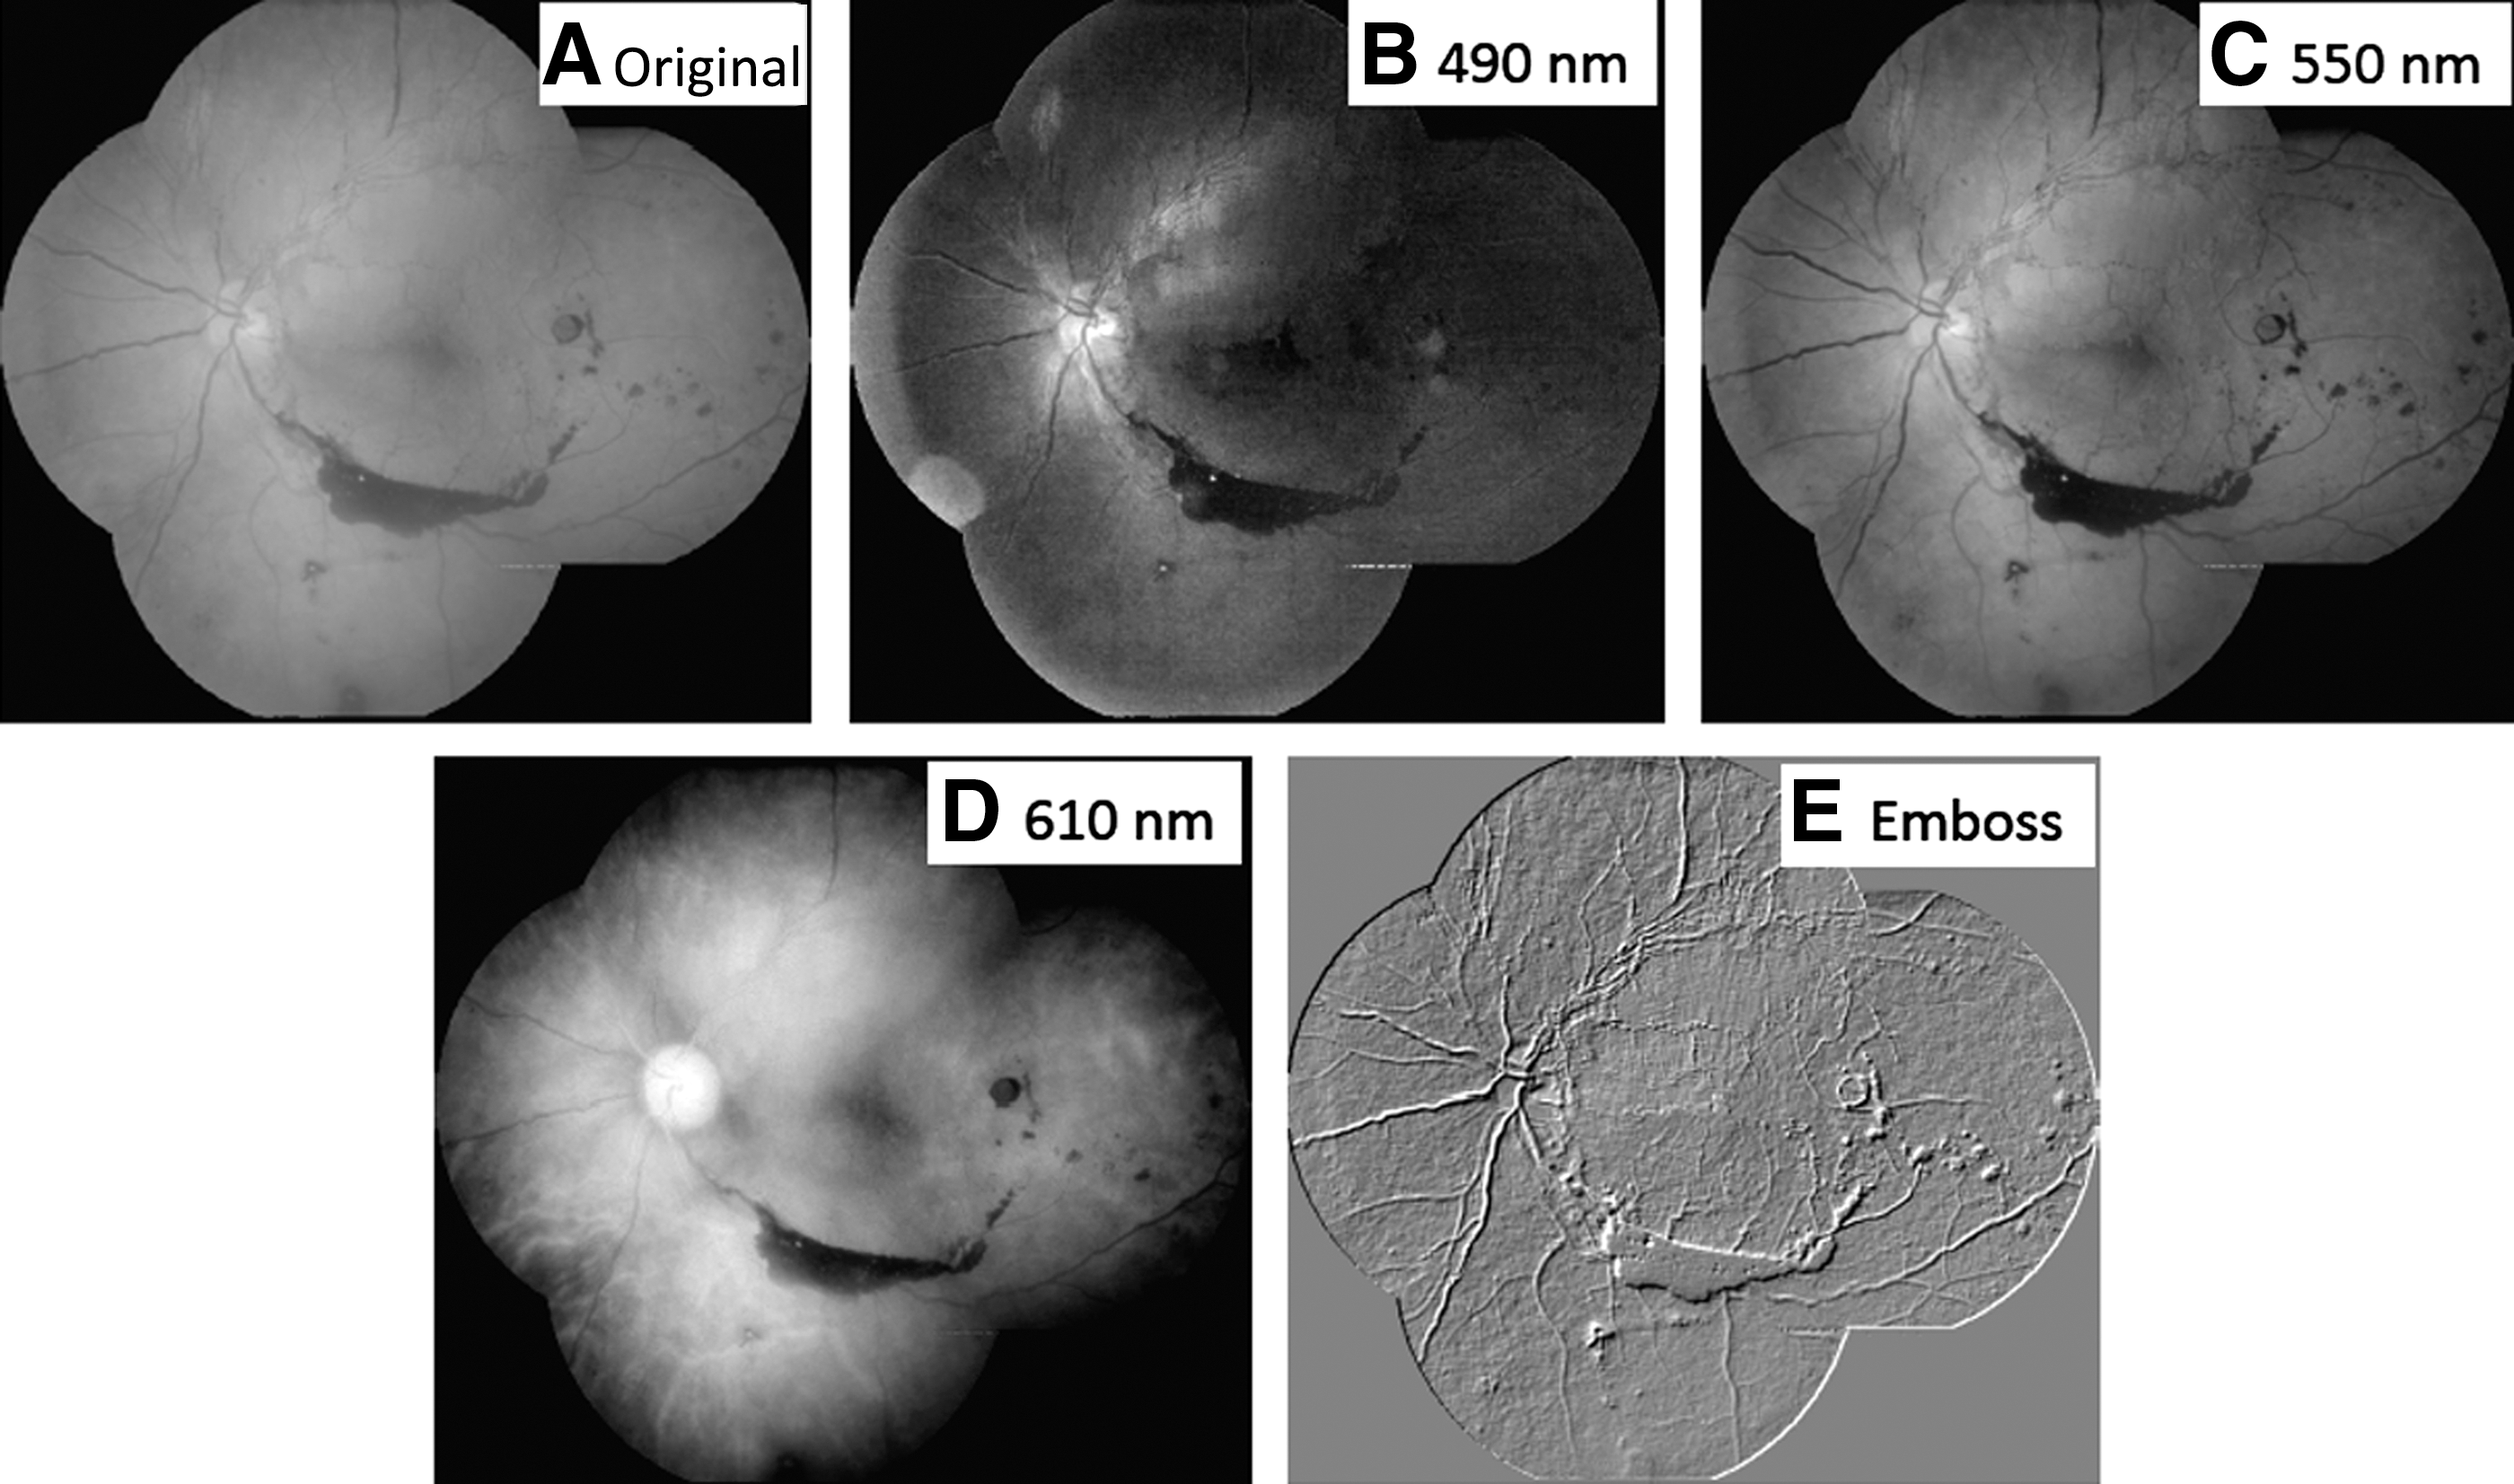
Montage of five 45° images of a subject with proliferative diabetic retinopathy, left eye.
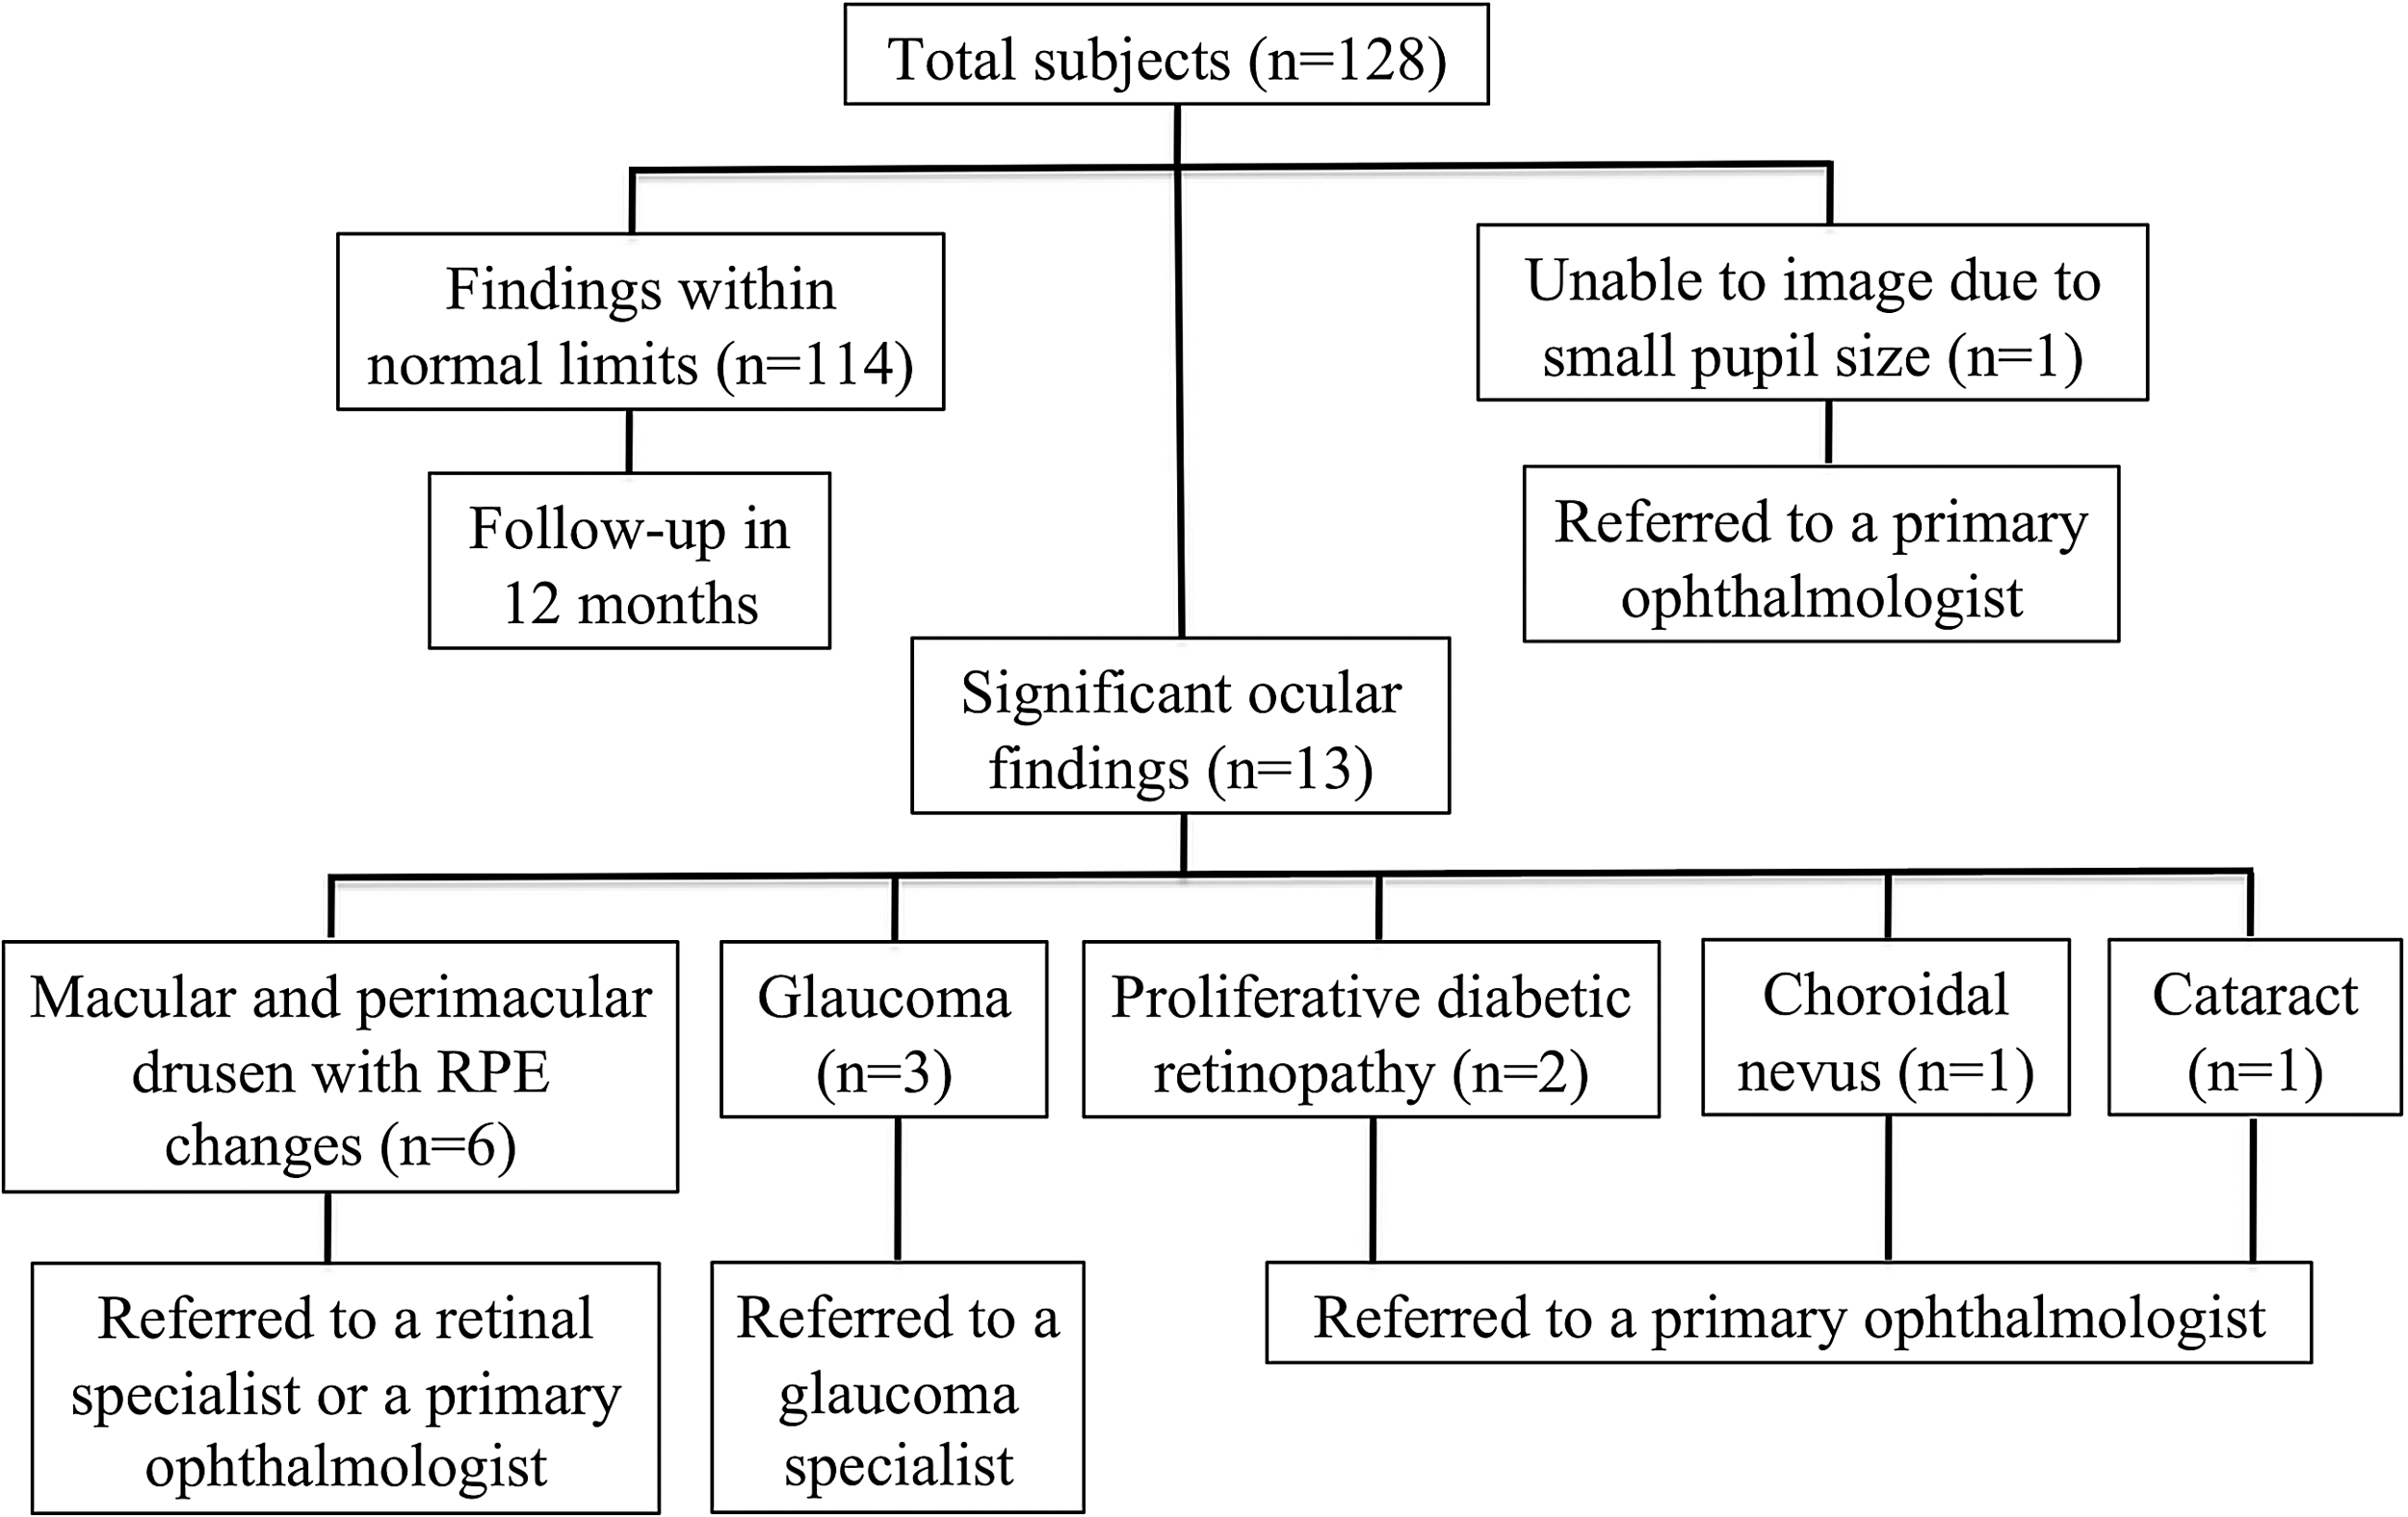
Flow chart of imaging findings and referrals. RPE, retinal pigment epithelium.
Discussion
Several investigators have described the application of software in quantification of various parameters used in VTD detection and assessment. Varma and Spaeth 12 introduced PAR IS 2000, which is a way to analyze digital images to evaluate the optic nerve and the position of retinal vessels and to create topographic retinal maps. Cox and Wood 13 developed a computer system to assess the shape and degree of pallor of the optic nerve. Khouri et al. 14 incorporated software in telemedicine application to assess the optic nerve cup-to-disc ratio. Zarbin and Szirth 9 described their experience with RGB digital filters in early detection of individuals with DR and AMD. Cheung et al. 15 used computer-assisted image analysis to improve differentiation of retinopathy of prematurity disease severity and to predict treatment outcome. McClelland et al. 16 calculated cup-to-disc and arteriole-to-venule ratios using an imaging software program. With the development of standardized systems such as EyePACS, which is a telemedicine-based DR screening program, the incorporation of software-assisted imaging analysis in screening programs may occur with relative ease. 17 In addition to the support garnered from the abovementioned studies, the capacity of monochromatic filters to identify pathology to a distinct layer in the posterior segment has been clinically validated by the use of automated software detection of DR by red or bright lesion detection 18 and by correlation with color fundus 10 and ocular coherence tomography (OCT) findings (authors' unpublished data) in our center.
The purpose of our study was to test the feasibility of incorporating software digital filters during telemedicine. Software components for monochromatic filters were successfully interphased with existing imaging software. There were no software or hardware discord and no interruptions in screening workflow that could have affected the number of subjects screened per hour in our ocular screening program for VTDs. The imaging software is able to extract four images from one by isolating wavelength (RGB) and topography (“emboss”), permitting a more accurate assessment of posterior segment pathology and the potential to improve triage to the appropriate subspecialty in ophthalmology. The use of these monochromatic filters allowed localization of pathology identified during fundus imaging to a specific layer. In addition to the totality of data obtained during the screening, the ability to precisely localize pathologic findings allowed the medical director to be confident when making a referral for either general or specialized ophthalmologic evaluation. We believe that specialized imaging software (i.e., RGB and “emboss” filters) would constitute a valuable addition to standard color fundus imaging because it would likely facilitate and enhance identification and/or localization of ocular pathology. Such advancement may be relevant for ophthalmologists, optometrists, emergency room physicians, and various telemedicine applications. 19 The benefits of software-assisted screening during urban community outreach has also been shown. 10
The ability to separate color images into RGB monochromatic color panes has been previously described in image analysis systems to characterize cataracts, 20 to identify drusen (for automatic AMD detection), 21 and to focus on blood vessels (for DR identification). 22 van Velthoven et al. 23 combined angiographic and OCT images into RGB images of several ocular disease processes (e.g., choroidal neovascularization, myopia, and birdshot chorioretinopathy) and concluded that this resulted in an improved interpretation and correlation of structural and functional information. RGB technology has also been applied in image acquisition in dermalotogy 24 and lymphoma classification. 25
On average, 26 eyes were imaged and 130 total digital images were evaluated per hour. We identified VTDs in 13 (10.2%) participants who were subsequently referred for specialty care. Imaging was not successful in only 1 (0.8%) subject because of small pupil size bilaterally. This screening participant was referred for general ophthalmology evaluation. In our previous study, 12–15 subjects were imaged per hour, and the rates of detection of VTDs and inadequate imaging were 31% and 3.8%, respectively. 10 We believe that the considerably lower rates of VTD detection and inadequate imaging in the current study are likely attributable to the younger age (mean, 37.5 versus 53.6 years) and different ethnic distribution (e.g., percentage African American subjects, 22% versus 78%) in the current versus the previous study. This assertion is supported by the fact that, in our previous study, glaucoma and cataracts were detected in 32% and 21% of subjects, 10 respectively, whereas the rates in the current study were 2.3% and 0.8%, respectively.
Efficient screening and referral allows for timely delivery of necessary medical, surgical, or rehabilitative treatment, thereby optimizing visual potential for these individuals. Referral recommendations were made within the appropriate healthcare networks; however, because we were unable to obtain follow-up data, it was not possible to determine the rates of false-positive and false-negative findings in our study. Although such data would be valuable in evaluating the overall utility of our screening efforts, subject follow-up after screening events is a long-standing limitation of screening efforts. For example, Quigley et al. 26 showed that even after providing transportation at no cost, only 41% of screened persons completed a follow-up visit.
The addition of fundus autofluorescence imaging with correlation to OCT imaging may have an added value for evaluating retinal pigment epithelium and retinal damage difficult to detect with traditional 45° non-mydriatic color retinal imaging or direct ophthalmoscopy. 27 In this study, we focused on the utilization of RGB and “emboss” filters in a screening program that uses a small footprint imaging system and have found this technology to have good application and efficacy in such a setting.
The integration of specialized imaging software into our ocular screening program resulted in an efficient and detailed assessment of non-mydriatic fundus images. The use of software-assisted digital filters allowed for improved localization of ocular pathology, thereby optimizing referral patterns. The use of other imaging modalities such as fundus autofluorescence and OCT in conjunction with software-assisted imaging may have additional applications in telemedicine. Because the U.S. Department of Veterans Affairs has already incorporated telescreening for DR as part of their patient care process, 19 incorporation of digital filters may have ramifications for detection of other VTDs. This potential application should be addressed in subsequent studies. On the basis of this pilot study, analysis of future applications of software-assisted digital filters in vision screening is warranted. Additional studies should focus on determination of the cost efficiency and impact on diagnosis of such software-assisted programs in underserved areas and whether lack of general or specialized ophthalmologists could be compensated for by the use of fundus color imaging with specialized digital filters.
Footnotes
Acknowledgments
This study was supported by Research to Prevent Blindness, Inc., and the Friends of the Congressional Glaucoma Caucus.
Disclosure Statement
No competing financial interests exist.