
Abstract
Introduction
Advances in science and technology have historically significantly impacted healthcare delivery. Various authorities have recognized this trend, suggesting that health practices incorporate new norms and standards that serve the interests of the international community and align themselves with current realities of global health. 1 –3 The reality of hearing health in Sub-Saharan Africa is that there are approximately 250,000 to 7.1 million people per otolaryngologist. 1 The World Health Organization indicated the number of audiologists in developing countries as between one audiologist per 0.5 million people to one per 6.25 million. 4 Ironically, more than 80% of people with moderate to profound hearing loss live in low- and middle-income countries, such as those in Sub-Saharan Africa, where hearing health professionals, and subsequently hearing health services, are either completely absent or very limited. 5 Consequently, a new, innovative means of bringing hearing health services to people, such as telehealth, should be investigated as a high priority. 6 The global revolution in connectivity and continuing advances in technology mean that hearing health delivery through telehealth is becoming increasingly possible to underserved regions. 2,7
The video-otoscope is an example of technology that extends the capabilities of the conventional otoscope as a tool for ear canal and tympanic membrane examination, allowing digitized images of these to be reviewed, stored, archived, and transmitted for medical specialist opinion. The video-otoscope, incorporated into a hearing telehealth program, has the potential to allow provision of specialist care to people in rural and remote areas. 8,9
Previous studies concluded that video-otoscopic images are equivalent in quality to face-to-face otoscopy. 6,8,10 –12 A comparison of four video-otoscopes found that three of the four systems yielded images rated as adequate or better for at least 80% of the images. 8 Previous studies reported 75–82% of video-otoscopic images were judged to be adequate, good, very good, or excellent in quality. 11,13 It is important that for the purpose of validation of video-otoscopy within a hearing telehealth clinic, studies have demonstrated average to good diagnostic concordance between conventional otoscopy and video-otoscopic images. 12,14 –16
Three studies have made use of video-otoscopy for telehealth applications within underserved communities. 12,15,16 Patricoski et al. 12 compared the diagnosis made from microscopic examination of ears post-tympanostomy tube placement with that made from asynchronous video-otoscopic images taken by two otolaryngologists; diagnostic concordance between the aforementioned methods indicated substantial agreement with κ values ranging from 0.67 to 0.76. Using an experienced video-otoscopist to acquire video-otoscopic images, Eikelboom et al. 15 reported significant correlations between image quality and age of the participant and between clinically important observations of the tympanic membrane during face-to-face otoscopy and asynchronous evaluation of video-otoscopic images. In addition, significant diagnostic agreement was demonstrated, although the referral rate after asynchronous assessment was 4–16% higher than those in made in the field. The study emphasized the importance of the participant's clinical history and audiometric and tympanometric data in order to assist the otolaryngologist in making an asynchronous diagnosis using the images.
Kokesh et al. 16 evaluated video-otoscopic images taken by a community healthcare worker, but, as with the study of Patricoski et al., 12 the population was limited to children attending follow-up appointments following tympanostomy tube placement. Concordance between the diagnoses of two otolaryngologists based on asynchronous evaluation of video-otoscopic images was substantial (κ=0.70) compared with near perfect concordance during face-to-face otoscopy (κ=0.83), which served as the gold standard. Despite the aforementioned studies there is still a dearth of investigations on the diagnostic validity of video-otoscopic images taken from a heterogeneous group of patients. In particular, no validation study on video-otoscopic images taken by a telehealth clinic facilitator without formal tertiary education in a typical hearing telehealth program in an underserved community has been reported.
Early diagnosis of middle ear pathology is particularly important as otitis media is responsible for a significant burden of disease in developing countries in which access to medical care is limited. 17 Complications from untreated middle ear pathology include sensorineural hearing loss, ossicular chain disruption or fixation, perforation of the tympanic membrane, retraction pockets, mastoiditis, and even meningitis. 8,17,18 Human immunodeficiency virus–infected children with low T4 lymphocyte counts have a nearly threefold increased risk of recurrent acute otitis media. 19 Video-otoscopy conducted via telehealth to primary health clinics in underserved areas may contribute to the prevention of complications from middle ear pathology and to significant improvement in health and quality of life.
In light of the importance of early diagnosis of middle ear pathology in developing countries and the lack of evidence on diagnostic validity of video-otoscopic images taken from a heterogeneous population by individuals without formal hearing healthcare training, the current study was initiated. The study investigated whether video-otoscopic images taken by an on-site telehealth clinic facilitator are sufficient for accurate asynchronous diagnosis by an otolaryngologist within a heterogeneous clinic population.
Subjects and Methods
The project was conducted following approval from the institutional ethics committee. A within-subject comparative research design was used with a sample of 61 consenting adults (age range, 18–61 years; average age, 40 years; 49 women) recruited from registered patients of the primary healthcare clinic, where a hearing telehealth clinic was established in 2010. The primary healthcare clinic serves as a specialist center for human immunodeficiency virus and tuberculosis treatment.
The telehealth hearing clinic facilitator had no formal healthcare or other tertiary training. On-site training of the facilitator was provided on how to perform conventional otoscopy and take video-otoscopic images over a 2-day period. Training included participant positioning, visual inspection of external ear, appropriate hand position, manipulation of direction of speculum, focus adjustment, image capture, video-otoscope software use, and equipment sterilization. Data collection, which included acquisition of case history, face-to-face otoscopic examination, and acquisition of video-otoscopic images by the otolaryngologist and the facilitator, was completed over 4 consecutive days.
A Welch Allyn (Skaneateles Falls, NY) digital MacroView video-otoscope (model WA-23920-Set), with a 3-, 4-, or 5-mm speculum, was used to acquire the video-otoscope images. The video-otoscope was attached to a Netbook computer (Acer® [New Taipei City, Taiwan] Aspire One PC) running Windows XP Service Pack 2 via a USB video cable. The Welch Allyn Viewer (version 1.1.2.0) software was used to visualize the video-otoscopic images. The images were saved as 24 bit color (16.7 million colors) PNG images with a resolution of 1280×1024 pixels. The conventional otoscopy was performed with a Heine (Herrsching, Germany) mini3000® fiber optic otoscope with 3-, 4-, and 5-mm disposable specula.
Participants were interviewed to obtain biographical information and history of earache, ear discharge, hearing loss, tinnitus, balance information, and any other relevant information offered. A single video-otoscopic image was then recorded by the telehealth clinic facilitator from each ear. Subsequently an experienced otolaryngologist, who was not present during acquisition of images by the clinic facilitator, performed conventional, face-to-face otoscopic examination, to document tympanic membrane surface structure, thickness, color, and position and to make a diagnosis. This was followed by recording of video-otoscopic images from each ear of the same participant. This on-site otoscopic examination by the otolaryngologist was considered the gold standard diagnosis.
The video-otoscopic images were assigned random numbers by the first author. The images were then uploaded to a secure server. Six weeks later, the otolaryngologist, who was blinded to the randomized images, accessed the secure server and assessed the video-otoscopic images by completing an evaluation form on the server for each image. The otolaryngologist assessed the images without the benefit of relevant participant history or demographic information. The delay in assessment was included to counter the possible effect of memory of images and previous diagnosis made in order to eliminate clinician bias. The overall image quality was graded (from 0 to 2) with reference to image focus, light, obscuring objects, and composition. 11 A grading of 0 indicated that the image quality was not acceptable, and it was not possible to assess the tympanic membrane. An image graded 1 indicated an acceptable image quality, enabling evaluation of the status of the tympanic membrane. An excellent video-otoscopic image was graded 2, indicating high image quality, with tympanic membrane easily assessable. Otoscopic findings related to tympanic membrane surface structure, thickness, color, and position, as well as the concluding diagnosis, were documented. The aforementioned data collection order was maintained during data collection for all participants. One participant did not consent to acquisition of video-otoscopic imaging of one ear by either the facilitator or the otolaryngologist because of reported discomfort. Two other video-otoscopic images were lost because of software error. The remaining 240 video-otoscopic images (120 video-otoscopy images taken by a facilitator and 120 taken by the otolaryngologist) were randomly numbered from 1 to 240.
Descriptive statistics were used to describe the mean image quality rating for images taken by the otolaryngologist and by the telehealth clinic facilitator and the frequency with which the tympanic membrane surface structure, thickness, color, and position could be evaluated. 20 By classifying the diagnosis as normal or abnormal, the sensitivity and specificity of video-otoscopic images acquired by the facilitator and by the otolaryngologist were calculated with reference to face-to-face otoscopic examination by the otolaryngologist as the “gold standard.”
The chi-square statistic of independence could not be used to compare conventional otoscopy with the video-otoscopic images as, under the assumption that the null hypothesis is true, the cells displayed an expected frequency count of less than 5. The odds ratio, as a statistic of independence for nonparametric data, was used to compare conventional otoscopy with the video-otoscopic images. As a measure of test performance, the odds ratio combines sensitivity and specificity with accuracy as a single indicator. 21
The kappa statistic (κ) was used to quantify diagnostic concordance between video-otoscopic images acquired by the facilitator and by the otolaryngologist. The diagnostic concordance was based upon the range in which κ matches: “poor agreement” (κ<0.00), “slight agreement” (κ=0.01–0.20), “fair agreement” (κ=0.21–0.40), “moderate agreement” (κ=0.41–0.60), “substantial agreement” (κ=0.61–0.80), or “almost-perfect agreement” (κ=0.81–1.00). 22 Diagnostic concordance between face-to-face otoscopy and otoscopic assessment of video-otoscopic images, acquired by the otolaryngologist and facilitator, was determined.
Results
The case history of the sample population included 29.5% with previous history of earache, 4.9% with discharge, 42.6% with hearing loss, 42.6% with tinnitus, and 18% with balance problems, and 14.8% had other related complaints.
Examples of the video-otoscopic images are presented in Figures 1 and 2. According to the distribution of the asynchronous video-otoscopic image grading (Table 1), a larger percentage of the images acquired by the otolaryngologist (83.6%) were graded as acceptable and excellent, compared with the images (75.4%) recorded by the facilitator.
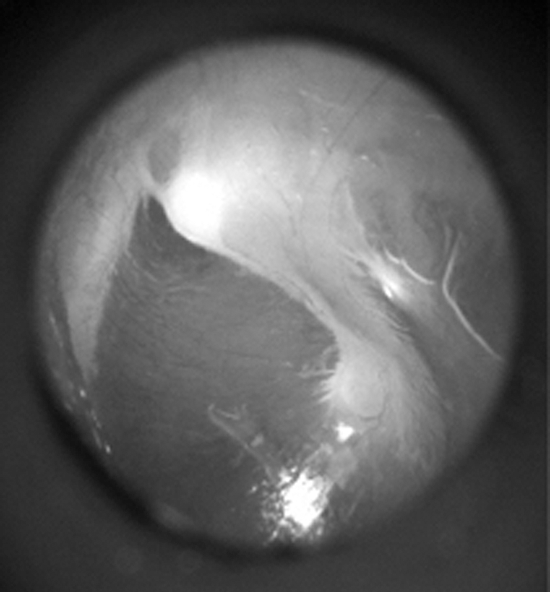
Video-otoscopic image of a normal tympanic membrane.
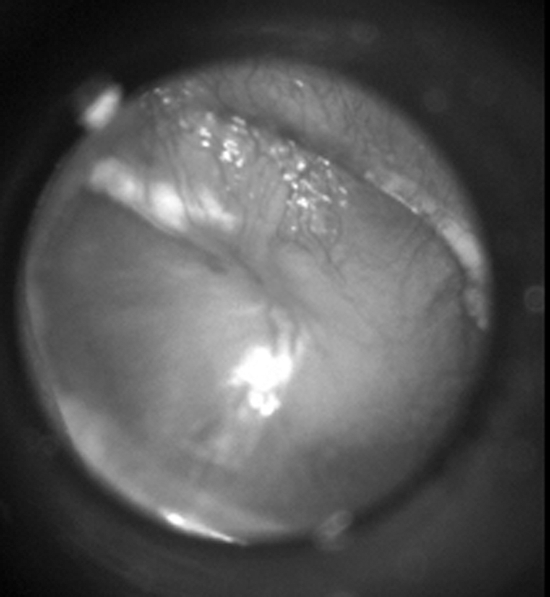
Video-otoscopic image of a tympanic membrane with inflammation over the pars flaccida and over the handle of the malleus, indicating acute otitis media.
Video-Otoscopic Image Grading for Images Acquired by an Otolaryngologist and a Clinic Facilitator (n=120 Ears)
Table 2 indicates that the majority of ears assessed using otoscopy and video-otoscopy were judged to be normal. A diagnosis could not be made from 10.0% of images recorded by the facilitator compared with 4.2% of images recorded by the otolaryngologist.
Otologic Diagnoses Made Using Face-to-Face Otoscopy and Asynchronous Otoscopy Using Video-Otoscopic Images Acquired by an Otolaryngologist and a Clinic Facilitator (n=120 Ears)
NA, not applicable.
Table 3 indicates that the characteristics of the tympanic membrane could, on average, be assessed asynchronously in 80.7% of images acquired by the otolaryngologist and in 71.3% of images acquired by the facilitator. The κ value indicates a substantial agreement on the asynchronous judgment of surface structure of the tympanic membrane between the images acquired by the otolaryngologist and facilitator (κ=0.693) and moderate agreement on judgments of tympanic membrane texture, color, and position (κ=0.574, 0.512, and 0.484, respectively). A moderate agreement (κ=0.596) between diagnoses made from images acquired by the otolaryngologist and the facilitator was found.
Comparison of Asynchronous Assessment of Video-Otoscopic Images Acquired by an Otolaryngologist and a Clinic Facilitator (n=120 Ears)
Concordance between asynchronous assessment of images acquired by the otolaryngologist and facilitator.
SE, standard error; TM, tympanic membrane.
Comparable sensitivity and specificity scores for asynchronous video-otoscopy using images acquired by the otolaryngologist and facilitator were evident compared with conventional face-to-face otoscopy (Table 4). The odds ratio indicate marginally better diagnoses from video-otoscopic images taken by the facilitator compared with images taken by the otolaryngologist with face-to-face otoscopy as the gold standard.
Sensitivity, Specificity, and Diagnostic Odds Ratios for Asynchronous Video-Otoscopy Using Images Acquired by an Otolaryngologist and a Clinic Facilitator (n=120 Ears)
CI, confidence interval.
There was a high concordance between the diagnosis made from face-to-face otoscopy and diagnosis made from asynchronous video-otoscopy using images acquired by the otolaryngologist and the facilitator (Table 5). For ears identified as normal by face-to-face otoscopy, a greater diagnostic concordance was measured between otoscopy and video-otoscopic images taken by an otolaryngologist (87.2% concordance) than between otoscopy and video-otoscopic images acquired by a facilitator (76.6% concordance). The reverse was true for ears judged by face-to-face otoscopy to be abnormal. A higher diagnostic concordance for video-otoscopic images acquired by the facilitator (82.1%) than for video-otoscopic images acquired by the otolaryngologist (concordance=75.0%) was calculated.
Concordance (Percentage) of Face-to-Face Otoscopy and Asynchronous Video-Otoscopy Using Images Acquired by an Otolaryngologist and a Clinic Facilitator (n=120 Ears)
Discussion
In the present study, 83.6% of asynchronous video-otoscopic images acquired by the otolaryngologist and 75.4% of video-otoscopic images acquired by the facilitator were rated as acceptable or excellent. This is comparable to previous studies that reported 75–82% of video-otoscopic images were judged to be acceptable or better in quality. 8,11,13,16 Comparable quality ratings between previous studies and the video-otoscopic images taken by the facilitator in the current study are particularly noteworthy because the aforementioned studies reported on video-otoscopic images taken by an otolaryngologist, a nurse, or a community health practitioner, all of whom had formal tertiary education in healthcare, compared with the clinic facilitator, with no formal health education. However, a greater number of video-otoscopic images taken by the facilitator were judged to be unacceptable in quality (23.4%) compared with the images taken by the otolaryngologist (15.0%). A diagnosis could not be made from 10.0% of video-otoscopic images acquired by the facilitator compared with 4.2% taken by the otolaryngologist. Experience and additional training may reduce the amount of poor-quality images and the amount of images that could not be used to make a diagnosis, as was observed by Lundberg et al., 11 who reported an improvement in image quality over time as a function of experience. Other studies suggested taking multiple video-otoscopic images of each ear, rather than relying on a single image. 15 This approach is likely to decrease the amount of referrals for repeat assessment or for specialist evaluation due to poor video-otoscopic image quality. Other strategies may include taking brief video clips of the ear canal and tympanic membrane for asynchronous interpretation.
Despite the lower quality grading of the video-otoscopic images acquired by the facilitator compared with the otolaryngologist, agreement of characteristics of the tympanic membrane between images acquired by the otolaryngologist and by the facilitator of the same ear ranged from moderate to substantial (κ=0.484–0.693). This agreement is, in fact, similar to previously reported overall interpersonal agreement between two otolaryngologists for the same asynchronous video-otoscopic images (κ=0.49–0.66). 11 The lowest concordance was measured with respect to the position of the tympanic membrane as judged from images taken by the otolaryngologist and by the facilitator of the same ear (κ=0.484). For both the images acquired by the otolaryngologist and by the facilitator, the characteristic of the tympanic membrane that could be assessed with the lowest frequency was the position of the tympanic membrane. This suggests that noticing mild retraction of the tympanic membrane may be more difficult from a still image compared with a face-to-face otoscopic examination, which may be related to apparent lack of depth perception afforded by two-dimensional video-otoscopic images. A negative middle ear pressure is characterized by retraction of the tympanic membrane, prominence of the lateral process of the malleus, a more horizontal orientation of the manubrium of the malleus, and increased mobility of the tympanic membrane when the insufflation creates negative pressure in the external ear canal. 23,24 Although prominence of the lateral process of the malleus and orientation of the malleus can be observed using video-otoscopic images, the assessment of mobility of the tympanic membrane requires either pneumatic otoscopy or tympanometry to elicit the required response. A retracted tympanic membrane is typically apparent through use of interactive binocular microscope examination 12 or pneumatic otoscopy. Typically, in field face-to-face otologic assessment, medical, demographic, and social history, in conjunction with techniques such as tympanometry and pure tone audiometry, would be used in addition to video-otoscopy or conventional otoscopy. The use of an otoscope alone, even by experienced physicians, may demonstrate unsatisfactory sensitivity and specificity for identifying a retracted tympanic membrane. 25 Therefore the use of two-dimensional video-otoscopic images alone, without additional measurements or demographic, social, or medical history, may exhibit poor diagnostic concordance compared with face-to-face otoscopy.
The lack of depth perception afforded by video-otoscopic images was mentioned by previous studies. 12,16 The use of video-pneumatic otoscopy may address the difficulty in identifying a retracted tympanic membrane while being appropriate for use within a hearing telehealth clinic. 26,27 Using video-pneumatic otoscopy and quantitative analysis of the degree of movement of the umbo of the malleus, Cho et al. 27 reported correlation between tympanograms and, among other middle ear pathologies, negative middle ear pressure. Although otitis media with effusion may occur spontaneously because of negative middle ear pressure, 28 the identification of a retracted tympanic membrane may not be highly significant within a primary healthcare environment in a rural or underserved area.
In the present study the κ value indicated moderate concordance between asynchronous diagnosis made from video-otoscopic images acquired by the otolaryngologist and by the facilitator (κ=0.596). Higher diagnostic concordance between face-to-face otoscopy and video-otoscopic images acquired by either an otolaryngologist or a community healthcare practitioner and between two otolaryngologists evaluating video-otoscopic images was reported in previous studies (κ=0.64–0.76). 12,16 The difference in diagnostic concordance may be attributable to the fact that an otolaryngologist acquired the video-otoscopy images in the study by Patricoski et al. 12 (κ=0.67–0.76). Additionally, both Kokesh et al. 16 and Patricoski et al. 12 reported on a closed set of diagnostic possibilities as all participants were evaluated after tympanostomy tube placement. In the current study, participants were randomly selected from the patients who attended the primary healthcare clinic. The population sampled in the present study can be expected to increase diagnostic possibilities and, consequently, decrease diagnostic concordance. In addition to the heterogeneous population, the otolaryngologist in the present study was requested to make an asynchronous diagnosis using video-otoscopic images without the benefit of demographic, social, or medical information. Previous studies provided the diagnosing otolaryngologist with relevant medical history in support of the video-otoscopic images. 12,16 Against this background, the moderate diagnostic concordance demonstrated in the current study between asynchronous diagnosis using only video-otoscopic images taken by an otolaryngologist and a facilitator is encouraging.
Percentage diagnostic concordance has been reported in previous studies using microscopy and video-otoscopy. In post-tympanostomy tube placement examinations diagnostic concordance was reported to be 76–85%. 12,16 This is comparable to the 87.2% concordance for the otologic diagnosis of normal ears using video-otoscopic images (87.2% and 76.6% of images acquired by the otolaryngologist and facilitator, respectively) and for the diagnosis of abnormal ears (otolaryngologist images, 75.0%; facilitator images, 82.1%).
The sensitivity (video-otoscopic images acquired by otolaryngologist=0.80; images acquired by the facilitator=0.91), specificity (video-otoscopic images acquired by otolaryngologist=0.85; images acquired by the facilitator=0.89), and indicators of accuracy (diagnostic odds ratio=41.0 using otolaryngologist images and 46.0 using facilitator images) measured in the current study are acceptably high. In fact, sensitivity and specificity values in the current study were comparable to those reported on binocular microscopy performed by a pediatric otolaryngologist (sensitivity, 88.0%; specificity, 89%), which was higher than the sensitivity and specificity of values of both pneumatic otoscopy and tympanometry. 29 The sensitivity, specificity, and accuracy values for asynchronous video-otoscopic images acquired by the hearing telehealth clinic facilitator compared with conventional face-to-face otoscopy in the present study were achieved from a heterogeneous population without the benefit of demographic, social, or medical history. The population in question is, however, adult, and findings may not necessarily be generalizable to a pediatric population. Further research is required to ascertain whether sensitivity, specificity, and accuracy values would be as promising in a less compliant patient population.
Conclusions
Video-otoscopic images acquired by an otolaryngologist and by a trained hearing telehealth clinic facilitator are equally effective for asynchronous diagnosis by an otolaryngologist compared with conventional face-to-face otoscopy. More poor-quality video-otoscopic images were acquired by the facilitator (24.6%) than by the otolaryngologist (16.4%). This may, however, improve with additional training and experience. Performance of asynchronous video-otoscopy compared with face-to-face otoscopy was similar to previous reports. The apparent lack of depth perception was highlighted as a possible disadvantage of a single video-otoscopic image but is unlikely to have a significant impact on clinical diagnosis of pathologies. Multiple images or brief video clips of patients' ears may improve diagnostic concordance. Using a hearing health telemedicine facilitator trained in video-otoscopy can provide a platform for asynchronous diagnosis of otological status using video-otoscopy in underserved primary healthcare settings. Video-otoscopy may have a significant role to play in the early detection of middle ear disease and in the prevention or timely management of life-threatening pathology in developing countries.
Footnotes
Acknowledgments
The authors would like to thank Ms. Violet Mugodo, Dr. Jean Bassett, and the rest of the Witkoppen Health and Welfare Clinic management, staff, and patients for their help and support during data collection for this research project.
Disclosure Statement
No competing financial interests exist.