
Abstract
A light and portable wireless biosignal retrieving system has always been a medical dream. This proposed wireless-type biosignal alerting system aims at designing and developing a module that detects the abnormal interpretations in the PQRST complex (electrocardiography) and heart rate of a patient in advance, gives a self-warning ring to the patient, and also sends a short message service warning to the doctor's mobile phone through the Global System for Mobile Communication. This system is a solution to supplement the limitations in conventional clinic examination such as the difficulty in capturing rare events, out-of-hospital monitoring of patients' heart status, and the immediate dissemination of the physician's instruction to the patient. These study results have immense consequence in researching, finding, and preventing epidemics in the cardiovascular system for the entire world.
Introduction
Cardiovascular disease is the world's leading killer, accounting for an annual 16.7 million or 29.2% of total global deaths. 1 Many of the cardiac-related problems are attributed to modern lifestyles, food habits, obesity, smoking, tobacco chewing, lack of physical exercise, etc., and also a stressful city life when compared with the relative calm of the countryside. 2 Patients with arrhythmia usually need to be monitored and controlled in a hospital setting for 1 to several days. Sometimes it is necessary to monitor some heart patients for longer periods of time to provide more certain documentation for an adequate treatment, but patients often are released from the hospital to give treatment priority to other heart patients on the waiting list, who need to be hospitalized immediately. 3
By studying the electrocardiogram (ECG), valuable information about the health status of the patient can be obtained. 4 Postoperative patients can develop complications once they are discharged from the hospital. In some patients cardiac problems may re-occur, when they start doing their routine work. Hence, the ECG of such patients needs to be monitored for some time after their treatment. 5 This helps in the diagnoses of the improper functioning of the heart and permits precautions to be taken. Mobile telemedicine systems are becoming more important all the time, especially in the care of patients who are isolated or traveling, far from a reference hospital. 6 The amplitude, duration, and rhythm of the QRS complex are used to aid cardiologists in identifying abnormal functions of the heart. 7 Our research work aims at developing a model that detects the abnormal interpretations in the ECG and heart rate (HR) of a patient in advance, thereby reducing the critical level of the patient by following precautionary measures at an earlier time.
Existing Systems
After a robust literature survey related to this work, we found that all existing patient monitoring systems are Internet- or Web-based. Generally, by comparing with the old patient monitoring systems, 8 we require a centralized server to gather biosignals from the patient. For a test case the information acquired from the biosignals is shared between the doctor and the patient within a short range 9 because it is based on establishing a communication link through Bluetooth® (Bluetooth SIG, Kirkland, WA). As per the details in the Encyclopedia of Surgery, 10 and through e-mail and applications, doctors are able to detect the abnormalities of postoperative patients. In the study of Rasid and Woodward, 10 continuous monitoring of cardiac patients was not possible. Even though some telehealth systems are mobile-based, such monitoring requires a centralized monitoring server. 11 It should be noted that the system becomes unavailable if the server fails.
A thorough review of existing approaches toward developing wireless biological sensors has been published.
12
These approaches can be divided into two major categories: fully analog and microcontroller-based. Fully analog systems are either (1) fully integrated amplifiers and transceivers or (2) assembled multichip modules. Although the fully integrated devices demonstrated in the literature
13
–15
feature very small size and low power consumption (approximately 2–14 mW), they do not provide digital-signal filtering or bidirectional communications (except for the system described in Widya et al.,
14
which can modulate the inductive power link as a carrier signal for communication from the base station to the sensor).
15
In addition, in order to compare the performance and capabilities of the fully analog systems,
16
it would be useful to define a figure of merit as the analog telemetry-efficiency factor.
17
–19
These kinds of problems can be overcome by this proposed system. A centralized server and continuous monitoring are not required. Our proposed system aims to yield the following: • To sense painless heart attacks, especially for diabetic patients. • To extend the medical services to remote areas (rural). • To reduce and stratify the risk level of patients.
System Design and Methodology
The ECG is a graphical representation of electrical activities of the heart with respect to time. ECG also refers to the painless and noninvasive method that records the ECG signal. A normal ECG with its characteristic patterns and significant points and intervals is shown in Figure 1 and Table 1. The amplitude of a QRS complex is typically about ±1–2 mV.
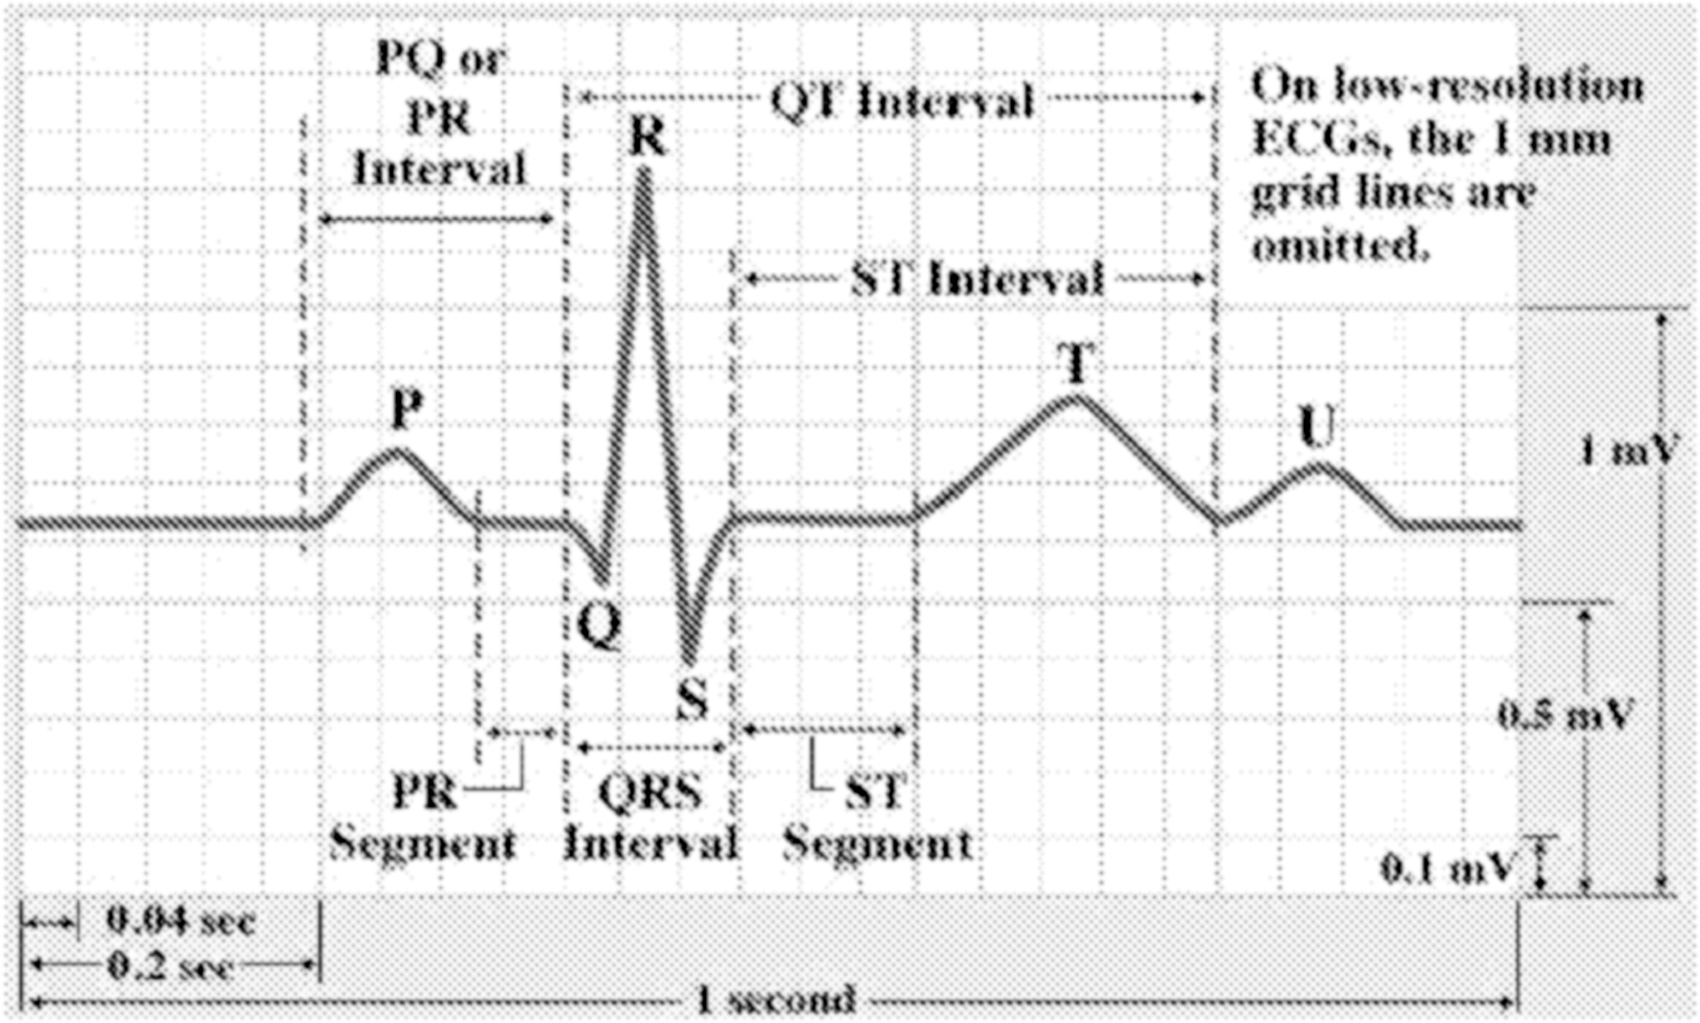
Graphical representation of the electrocardiogram (ECG) signal.
Electrocardiogram Wave Specifications (Amplitude and Time Interval)
ECG, electrocardiogram.
The proposed wireless mobile Tele-Alert system is shown in Figure 2. Our model consists of an ECG detection unit and HR sensing unit that picks up the biosignal (ECG) and then converts it into an electrical signal followed by the filtering unit. Output is then fed into the programmed PIC16F877 microcontroller followed by the Global System for Mobile Communication (GSM) mobile phones. The patient (client) and the healthcare professional can be located anywhere in the globe where there is 2G cellular network coverage. The primary rationale is to monitor the patient's cardiac activity if there is a chance that that patient has cardiac problems, such as an irregular heartbeat or arrhythmia, that require close monitoring. When the patient's cardiac level goes beyond the threshold level, without delay our system will alert the patient by sending a warning ring to the patient as well as a short message service (SMS) alert to the doctor's mobile device. This proposed model is an improved version of the current patient monitoring system where we are providing uninterrupted mobility to both the doctor and the patient.
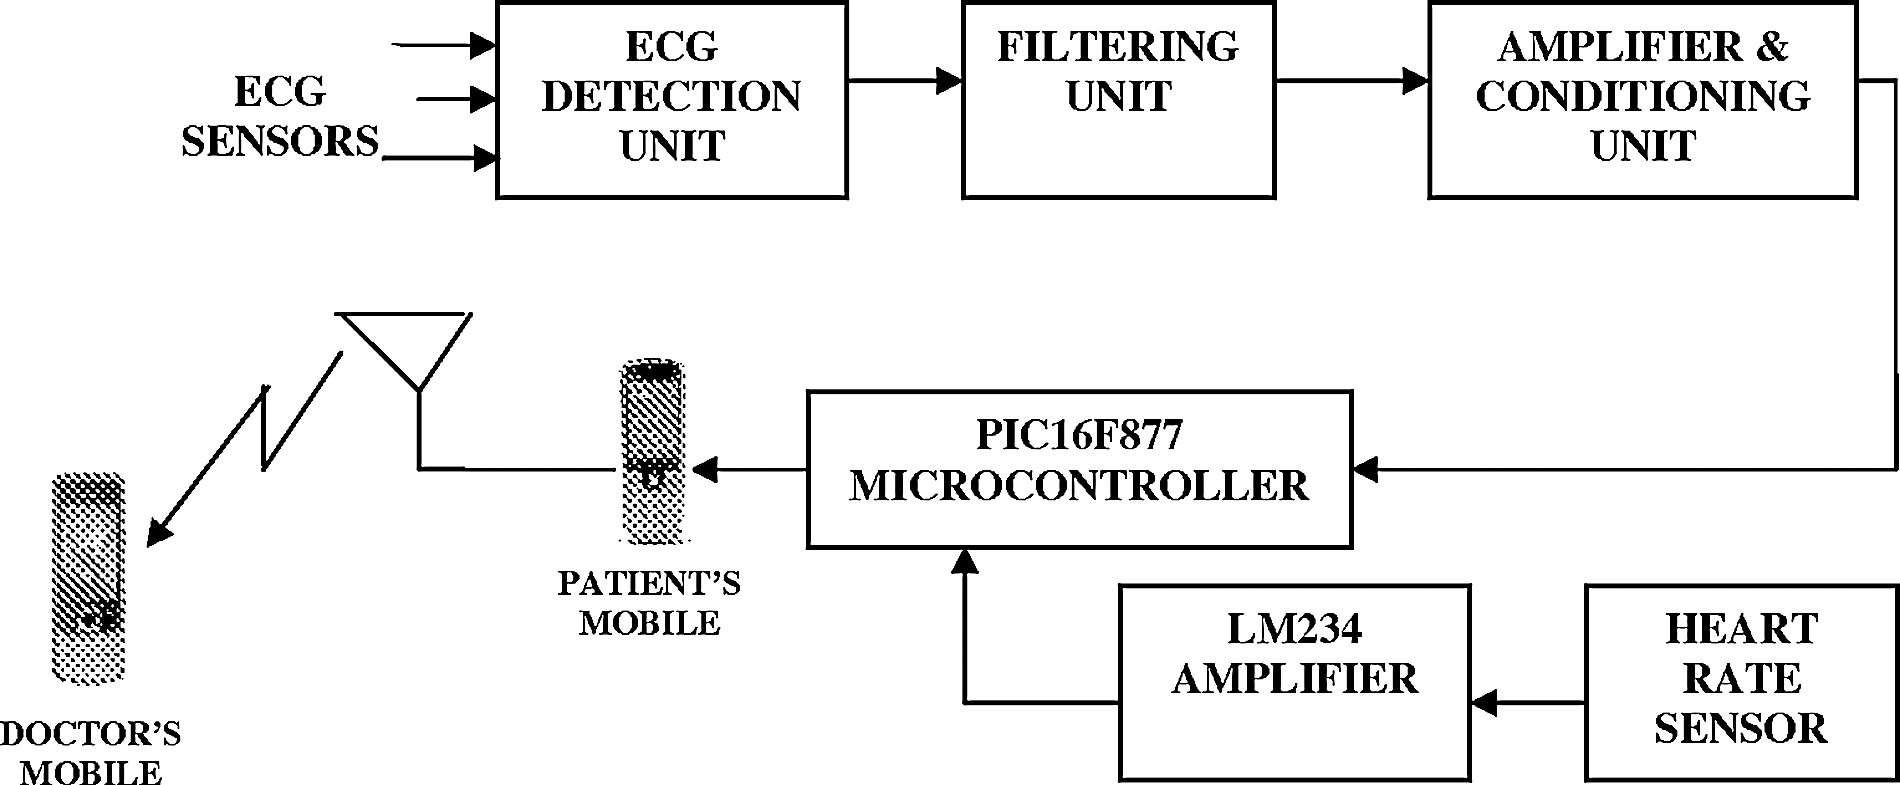
Block diagram of the wireless mobile Tele-Alert system. ECG, electrocardiogram.
Patient Unit
The patient unit comprises the ECG signal acquisition module, which includes the ECG sensors that are used to pick up the bioelectric potentials caused by myocardium, followed by an ECG amplifier. The presence of noise gives rise to the need for signal filtering by a filter section and signal conditioning unit. Table 2 shows various interpretations of the ECG wave in an elaborate manner with its normal time interval range.
Various Interpretations of Electrocardiogram Waves
ECG Leads
The first stage is a transducer AgCl electrode, which converts the biosignal (the ECG) into electrical voltage. The voltage is in the range of 1–5 mV. We direct the signals from the five ECG electrodes (right arm, left arm, right leg, left leg, and chest) into the inputs of the designed instrumentation amplifier with a conditioning circuit having an overall gain of 1,000. The signal is band pass-filtered with a frequency range from 0.15 to 50 Hz. The ECG derived from the surface bears frequency components up to a maximum frequency of 100 Hz, but most of the spectrum is concentrated below 40 Hz.
ECG Amplifier
The front end for the signal acquisition system is an instrumentation amplifier. It has a very high common mode rejection ratio and high input impedance, which is required for capturing ECG signals. For the implementation in this system, the AD624 instrumentation amplifier was chosen. This is a very high-precision, low-noise, instrumentation amplifier designed primarily for use with bioelectronics.
Filter Selection
In the modern ECG monitoring system, multiple filters are deployed for signal processing. In this monitor mode, the low-frequency filter (also called the high-pass filter because signals above the threshold are allowed to pass) is set at either 0.5 Hz or 1 Hz, and the high-frequency filter (also called the low-pass filter because signals below the threshold are allowed to pass) is set at 40 Hz. This limits artifacts for routine cardiac rhythm monitoring. The high-pass filter helps to reduce wandering baseline, and the low-pass filter helps to reduce 50 or 60 Hz power line noise (the power line network frequency differs between 50 and 60 Hz in different countries). In diagnostic mode, the high-pass filter is set at 0.05 Hz, which allows accurate ST segments to be recorded. The low-pass filter is set to 40, 100, or 150 Hz. Consequently, the monitor mode ECG display is more filtered than the diagnostic mode because its pass band is narrower.
Signal Conditioning Unit
The next task is amplification of ECG signals before digitizing, commonly discussed as signal conditioning, which includes analog signal filtering, demodulation, sampling, holding, etc. Amplification of signals before digitizing was done to obtain the highest resolution and to maximize the effective number of bits for the analog to digital conversion. Overall gain is calculated using the following equation:
“age Tuner”
One of the novelties in this proposed work is the “Age Tuner.” It is well known that the HR is not common for all elderly people. In order to reduce the probability of a false alarm, we have to set the threshold value based on the age of the particular user. Such a provision is available in this high-quality medical device.
HR Sensor
Infrared sensors are used, which can easily be clipped to the fingertips or ear lobes to detect the heartbeat. This unit is lightweight, easy to handle, and extremely durable. It measures the light level transmitted through a tissue of the finger lobe and the corresponding variations in light intensities that occur as the blood volume changes in the tissue. A normal and healthy human heart beats about 72 times/min. The output of the sensing circuit is given to the microcontroller. It decides whether the HR is normal or abnormal. When the threshold level is in between 60 and 100 beats/min, it frames a message as “Normal HR (60–100 beats/min),” and when the HR level exceeds this normal level, it frames a message as “Abnormal HR (X 1<60, X 2>100 beats/min).”
Lm234 Amplifier
The front end following the HR sensor is an operational amplifier. The LM234 has three-terminal adjustable current sources characterized by an operating current range of 10,000:1. This facilitates the circuit operating as a rectifier and as a source of current in AC applications. Zero drift can be obtained by adding an additional resistor and a diode to the external circuit. It has a very high gain and requires a low supply current, which is required for increasing the amplitude level.
Pic16F877 Microcontroller
The PIC16F877 microcontroller includes 8 kilobytes of internal flash program memory, together with a large RAM area and an internal EEPROM. An eight-channel 10-bit A/D converter is also included within the microcontroller, making it ideal for real-time systems and monitoring applications. All port connectors are brought out to standard headers for easy connect and disconnect. In the circuit program, download is also provided, which makes the board easily updated with new code and modified as required, without the need to remove the microcontroller.
Algorithms Used for This Proposed Work
Algorithm for Abnormal Detection Using HR
Step 1. Start the program.
Step 2. Initialize the HR sensor.
Step 3. Measure the heartbeat value.
Step 4. Then check if HR<72 or >90 beats/min.
Step 5. If yes, initialize GSM modem to send SMS heartbeat alert.
Step 6. Otherwise, go to Step 3.
Step 7. Stop the program.
The schematic representation is shown in Figure 3.
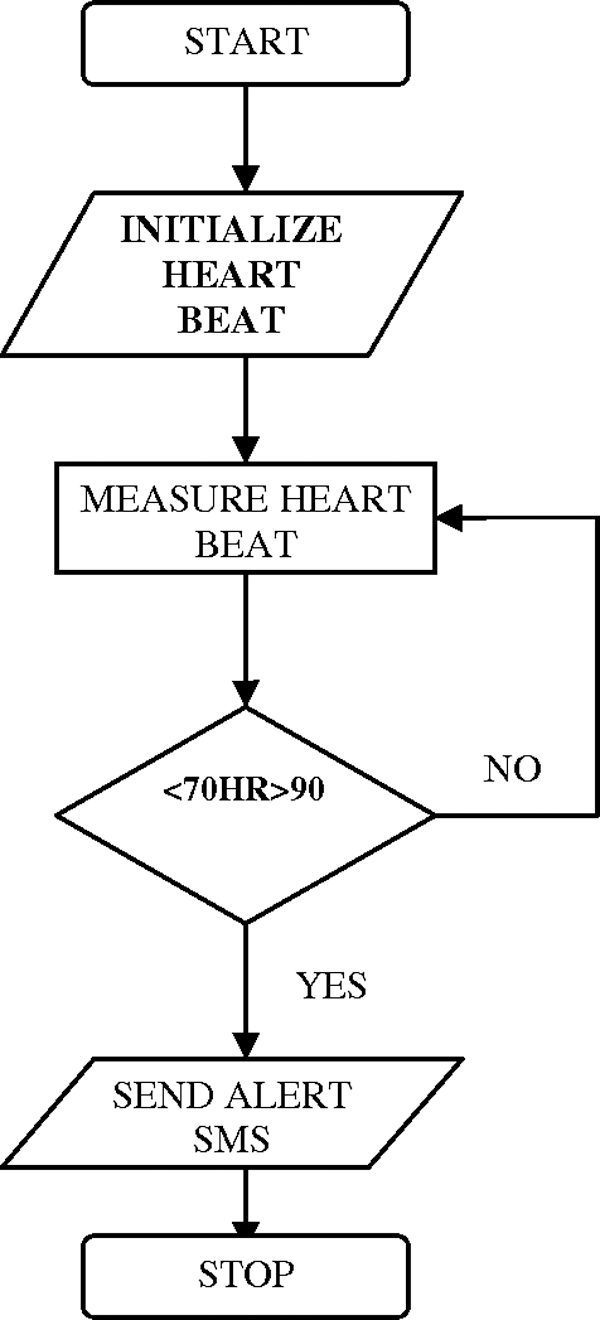
Flowchart of steps for detecting an abnormality using the heart rate (HR). SMS, short message service.
ECG QRS Detection Algorithm
Various detection algorithms are available for the telemetry applications, including (a) the Turning Point Algorithm, (b) the Aztec Algorithm, (c) the Fan Algorithm, and (d) the QRS Detection Algorithm. The QRS Detection Algorithm is preferred because it has the ability to detect a widened QRS and also produce a constant reduction rate, which is needed for the clinical process. It is a real-time algorithm that recognizes QRS complexes based on the analysis of slope, amplitude, and width:
1. SPKI=0.125 PEAKI+0.875 SPKI
2. NPKI=0.125 PEAKI+0.875 NPKI
3. Threshold 11=NPKI+0.25×(SPKI – NPKI)
4. Threshold 12=0.5×(Threshold 11)
where PEAKI is the overall peak, SPKI and NPKI are the running estimate of the signal peak and the noise peak, respectively, and Threshold 11 and 12 are the first and second thresholds applied, respectively.
Results and Discussion
Simulation Results for Analysis of HR
Simulations were performed using LabVIEW version 8.6.1 software. LabVIEW allows designing systems in an intuitive block-based manner in shorter times compared with the commonly used text-based programming languages. HR threshold detection and observed output are shown in Figures 4 and 5. The heartbeat coefficients as shown in Figure 4 can be obtained by any filter design tool such as the LabVIEW toolkit and stored in an array of constants. When the threshold level of heartbeat (in beats/minute) as shown in Figure 4 goes beyond the level specified by the physician, then there is a sharp peak seen in the output panel designed in LabVIEW shown in Figure 5. The threshold detector shown in Figure 5 indicates that HR has increased above the normal rate (HR=96.4363 beats/min).
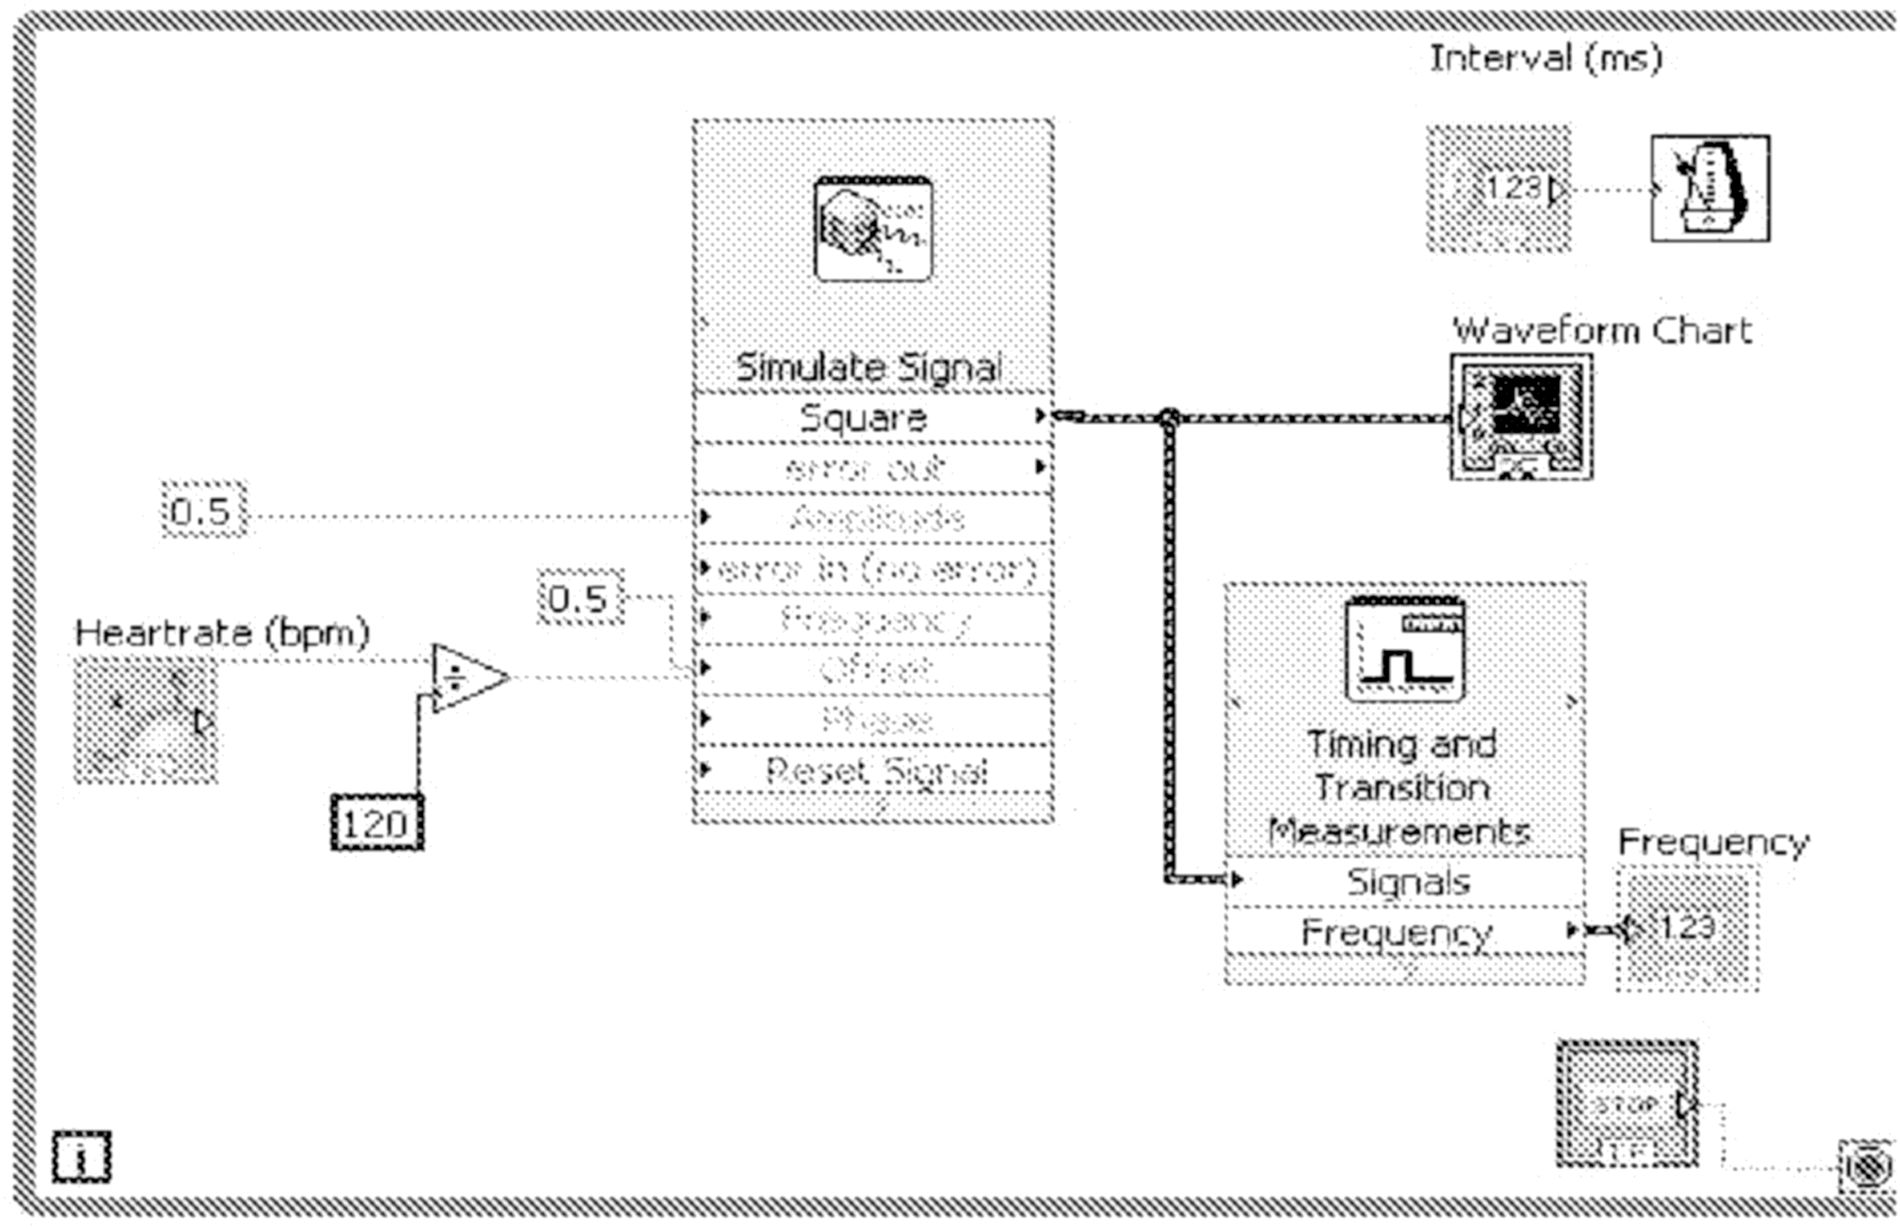
Design of heart rate variability analysis simulation block using LabVIEW software. bpm, beats/minute.
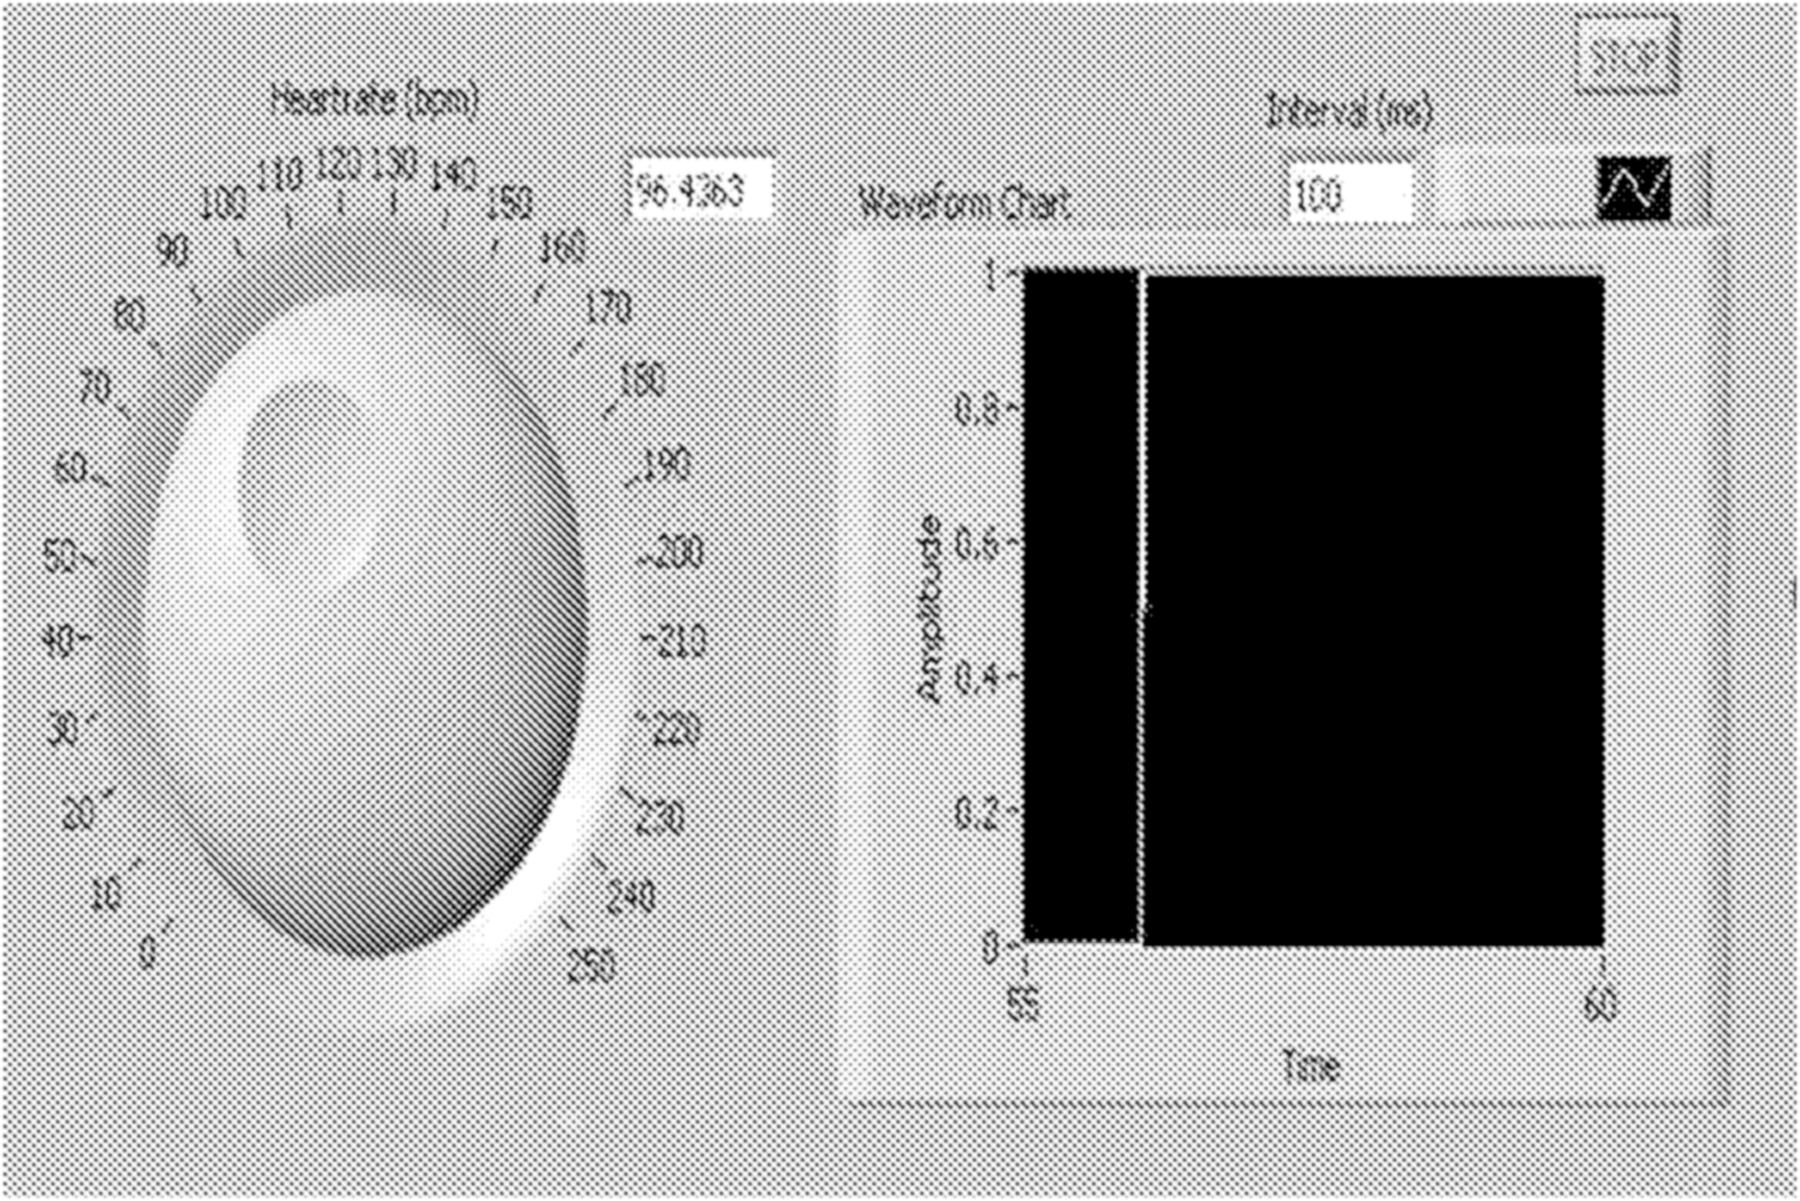
Output panel diagram for an abnormal heart rate. bpm, beats/minute.
The LabVIEW design and observed output for ECG detection is shown in Figures 6 –8. The use of LabVIEW allowed this interactive HR monitoring system to be built in a shorter time compared with other programming languages.

Electrocardiogram QRS detection design by LabVIEW.
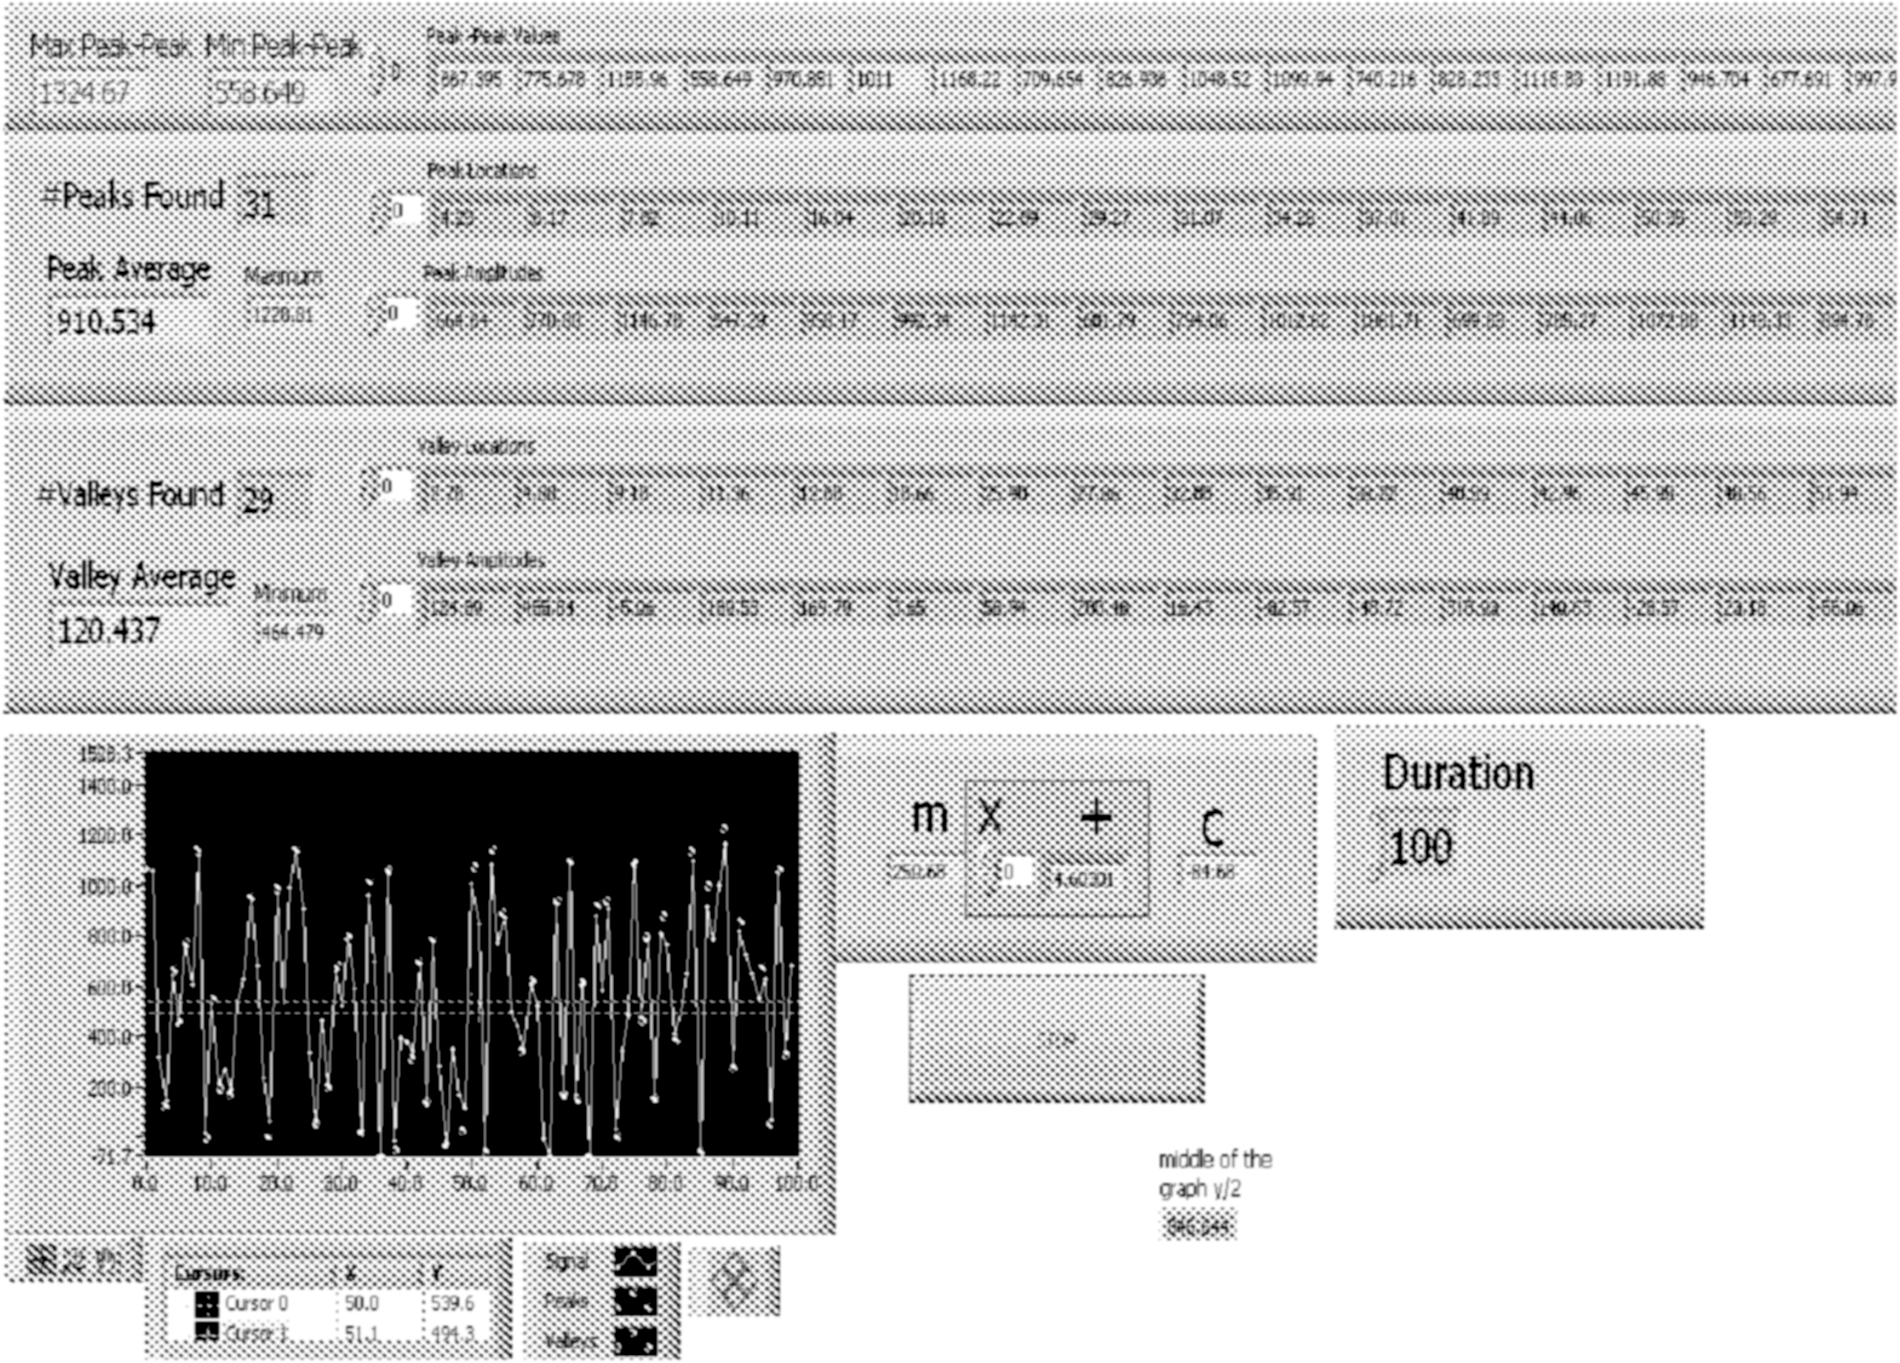
Peak–valley average determination output panel design.
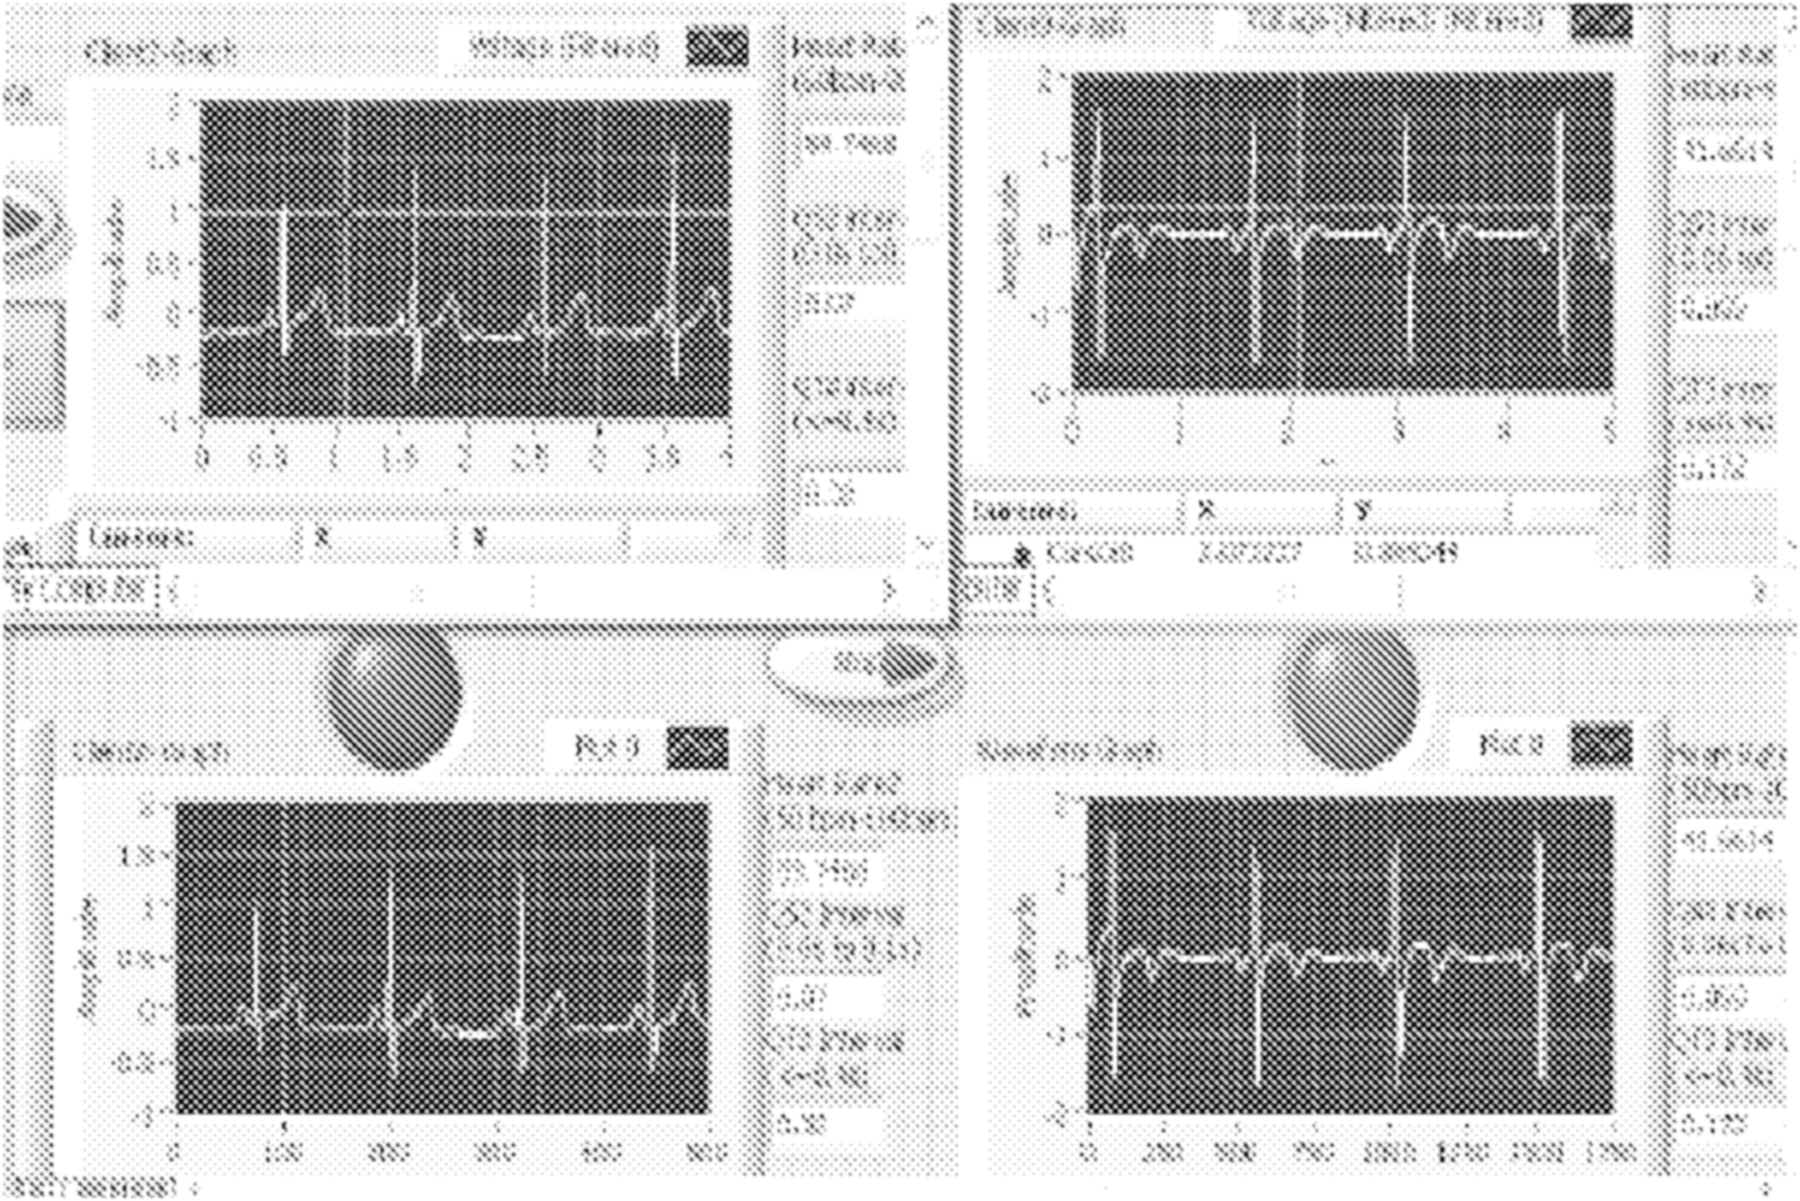
Electrocardiogram abnormal (irregularity) detection design in LabVIEW.
Simulation Results for Analysis of ECG
The next process of simulation begins with the QRS detection and corresponding peak development in LabVIEW. Peak and valley locations are determined, and peak and valley average value calculations are designed in the front panel as shown in Figure 6. The corresponding changes in peak and average values are shown as red and green spots in Figure 7 of the output panel.
As per the ECG specifications mentioned in Table 1 , if the QRS amplitude value deviates from 1.6 mV, then the light-emitting diode will glow “red” and “green” for the other case as shown in Figure 8. The HR can be estimated from the ECG wave as shown in Figure 9. For every successive R-R interval the corresponding HR calculations were performed, and the results are shown in Figure 9.
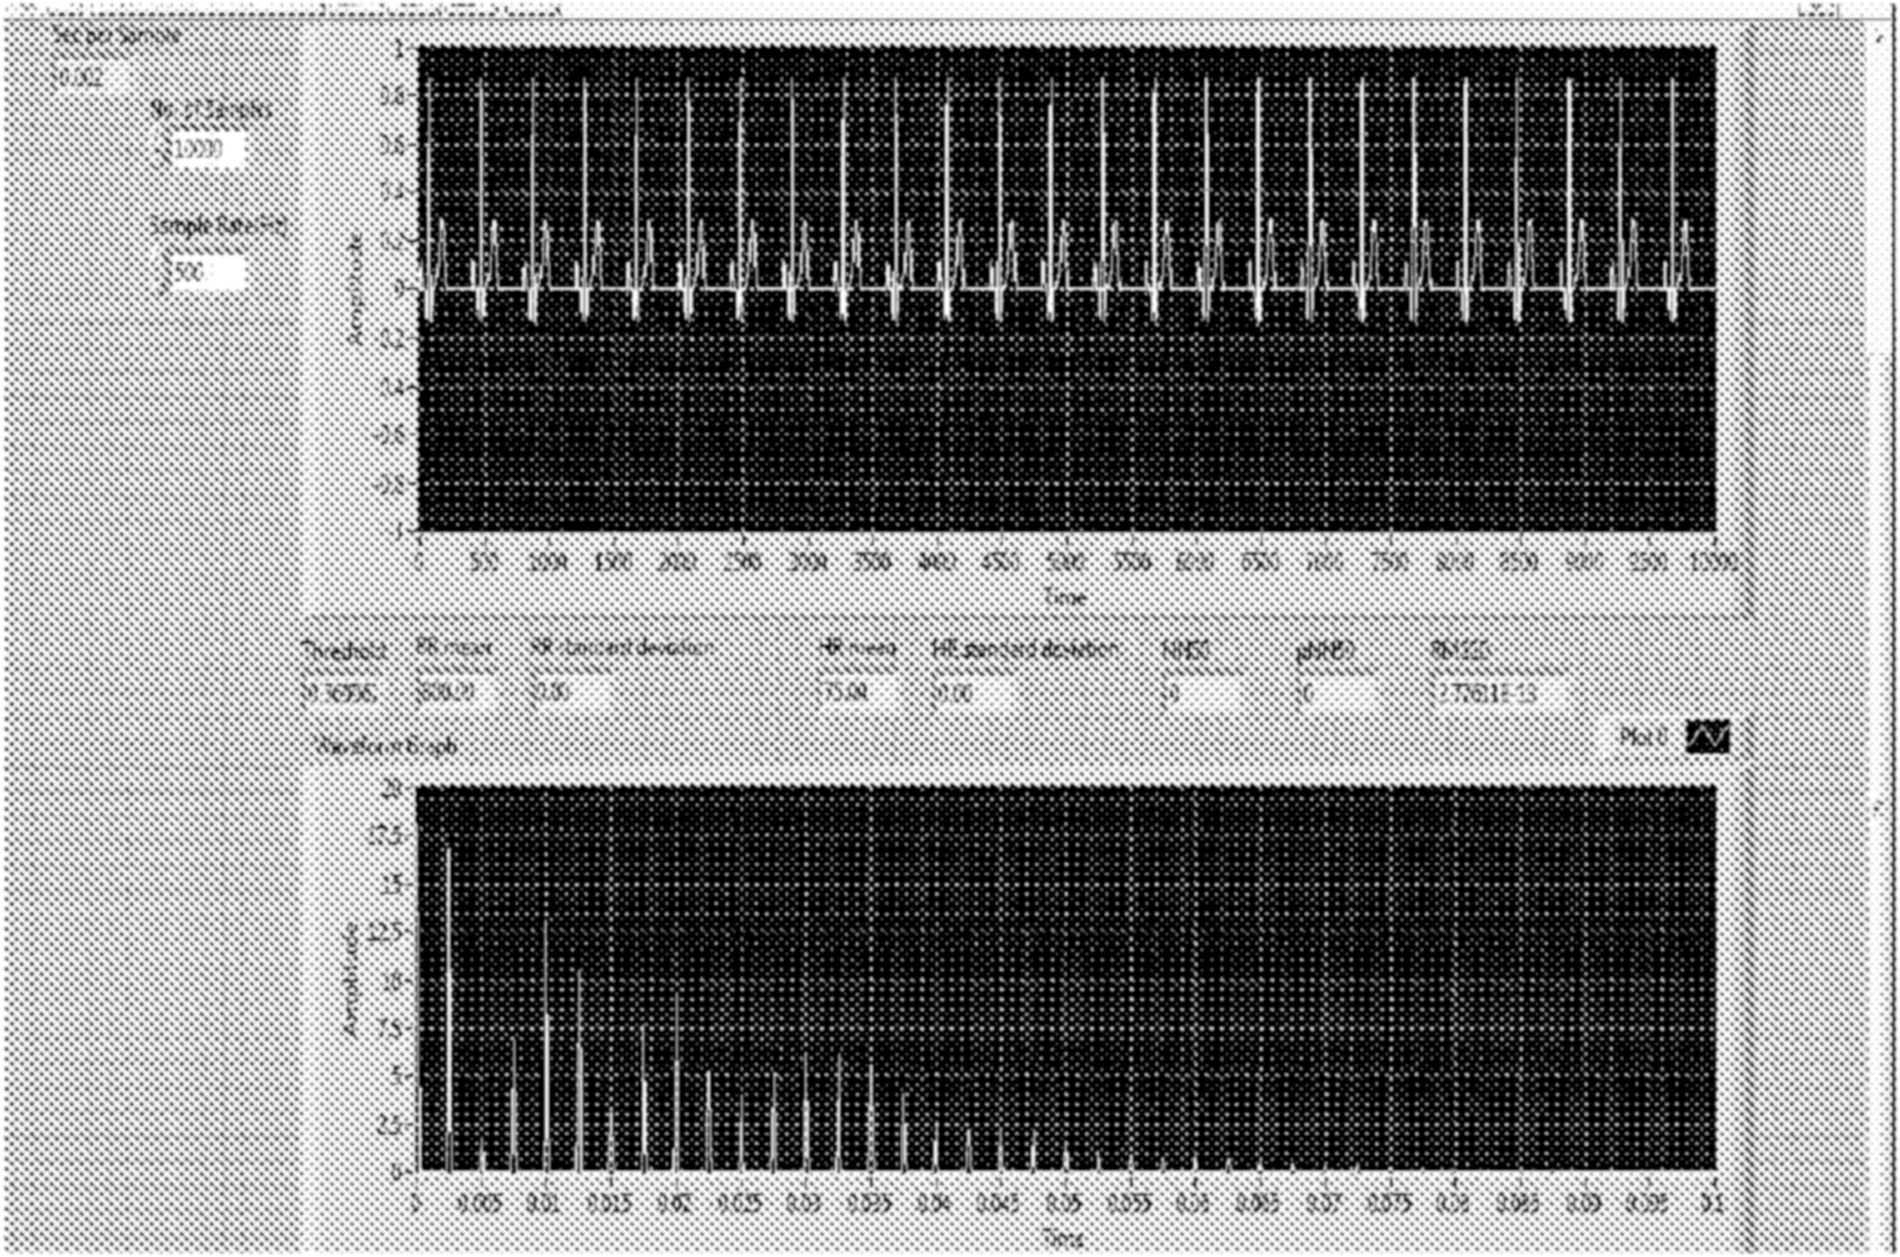
Heart rate (HR) calculation from the QRS complex using LabVIEW design.
Numerical and Statistical Analysis
If the analysis of the ECG signal needs be done for n number of users, then LabVIEW is not an optimal way. For this we use Lab-Chart. The procedure is the same as that with LabVIEW. For n number of users the detection is based not only on the single amplitude value. Also, the mean and standard deviation are calculated for the n users for the analysis, which is shown in Figures 10 and 11.
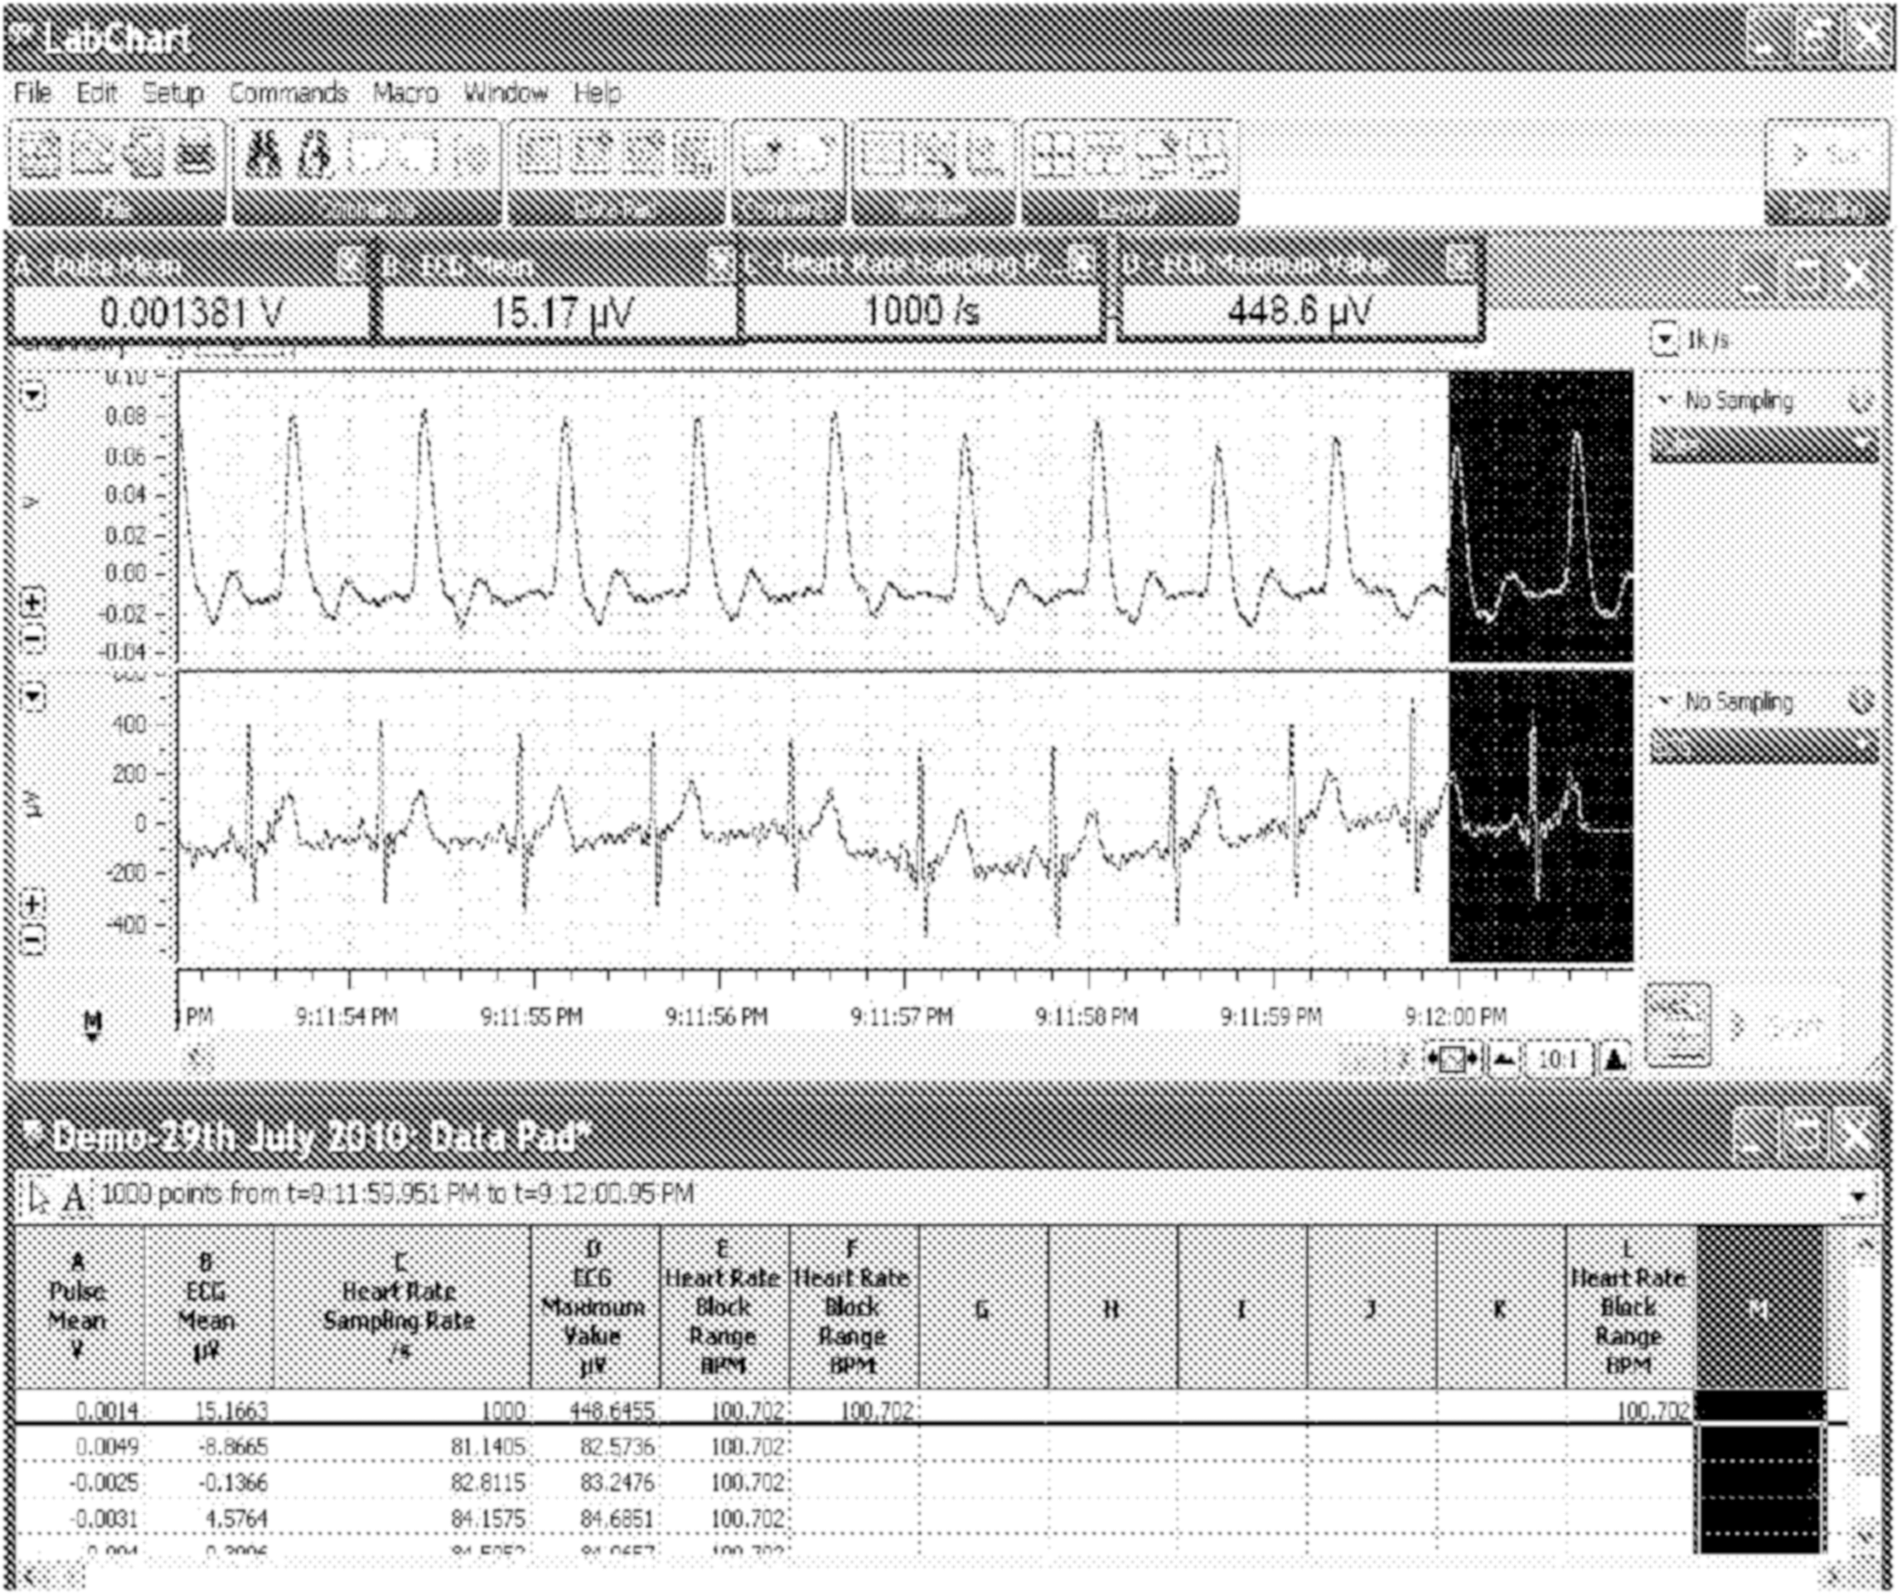
Calculation of pulse/electrocardiogram (ECG) mean value from the QRS complex using LabChart. BPM, beats/minute.
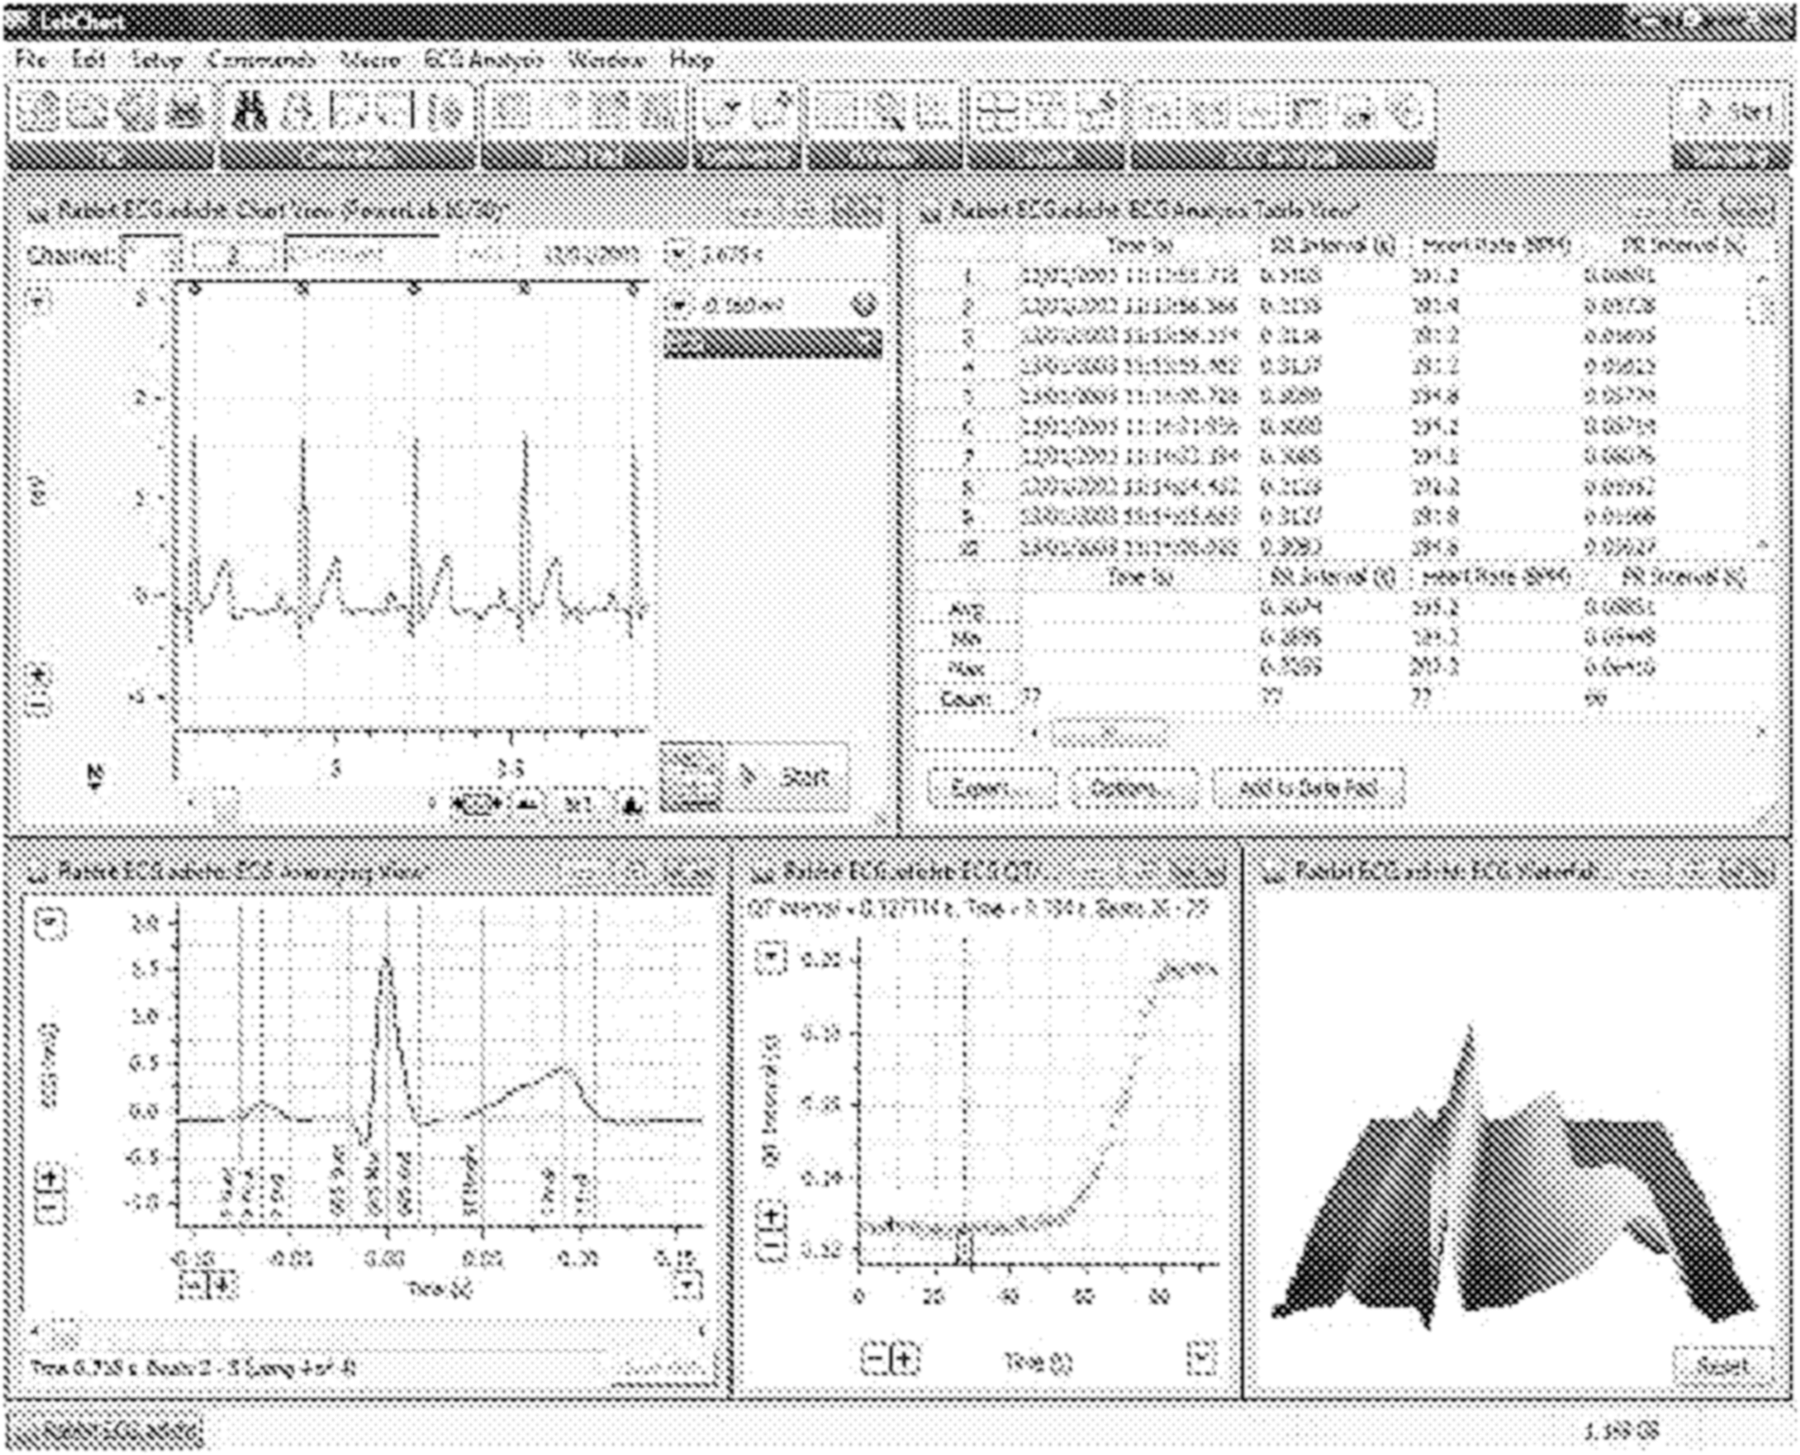
Sample calculation of sampling/heart rate from the R-R interval using LabChart. ECG, electrocardiogram.
ECG samples from various patients were taken, and pulse mean, ECG mean, and HR sampling rate were calculated using LabChart version 6.1. The mean and standard deviation for the given number of patients are tabulated for various variables in Table 3.
Mean and Standard Deviation Values for the Given Number of Patients for Various Variables
Data are mean±standard deviation values.
ECG, electrocardiogram.
Figures 12 and 13 show the plot for ECG findings between percentage and number of patients who were affected by various abnormal ECG interpretations. Clinical records collected during the period December 2011–July 2012 were analyzed.

Plot of electrocardiogram findings by number and percentage of patients. LVH, left ventricular hypertrophy.
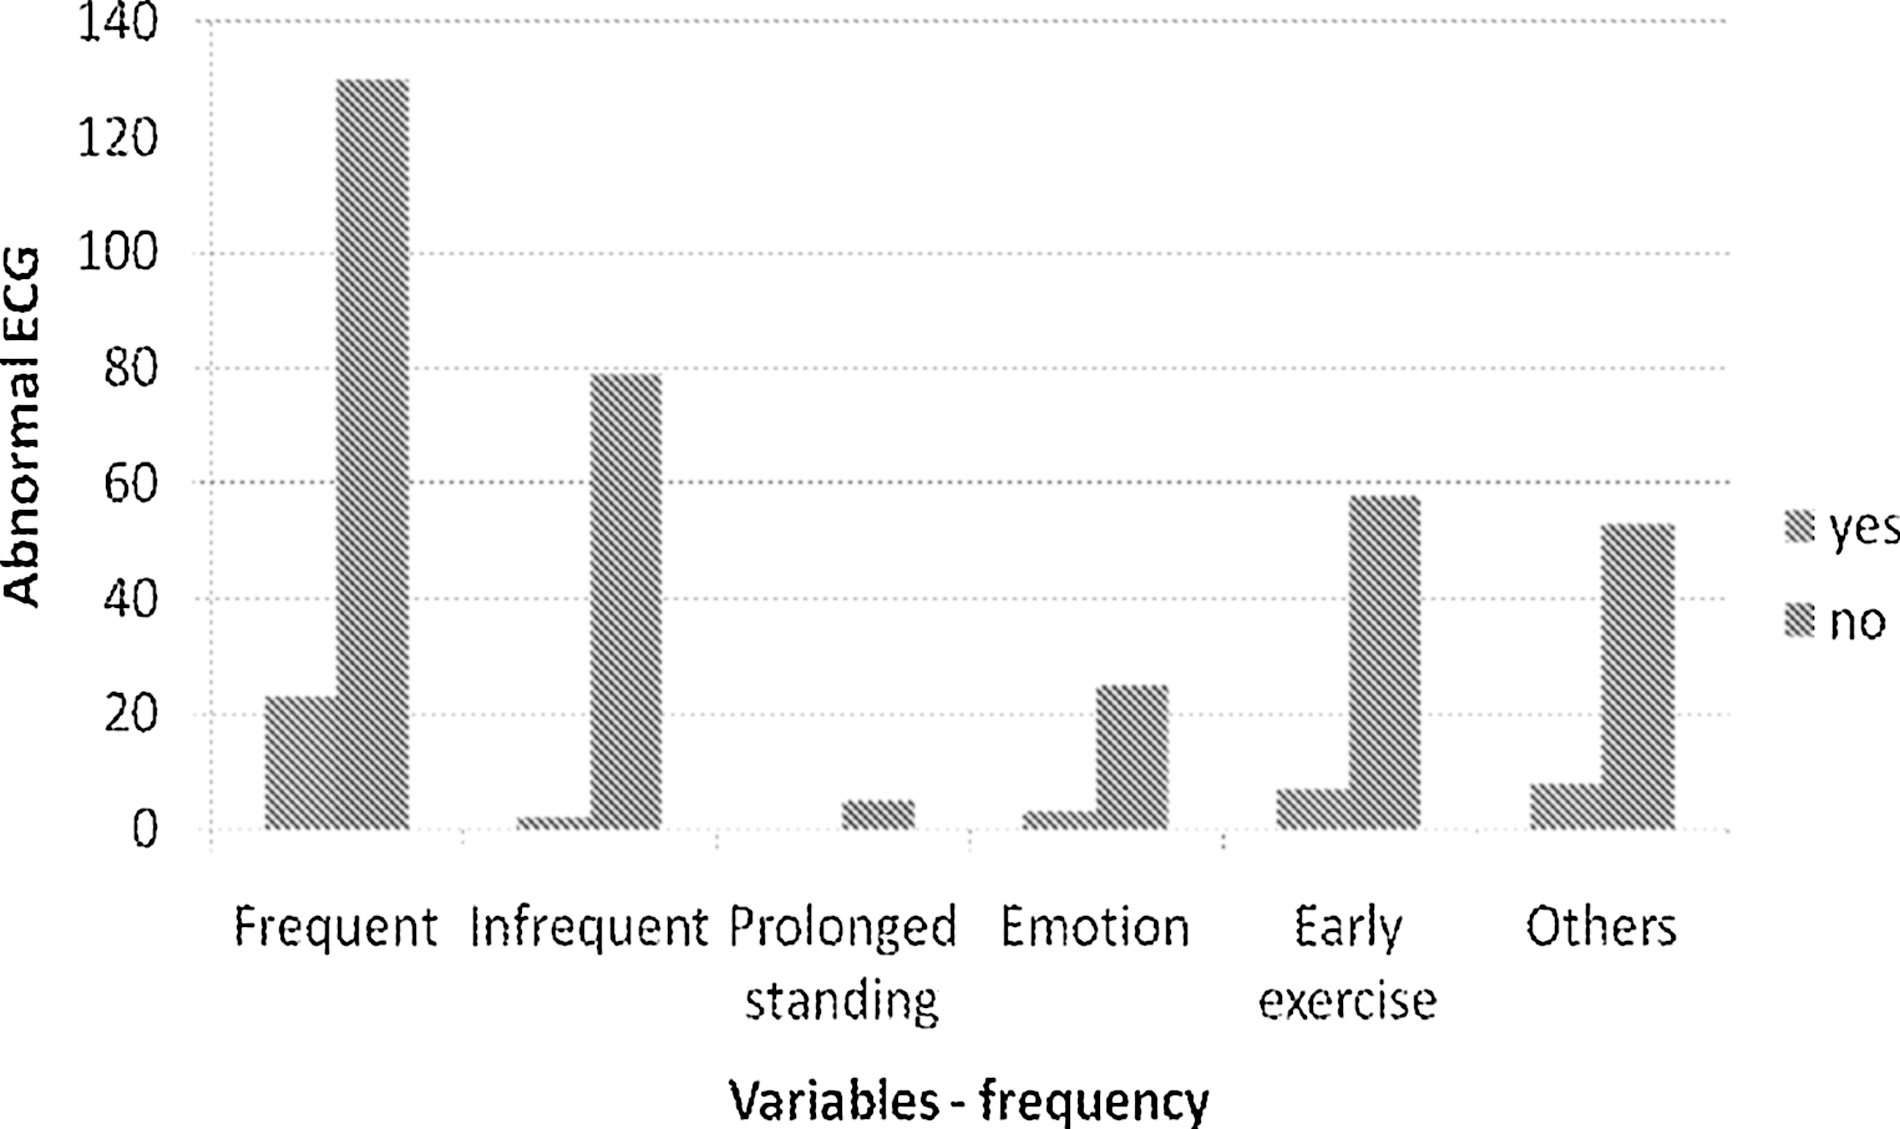
Abnormal electrocardiograms (ECGs) because of various factors.
Real-Time Test Results
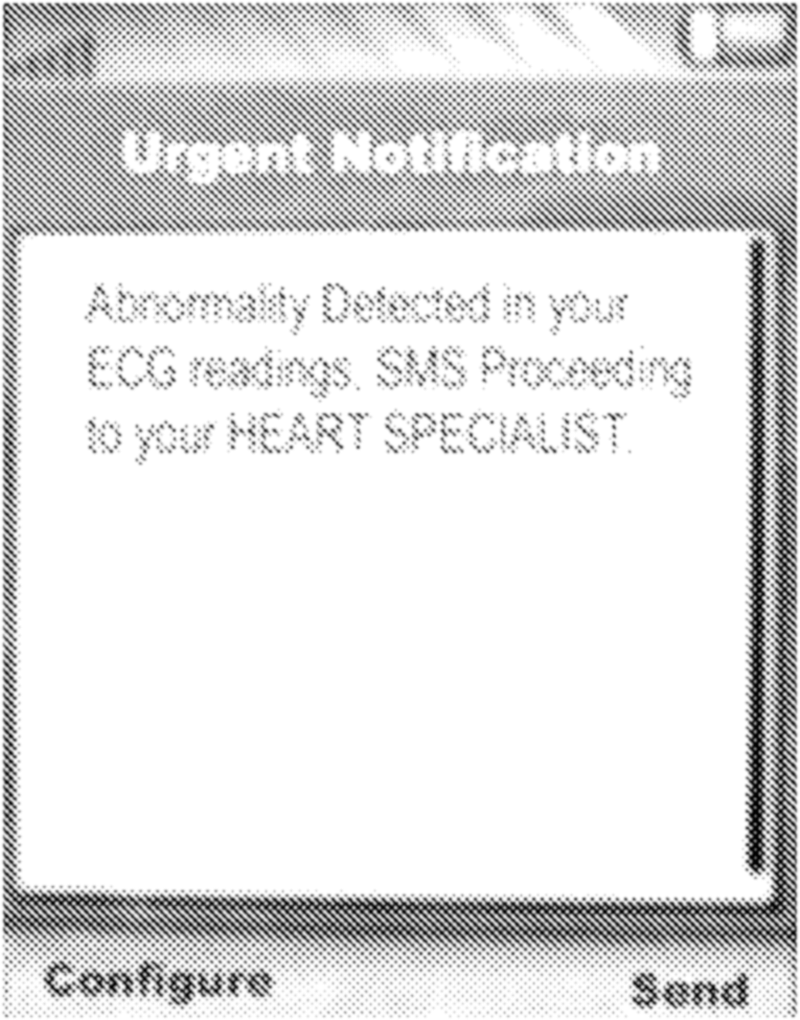
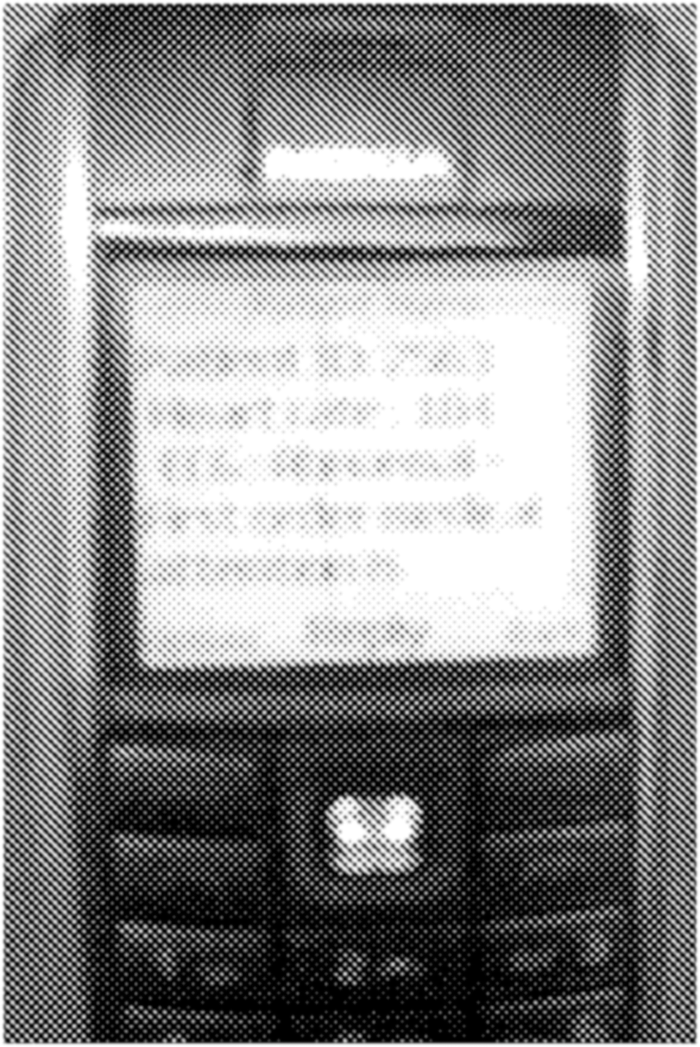
Real-time implementation of our proposed work is shown in Figure 14. The device is significantly smaller than 6.5 cm in size, and it fits precisely in a shirt pocket. The presence of a red color glow from the light-emitting diode as in Figure 14 indicates detection of an abnormality, and the SMS alert will be sent, with the help of the serial communication port that links the PIC microcontroller unit and GSM mobile phone as in Figures 15 and 16. Finally, the reliability of the circuit is proved through the fault tolerance limit of this system, which was found to be around±4%. It is inferred that the cost for designing this model is very low compared with the existing patient monitoring system, and the cost is approximately equal to 3150.0 INR ($56.75164399 USD).

Real-time implementation of the Tele-Alert system.
Abnormal electrocardiogram (ECG) detection using a Global System for Mobile Communication (GSM) mobile phone. SMS, short message service.
Short message service for abnormal electrocardiogram (ECG) detection sent to the doctor's mobile phone.
Inferences from the Hardware Results with Technical Specifications and Comparative Study
The enhanced features of this proposed system are listed in Table 4, and it is also compared with another existing monitoring system.
Technical Specifications of the Proposed System and Deviations from the Existing System
ECG, electrocardiogram; GSM, Global System for Mobile Communication; SMS, short message service; aVr, augmented vector right; aVL, augmented vector left.
Table 5 demonstrates the processing time requirement for the proposed system using different randomly selected ECG files on three different mobile phones using 10 randomly selected ECG entries from the MIT-BIH Arrhythmia database. The amplitude-based technique performs a very simple comparison where the ranges of sample ECG points falling beyond an amplitude threshold are determined to be QRS complex candidates. Action taken by the mobile phone depends on the status of the heart, in terms of HR and ECG, as listed in Table 6.
Performance Comparison of Three Different Mobile Phone Handsets
Different Operations of the Proposed System Based on the Cardiac Status
SMS, short message service.
Table 7 shows the test results for different telecom companies (service providers). Different telecom SIM cards are used to perform this test. It can be seen from the results that the time required for short messages to be transmitted from the patient's mobile to the doctor's mobile phone is a few seconds. The processing times for urban, suburban, and remote (rural) processors are also included in the test results. Performances were compared for three different mobile phones (Nokia C2-01, Nokia C2-03, and Nokia C2-06). These three models are all popular and regular mobile phones within the moderate price range.
Test Results of Time Required for Short Message Service to Reach the Doctor's Mobile Phone with Different Service Providers Along with Different Mobile Handsets for Urban, Suburban, and Rural Areas
Conclusions
A new wireless cardiac telehealth system for HR variability analysis has been presented. The proposed system could be used as a forewarning system for monitoring during normal activity or physical exercises. The most important value of this developed mobile telehealth system lies in the detection of the HR of patients who are located in remote areas or who are traveling and are not in a position to report to the doctor for immediate treatment. An SMS alert can be transmitted using GSM technology to the doctor, and advice can be sought for saving the life of the patient. The proposed module enables the heart patient to be on the move globally carrying out his or her day-to-day work. Its fault tolerance limit was found to be around±4% in urban areas. It is also clear that the proposed system can be used in out-of-hospital settings. In clinical application, we find that it can detect differences between cardiovascular patients and normal persons. This proposed system enables the doctor to receive/analyze the patient's data report and also deliver the doctor's treatment and specialist advice to a remote patient. The doctor does not need to be sitting in front of a stationary computer within the medical facility. These study results have great significance in research, prevention, and early detection of epidemics in the cardiovascular system for the entire world.
Footnotes
Acknowledgments
We would like to express our sincere thanks to the Department of Electronics and Communication Engineering, Thiagarajar College of Engineering, Madurai, Tamilnadu, India, because it has provided all the necessary facilities for the early development of the wireless cardiac telehealth system. The innovative idea and improvement of this proposed work were done as per the precise guidelines of R.S.
Disclosure Statement
No competing financial interests exist.