
Abstract
Introduction
Postpartum is a period during which there is an adaptation between the child and the mother. Feelings of anxiety, irritation, and sadness are common in the first 2 weeks after giving birth, and usually disappear without any treatment. Postpartum depression (PPD) can appear even months after childbirth. Symptoms are the same as major depression. Unlike what happens with depressive disorders in other life stages, PPD creates a double negative impact because it affects both the mother and the newborn. 1 This may cause a negative impact on the future development of the infant until elementary school. 2 Research has consistently shown that depression or anxiety during pregnancy, recent stressful life events, lack of social support, low self-esteem, and neuroticism are risk factors. Regarding epidemiology, the literature review referenced by the World Health Organization, from the Toronto (ON, Canada) public health system, indicates that PPD is a public health problem that affects near 13% of women within the first year after giving birth. 3
It has been shown that PPD is a serious disorder that affects the mother, the family, and the newborn. 4 –6 However, the disease often goes undiagnosed. In developed countries like the United States, about 50% of cases of PPD remain undetected in clinical practice. 7 Although some steps have been taken to detect depressive symptoms in women who have just given birth, the development of a screening program requires considerable and careful effort. Evidence-based decisions have to be taken according to two principles. The first one is to obtain the most effective screening test that not only has a high level of sensitivity and acceptable specificity, but also that is quick to perform and easy to interpret and implement, in addition to being culturally sensitive. The second principle to consider is taking into account issues related to a public health system, such as cost-effectiveness or potential harm of misdiagnosis.
An early prediction or diagnosis could reduce the impact of the disease in the mother and help clinicians to provide an appropriate and comprehensive medical treatment in order to prevent depression and therefore avoid or limit potential fallout. As a result, there has arisen the need to design instruments and tools for early detection that can be effective and easily applied by physicians. Among the self-report measures, the most well-known and the one used to detect possible cases of PPD is the Edinburgh Postnatal Depression Scale (EPDS). 8,9
At this point, it is interesting to consider the use of clinical decision support systems (CDSSs), which provide specific and accurate knowledge to make decisions during diagnosis, prognosis, treatment, and patient management. CDSSs are related to the concept of evidence-based medicine, 10 inasmuch as they infer knowledge from data extracted from biomedical databases and later assist in the diagnosis of new patients based on this acquired knowledge. More complex CDSSs are directly based on the use of artificial intelligence in medicine, 11 specifically machine learning (ML), 12 where algorithms to infer predictive models from “real world data” are used. In ML, pattern recognition (PR) refers to the assignment of a class label to an input set of values. In the present case, the most direct example would classify a mother who has just given birth in or out of population at risk for developing PPD.
Taking a step forward to make the use of such a CDSS easier, it is simple to reach the concept of mobile health (m-health). The Global Observatory for e-Health of the World Health Organization defines m-health as “medical and public health practice supported by mobile devices, such as mobile phones, patient monitoring devices, personal digital assistants (PDAs), and other wireless devices.” 13 This allows for a much more easily accessible range of applications (apps), even those of a medical nature. In this context, a mother who has just given birth and is recovering during the first days in the hospital could answer a simple questionnaire on her own smartphone, or on one provided by the healthcare service. Thus, it would be possible to identify her as belonging to a population at risk for developing PPD, notifying the appropriate medical staff automatically. Therefore, this type of app may serve as a powerful tool in the prevention of this disease.
Regarding the existing mobile platforms that allow for the development of such kinds of apps, Android® (Google, Mountain View, CA) has become one with greater market penetration, having more than 1 million device activations daily according to official data. Furthermore, it provides repositories for powerful development tools used by software developers all around the world and does not require any revision by third parties to publish a new app. Therefore, Android offers great flexibility and access to a large number of potential users.
Because there is no single etiologic pathway by which PPD appears, it is unlikely that a single prevention method or treatment will be effective for all women. A multifactorial approach that combines the contributions of psychological, psychosocial, and biological factors would probably be more beneficial and effective because it contemplates the various etiological factors and individual variations. Tortajada et al. 14 addressed this view in 2009 in their study based on clinical data from 1,397 women who had just given birth. Biological and psychosocial variables were used in order to achieve classification models to predict PPD during the 32 weeks after childbirth, including a genomic DNA analysis and information concerning the eighth week after birth. The highest accuracy they obtained was 84%, using a hold-out evaluation.
The first goal of this work is the development of classification models for detecting the risk of PPD during the first week after childbirth, thus enabling an early intervention. A reasonable level of sensitivity and specificity is expected, following a data mining methodology with the same database used by Tortajada et al. 14 Such models must be evaluated and compared empirically. The second main goal is to design and develop an m-health app that integrates in a CDSS, for the Android platform, the model with best performance, in order to be used by both mothers who have just given birth as well as clinicians who want to monitor their patient's test. It is worth to note that our approach is to provide an early help during the first week after delivery and not only during the next 32 weeks. As far as we know, this is the first validated CDSS focused to predict PPD during the first week after delivery.
Materials and Methods
Data Source
The data came from the Spanish government-funded project “Genetic-environmental vulnerability to postpartum depression,” 15 in which information about postpartum women was collected from seven Spanish general hospitals (IMIM-Hospital del Mar, Barcelona; Hospital Clínic, Barcelona; Hospital Carlos Haya, Málaga; Hospital Pere Mata, Reus; Hospital Son Dureta, Palma de Mallorca; Hospital Parc Tauli, Sabadell; and Hospital Jiménez Díaz, Madrid) during an 11-month period. All the participants were white, none of them were under psychiatric treatment during pregnancy, and all of them were able to read and answer the clinical questionnaires. Women whose children died after delivery were excluded. The Local Ethical Research Committees approved this study, and all the patients gave their written informed consent.
Figure 1 shows the timing diagram of the prospective study. Of the 1,880 women initially included in the study, 76 were excluded because they did not correctly fill out all the scales or questionnaires. With these patients, a prospective study was made just after childbirth and at 8 weeks and 32 weeks after childbirth. At the 8-week follow-up, 1,407 (78%) women remained in the study. At the 32-week follow-up 1,397 (77.4%) women were evaluated. In total, 11.5% (n=160) of the women at baseline, 8 weeks, and 32 weeks had a major depressive episode during the 8 months of postpartum follow-up. Hence, from a total number of 1,397 patients, 160 correspond to the positive class and 1,237 to the negative class.

Time chart of the monitoring and evaluation of postpartum depression (PPD) in the prospective study population.
The protocol diagram used to determine if patients suffered PPD is detailed in Figure 2. Depressive symptoms were assessed with the total score of the Spanish EPDS test version 16 just after delivery, at Week 8, and at Week 32 after delivery. Major depression episodes were established using first the EPDS (cutoff point of 9 or more) at 8 or 32 weeks, and then probable cases (EPDS score of ≥9) were evaluated using the Spanish version of the Diagnostic Interview for Genetics Studies 17,18 adapted to PPD in order to determine if the patient was suffering a depression episode (positive class) or not (negative class). Clinical psychologists conducted all the interviews with previous common training in the Diagnostic Interview for Genetics Studies.
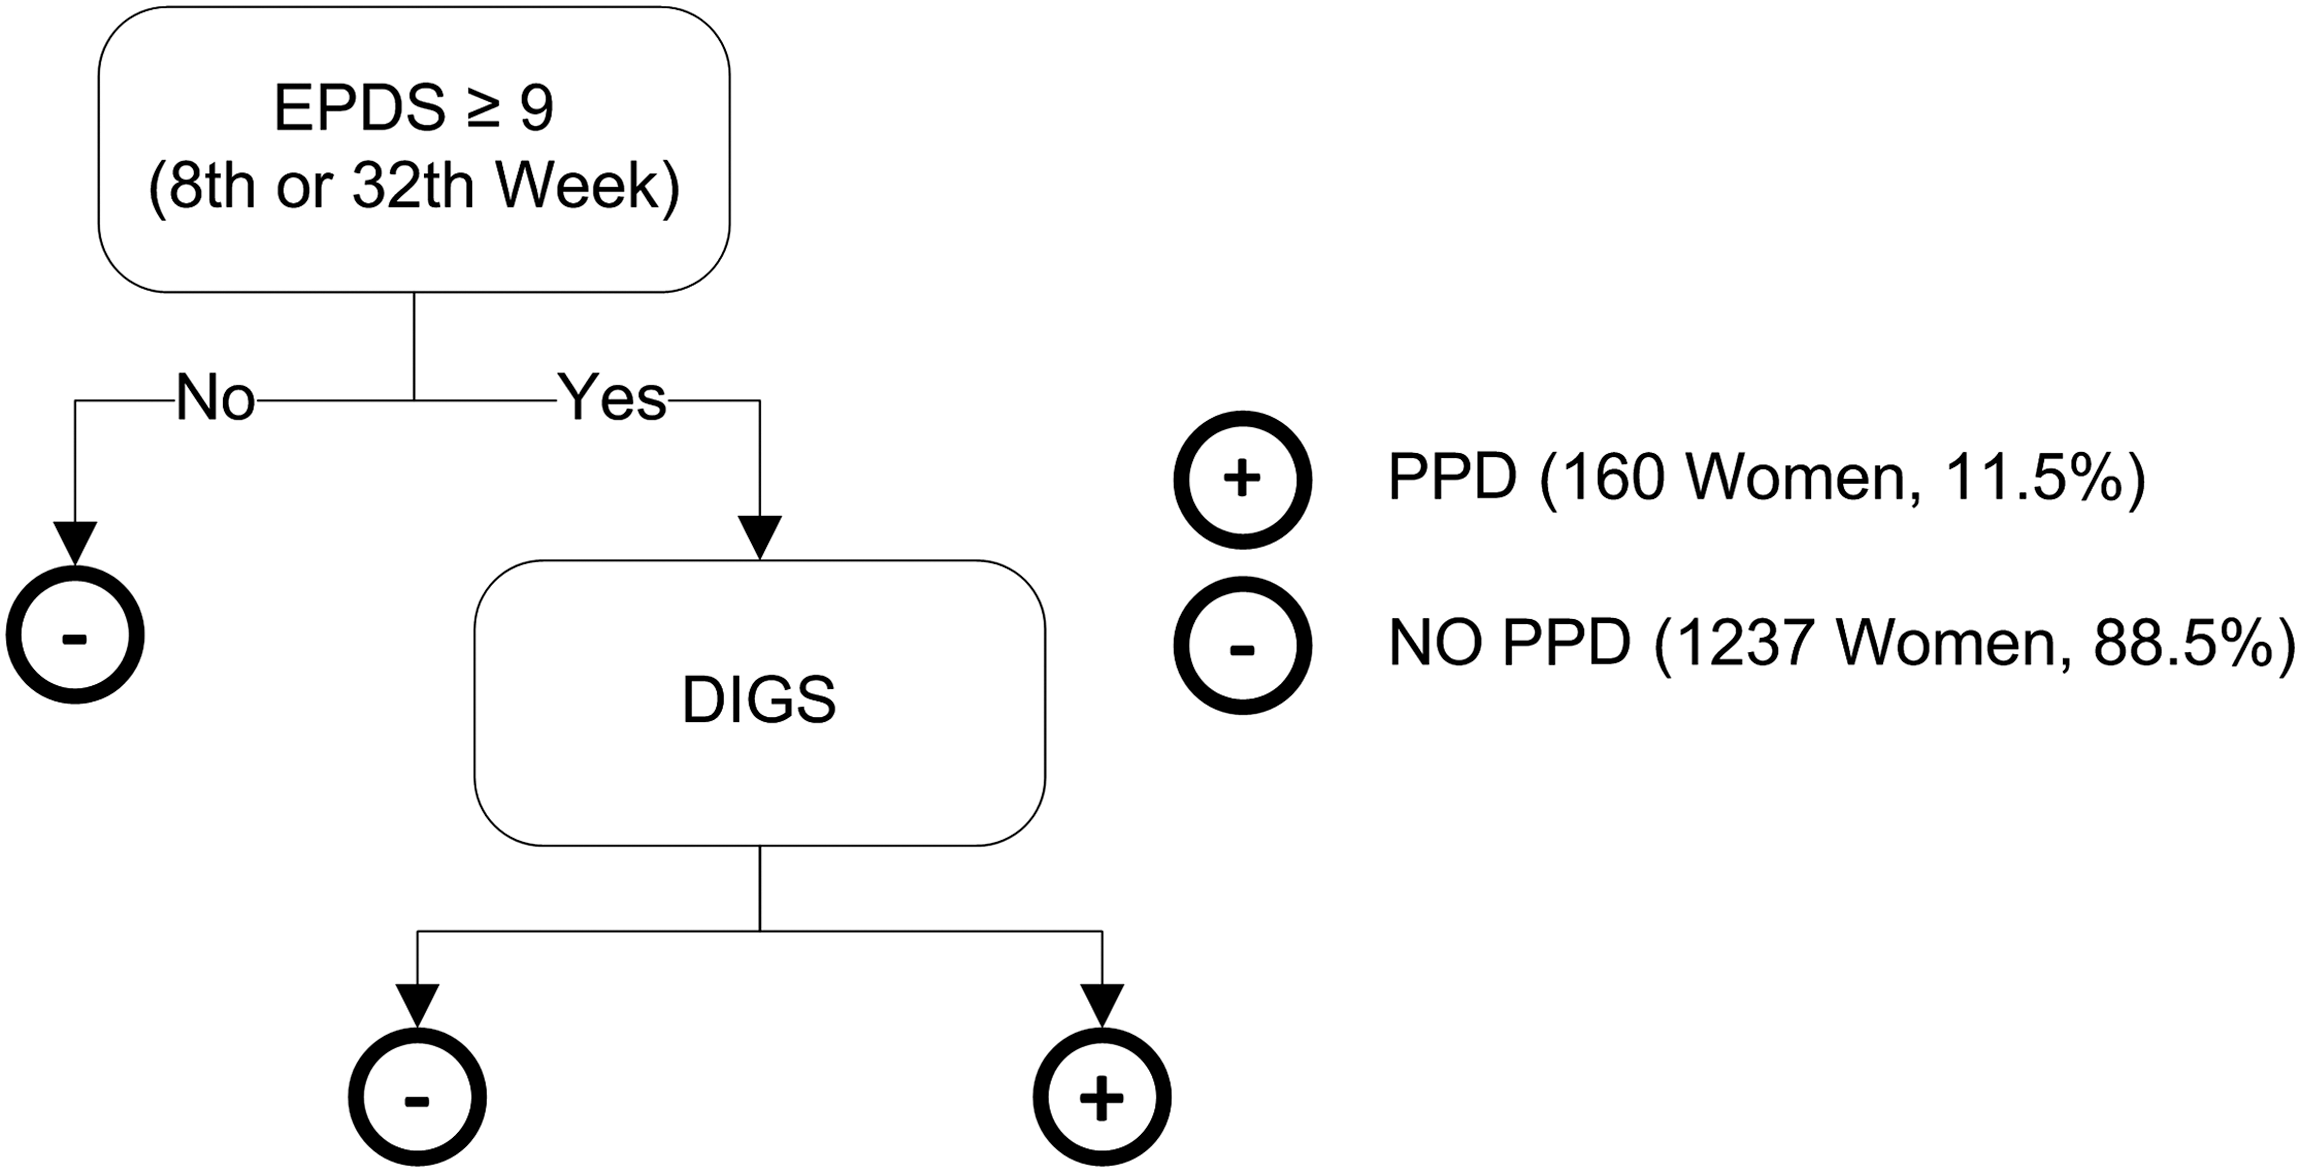
Protocol to determine if mothers suffered postpartum depression (PPD) during the prospective study. EPDS, Edinburgh Postnatal Depression Scale; DIGS, Diagnostic Interview for Genetic Studies.
Independent Variables
The independent variables to be included in the classification models must meet the following requirements: mothers must be able to answer to such values during the first week after delivery; any other additional diagnostic test, such as a blood or DNA analysis, that would increase the cost is not allowed; and it must be significant according the current knowledge of PPD. As a result, only socioeconomic parameters, psychiatric antecedents, and easy-to-answer questionnaires were allowed, although other relevant medical information was also available.
Database variables related to information following the first week after birth need to be excluded. Overall, only 11 of the 16 variables initially available have been used. With these constraints it is assumed that a classification performance as high as the one obtained in Tortajada et al. 14 will not be reached. However, it is expected reasonable accuracy will be achieved, apart from being an inexpensive and easy-to-answer test.
From the database of the above prospective study, 11 variables met these conditions. Table 1 shows the clinical variables used in this study. Socioeconomic variables were age, highest education level achieved rated on a 3-point scale (low, medium, or high), labor situation during pregnancy, household income rated on a 4-point scale (economics level), gender of the baby, and number of family members who live with the mother.
Independent Variables Used in This Study
For categorical variables, the number of patients (percentage) is shown. For noncategorical variables, the mean±standard deviation is given. The second column shows the number of missing values for each variable. The last two columns show a statistic for each class.
EPDS, Edinburgh Postnatal Depression Scale; EPQN, Eysenck Personality Questionnaire–Neuroticism; PPD, postpartum depression.
Personal and family history of psychiatric illness (psychiatric antecedents) and emotional alteration during pregnancy were also included as binary variables (yes/no). Furthermore, traumatic or stressful life events are considered as risk factors in the literature and clinic guides. 19,20 The number of these experiences just after delivery according to the patient's point of view was used.
Neuroticism and depressive symptoms were evaluated by the scores on the corresponding next two psychiatric tests.
Neuroticism can be defined as an enduring tendency to experience negative emotional states. The Eysenck Personality Questionnaire short scale (EPQ), being the most widely used personality questionnaire, measures neuroticism. It consists of 12 items. Individuals who score high on neuroticism are more likely than the average to experience such feelings as anxiety, anger, guilt, and depression. Scores obtained during the prospective study with the Spanish validated version were used. 21,22
EPDS is a 10-item self-report scale that evaluates depressive symptoms just after delivery, and it has been validated for the Spanish population with a cutoff score of 9 points or more for PPD. 16 The scores used as independent variable in our models were the initial EPDS value referring to the moment of birth.
Only labor situation during pregnancy was treated as a categorical variable using a dummy representation (i.e., 1 unit represents one of the possible values of the variable, and this unit is activated only when the variable takes this value). Missed variables were simply represented by not activating any of the units. All other variables were treated as discrete and represented by only one input unit, replacing the missing values by their mode.
ML and PR
PR refers to the automatic discovery of features in the data to classify them into different categories or classes. PR models are usually developed using ML techniques, which provide mathematical and computational mechanisms to infer knowledge from observations of a particular domain.
The life cycle of a PR problem based on ML can be divided into two main phases: training and recognition. During the training phase a set of data is used to build the PR model. It is at this stage where an adaptive model is adjusted for the best possible generalization, and thereby new samples are solved during the recognition phase. Once the model is ready, it can be incorporated into a CDSS to assist in future observations to recognize such patterns. 23
During this work, we experimented with four different types of PR classifiers: Naive Bayes, logistic regression, support vector machine (SVM), and artificial neural networks (ANNs).
Evaluation criteria for models
To select the model with better performance, we used a hold-out evaluation where the observations were chosen randomly to form the training, validation, and evaluation datasets. In order to obtain a good error estimation of the predictive model, the database was split into three different datasets: the training set, with 1,006 patients (72%); the validation set, with 112 patients (8%); and the test set, with 279 patients (20%). Each partition followed the prevalence of the original database (11.5%), including 115, 13, and 32 patients who finally suffered a depressive episode in each respective dataset. The best model hyperparameters were selected empirically using the validation set and then evaluated with the test set.
The main goal was to obtain a predictive model with a good sensitivity and specificity. Both measures depend on the accuracy on positive and negative samples, respectively. Increasing sensitivity will be obtained at the cost of decreasing specificity. Note that the dataset is imbalanced
24
because of the positive class is underrepresented compared with the negative class. A good estimation of the relation between sensitivity and specificity is the geometric mean of the two accuracies,
Another well-known relation between sensitivity and specificity is the area under the curve obtained from the receiver operating characteristic curve. 25 The larger the area under the curve, the higher the discriminant potential of the model. Area under the curve values on the test dataset for the developed models were calculated.
Naive Bayes
The naive Bayes classifier is based on Bayes' theorem. 26 This assumes that the effect of any feature value (x i) in a class (c) is independent of any other feature's values. When classifying a new sample, the most likely class among all is selected according to the posterior class probability, P(c|x), for each class.
We tested four different class-conditional data distributions for P(x|c): normal (Gaussian) distribution, kernel smoothing density estimate, multivariate multinomial distribution for discrete data (assuming each individual feature follows a multinomial model within a class), and multinomial distribution for classifying the count-based data such as the bag-of-tokens model. A grid search was carried out in order to determine the best distributions and their parameters. We also considered equally likely prior probabilities for each class P(c) and compared it with the empirical priors.
Logistic regression
Logistic regression models are used when the dependent variable is binary, producing a sigmoid curve bounded to values between 0 and 1. Logistic function can be transformed using the logit transformation into a linear model. The log-likelihood was used for estimating regression coefficients (β i ) in the model, considering the observed responses in the training dataset as a binomial distribution. 27 –29 After estimating the coefficients, we adjusted an optimal cutoff point based on the G measure.
SVM
SVM finds the minimal input data (support vectors) that define the hyperplane that maximizes the margin between two classes. 30 To generalize the cases where the decision boundaries are not linearly separable, SVM projects the training data into another higher space dimensionality. This is carried out implicitly using a kernel function (K). K can be of type polynomial, Gaussian radial basis function, or sigmoid perceptron. 31 To allow flexibility, a soft margin controlled by the hyperparameter C was used. Therefore, C represents the compromise between margin size and classification error number.
A grid search was carried out in order to determine the kernel function and its hyperparameters with best generalization on the validation dataset. Experimentation with polynomial kernels consisted of a search of the polynomial order (d) in the range (1, 7). Search in the radial basis function σ kernel parameter in the range (3.0, 15.0) was done. Search in the sigmoid perceptron α parameter in the range (0.1, 2.0) and (−1.0, −0.1) in β was done. For all kernels and their hyperparameter variations, a search on C in the range (0.6, 1.0) was performed. The step taken in floating point values was always of 0.1. Thus, in total, 1,640 distinct hyperparameter combinations for SVM were validated.
ANNs
ANNs are made of many simple processors (neurons or units) based on Rosenblatt's perceptron. 32,33 A perceptron gives a linear combination of the values of its inputs and weights plus a bias value. The output is calculated by applying an activation function to the input. A feedforward multilayer perceptron (FFMLP) consists of an input layer with one unit for every independent variable, one or two hidden layers of perceptrons, and the output layer for the dependent variable. We call an FFMLP fully connected when every unit of each layer receives an input from every unit in its preceding layer and the output of each unit is sent to every unit in the next layer. According the Master's pyramid rule, a perceptron layer must contains fewer units than the preceding one. 34,35
In this work, the ANN hyperparameters to be determined are related to the topology (number of hidden layers and number of units per layer). Parameters adjusted by the training algorithm are the values of the weight matrix and bias vector. A grid search with fully connected FFMLPs with one and two hidden layers following the pyramid rule was used. The best network architecture and its parameters were selected empirically using the validation set. The activation function for all units was the hyperbolic tangent. For each neural network the cutoff point on the output that maximized the relationship between sensitivity and specificity (G) on the training set was selected.
Graphical User Interface Architecture
The main task of an application's graphical user interface is to provide a simple visual environment to allow the communication between the software and the user. In the Android platform, the Activity concept represents a unit of interaction with the user, corresponding to a screen of the application. An Android app usually consists of a set of Activities through which the user can browse. All Activities that make up an app must pursue a common goal. In our case the goal is to help the final user to get an estimation of the risk of developing PPD. The user can be either a clinical staff member or a mother who has recently given birth. After answering the questionnaire they can see in a clear and understandable way the result of the classifier, that is, if the mother belongs to the population at risk for PPD or not.
Figure 3 shows the flowchart and architecture that the different Activities of the mobile app follow to achieve the goals. Initial Activity is the junction point between all the others, being the first that appears on screen as a main menu. Settings Activity enables the indication of whether the end user is a mother who has just given birth or a clinician, so that the language and the test questions can be adapted for each case. In Test Activity, questions related to each independent variable will be shown one by one. Finally, Results Activity shows the classification result to the user in a clear and understandable way, avoiding user confusion with understandable terminology.
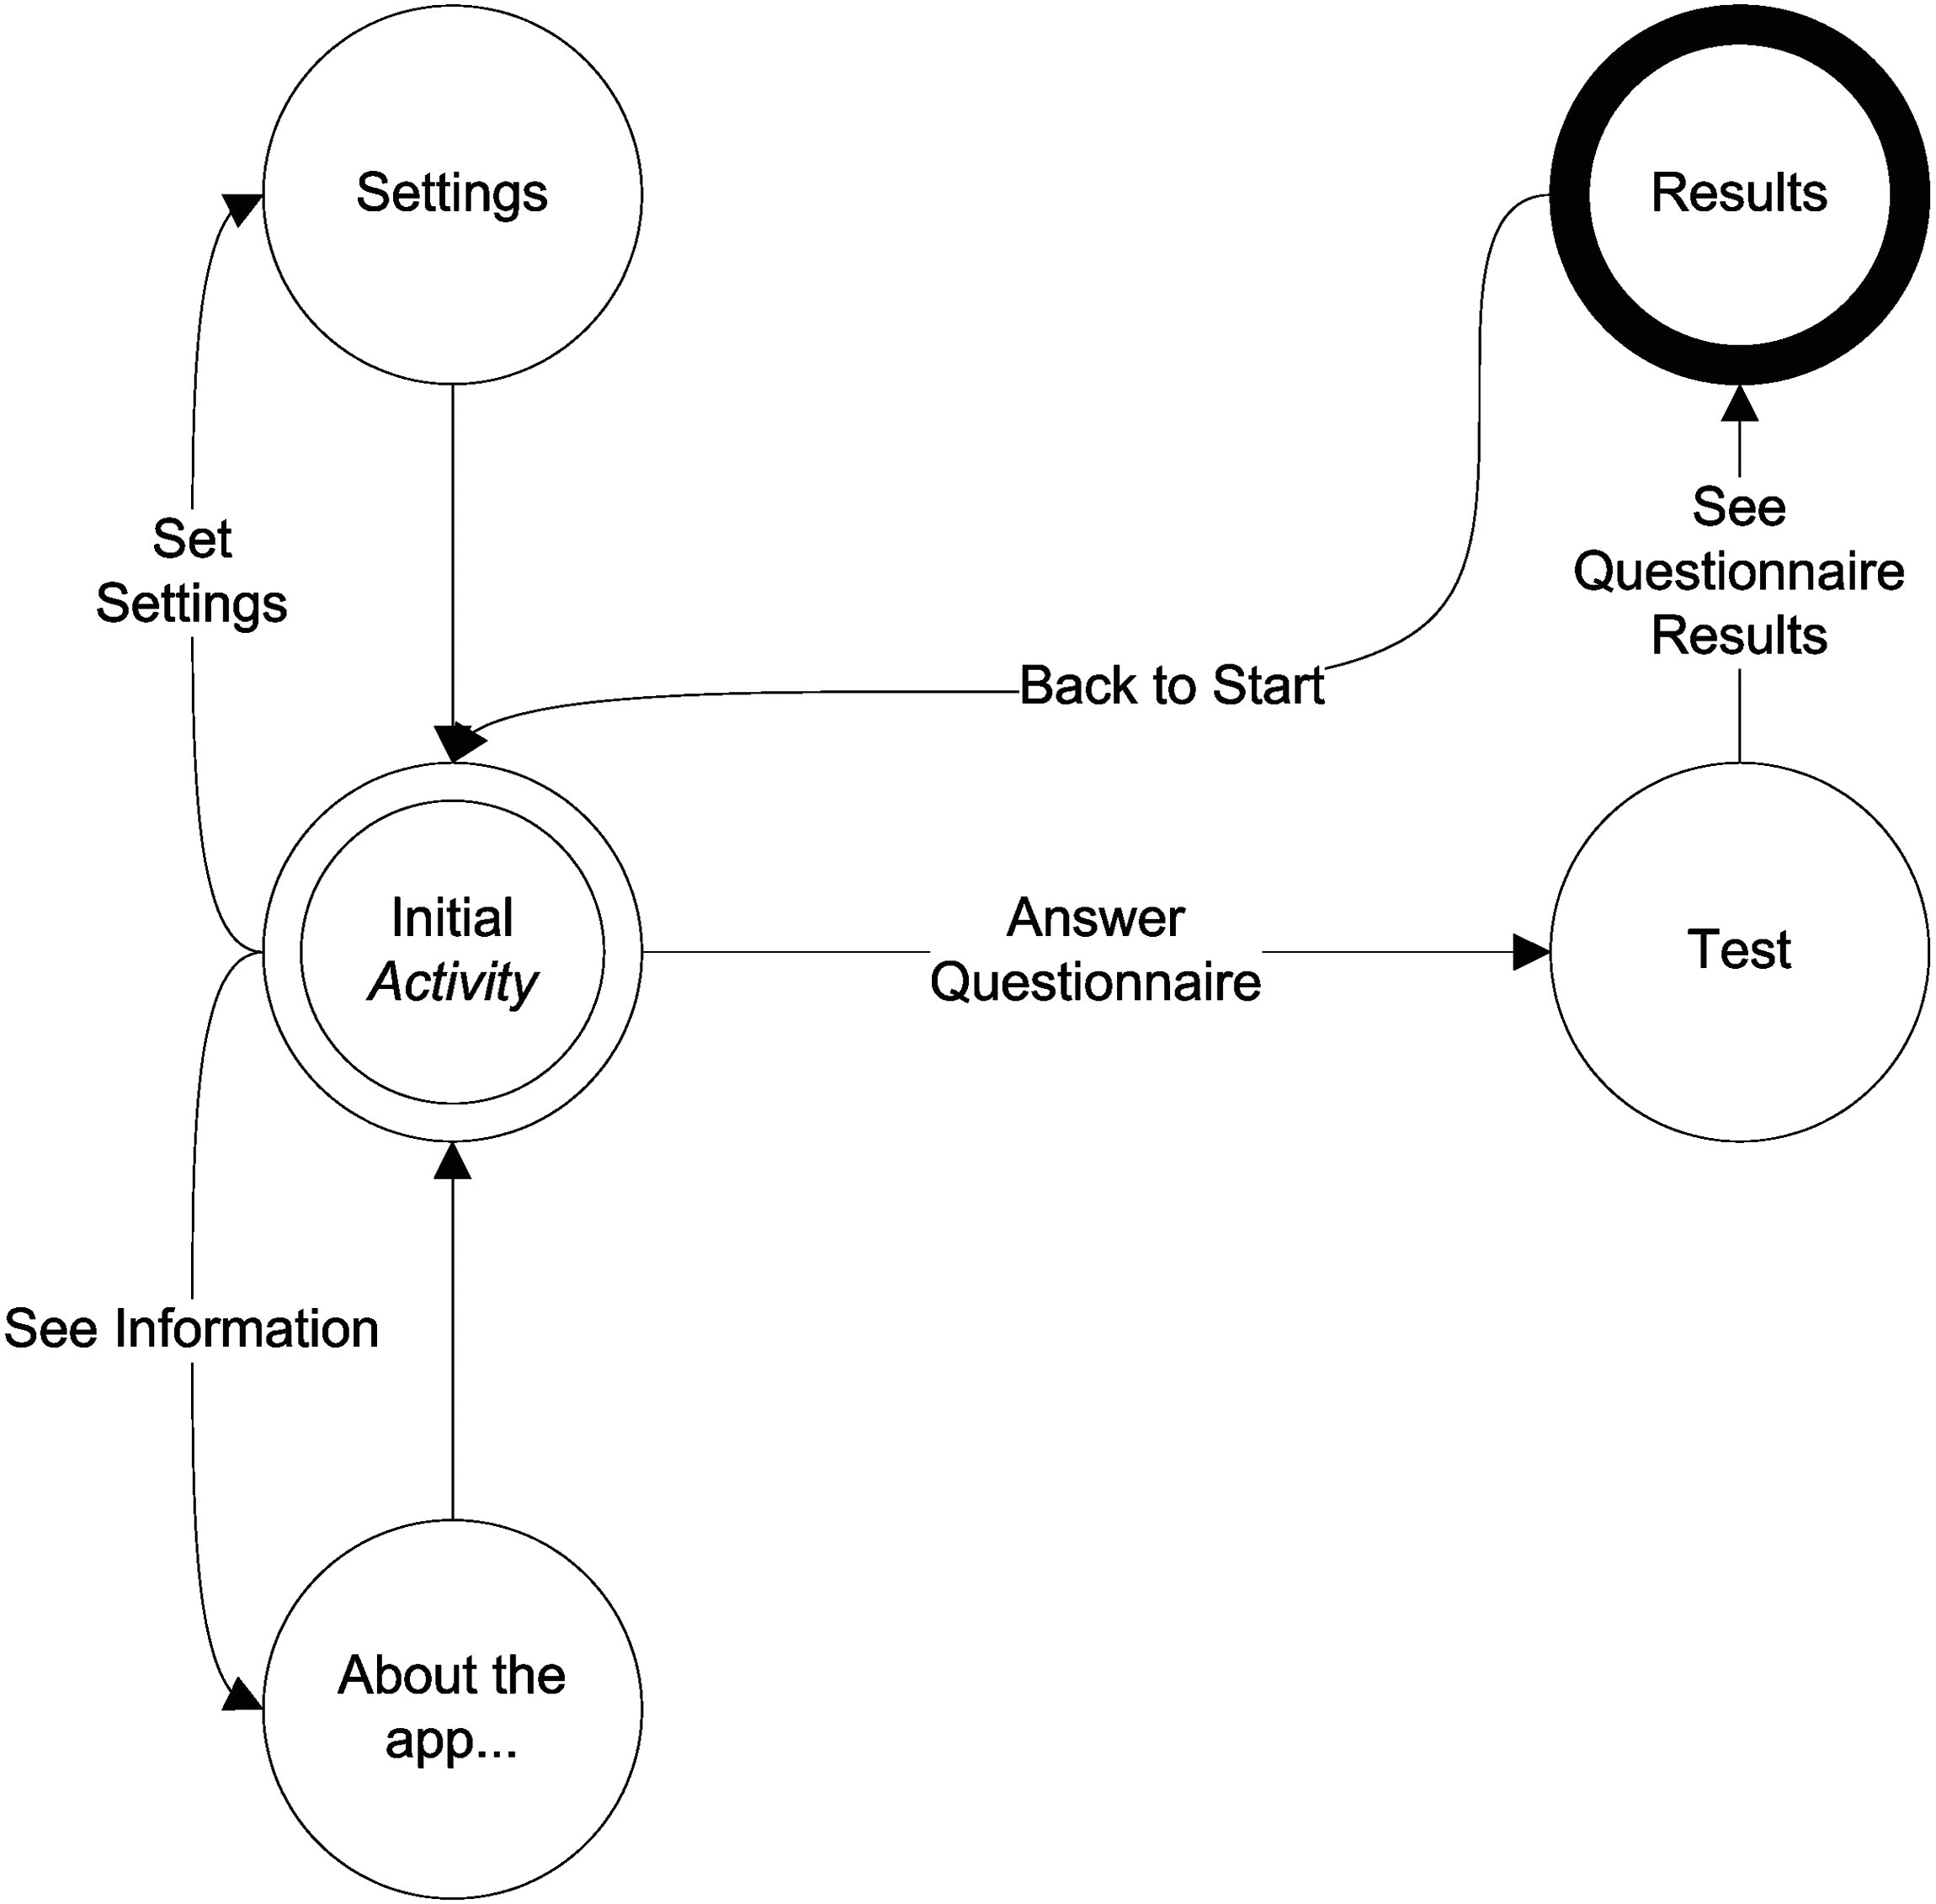
Flowchart showing the different activities of the mobile application (app).
Results
Table 2 shows the results for the best models obtained during the training and validation process of this work for each kind of classifier compared with the best ANN results given by Tortajada et al. 14 in which they used all independent variables available.
Comparison of the Classification Results for the Best Models Obtained During This Work and During the Study of Tortajada et al. 14 on the Test Dataset
Data are given for number of independent variables used, minimum number of weeks after delivery to get all the values of a sample, G value, sensitivity (SEN), specificity (SPE), area under the curve (AUC), and model accuracy with its confidence interval (CI) at 5% of significance on the test dataset.
ANN, artificial neural network; SVM, support vector machines.
The naive Bayes model with the highest G value used normal distribution as the independent probability distribution and uniform prior probabilities. The best logistic regression model presented a cutoff point of 0.13 in the output values to separate the classes. The best ANN model achieved had a 14-7-5-1 topology (i.e., two hidden layers of 7 and 5 units, each one) and a threshold of 0.14 to separate distinct classes. The best SVM model was obtained using a radial basis function kernel with σ=5.3 and soft margin value C=0.8.
Among all the trained models during the experimentation, the naive Bayes model presented the best performance on the test dataset according to G function, with a value of 0.73. A good balance among sensitivity, specificity, and accuracy was achieved, with values close to 0.73 in all cases. Thus, a new naive Bayes model with the above best hyperparameters and using all the available data from 11 independent variables was retrained and integrated into the Android mobile app described below.
Figure 4 shows the developed mobile app's most important screenshots for the Android platform. The whole test is composed of easy-to-answer questions displayed one at a time. If the final user is a mother during the first week after delivery, a total of 32 questions must be answered, inasmuch as EPDS and EPQ-Neuroticism (EPQN) tests are composed of 10 and 12 questions, respectively. If the final user is a clinician, the test is reduced to 11 questions because the EPDS and EPQN scores are given directly.

Screenshots of the mobile application developed, named “eDPP Predictor.” EPDS, Edinburgh Postnatal Depression Scale.
For questions that require a numeric value as input, a text box on which the data are introduced via the virtual keyboard is displayed (Fig. 4a). For multiple-choice questions, a list on which the user has to select one with a simple push is displayed (Fig. 4b). Finally, after all the questions are answered, the app encodes all the answers for the input of the model. The classification result of this new sample as belonging or not to the population at risk of PPD is obtained (Fig. 4c). In addition, the success probability is also obtained using the classifier's sensitivity in case of a positive result and using the classifier's specificity if the result is negative.
Discussion
The main contribution of this work is the development of a CDSS in the Android platform that is able to classify through a simple questionnaire if a mother who had just given birth is at risk of developing a PPD episode during the first week, enabling an early intervention.
A database containing socioeconomic parameters, clinical data, and psychiatric questionnaires scores from 1,397 patients was used. After analyzing the information and the application of a data mining methodology for the development, validation, and evaluation of different classification models, we show that the naive Bayes model had the best performance, with balanced sensitivity and specificity close to 0.73. Questions about independent variables used at the classification models can be answered by mothers during the first week after delivery.
It was designed and developed an m-health clinical decision support app for the Android platform integrating the naive Bayes model, which showed the best performance among those evaluated during this work. This mobile app can be used by both mothers who have just given birth as well as clinicians who want to monitor their patient's test. After the user answers all the test questions, the classification as belonging or not to a population at risk of PPD is displayed in a clear and understandable way.
As expected, inasmuch as only 11 of the 16 variables used by Tortajada et al. 14 were also used in this work, our classification performance is not as high as theirs. However, a reasonable accuracy was achieved apart from ours being an inexpensive and easy-to-answer test that can be answered during the first week after birth on most Android mobile devices, offering verified results. This is linked with the idea of an effective and cost-efficient screening as it would allow, through the answering of a few simple questions, for the identification of possible PPD cases that would otherwise remain undiagnosed. It has been shown that is possible to put in clinicians' and patients' hands a tool that helps to prevent the disease as well as to detect the population at risk.
In this study, the proposed models have achieved an estimation of parameters and an internal validation in the study population. Future works should include an external validation of the final model based on a prospective cohort study and an impact analysis of the models. 36 This would require checking the difference of PPD appearance among mothers who answer our questionnaire and after a positive result are treated by clinicians and those who are not. Regarding the Android app, it would be possible to get useful information on the appearance of PPD after a few months following childbirth in order to create new classifiers because mobile apps provide easy ways to obtain user feedback. Besides, it would be useful to allow sending the results to other analysis or storage apps because the current version of the app only shows the results to the final user on the screen. Regarding classification models that were not used during this study, it would be interesting to check Bayesian networks because these can also deal with missing data, find probabilistic dependencies, and present a good performance. 37
Conclusions
Different models for predicting PPD have been developed using ML and PR techniques. These models have the ability to predict PPD during the first week after childbirth with a reasonable accuracy. Finally, the model that achieved the best balance between sensitivity and specificity was integrated into a CDSS for Android mobile apps. This approach can enable the early prediction and detection of PPD because it fulfills the conditions of an effective test with an acceptable level of sensitivity and specificity that is quick to perform, easy to interpret, culturally sensitive, and cost-effective. The mobile app can be clinically evaluated in future works.
Footnotes
Acknowledgments
The authors acknowledge the Spanish Ministerio de Sanidad (grant PIO41635, Vulnerabilidad genético-ambiental a la depresión posparto, 2006–2008) and the Instituto de Salud Carlos III (RETICS Combiomed, grant RD07/0067/2001), which partially funded the project in which the database used during this work was obtained.
Disclosure Statement
No competing financial interests exist.