




Abstract
Introduction
An important factor that affects the management of hypertension is the recognition of the disease and degree of treatment. According to the National Health and Nutrition Examination Survey, hypertension is one of the most common diseases, with a reported prevalence of approximately 65 million individuals in the United States. 1 According to The Joint National Committee report, 2 high blood pressure (BP) and body mass index (BMI) have a very close relationship as a risk factor for cardiovascular diseases; the hypertension evaluation index is based on systolic BP (SBP) of ≥140 mm Hg and diastolic BP (DBP) of ≥90 mm Hg, and the obesity evaluation index is based on a BMI of >30 kg/m2. 2,3
Patients who check their BP regularly at home showed a strong will to achieve the BP control goal. The self-measurement of BP at home may increase BP control and patients' compliance with treatment, but it is difficult to practice on a daily basis. The self-monitoring system for BP control provides similar accuracy akin to seeing a doctor by giving low-cost, direct feedback on BP control. 4,5
Recent studies showed that home BP remote monitoring was more effective in achieving the BP control goal than traditional treatments. 6 Home BP remote monitoring has been identified as a useful tool for hypertension control. 7 Telemonitoring provides a more effective approach in long-term home BP monitoring than self-BP measurement and control. 8
In addition, in the study conducted in Taiwan in 2010 involving the Citizen Telemedical Care Service System service, the effect on the BP was analyzed by dividing the evaluation group into two groups (patient group with regular frequency of measurement and patient group with irregular frequency of measurement) through a survey in advance. 9 However, by dividing the evaluation groups in advance through a survey, this study has not been able to confirm that the frequency of measurement in evaluation groups did not change consistently during the study period of receiving the telehealth service.
Furthermore, there are a lot of studies on the effects of telemedicine and telehealth through the doctor's intervention in hypertension management. However, up to now not many studies have analyzed the effect of the self-measurement frequency level at home. Therefore, it is necessary to analyze the improvement effect in accordance with self-measurement compliance by classifying the evaluation group after the end of services with automatically transferred data for patients who receive the hypertension management services.
As well, the telehealth and telemedicine infrastructure for patient healthcare monitoring has not been adequately built in South Korea. 10 For this reason, it is very important to build a practical system to provide the telehealth service and analyze the service's effects. The purpose of this study is to evaluate the disease improvement indices in hypertension patients according to three groups of self-measurement compliance. 11 –13
Materials and Methods
This study evaluated the disease's improvement effect after the provision of the 6-month (24-week) service to patients with hypertension who agreed to participate in the SmartCare pilot project, which was conducted in 2011 in South Korea. The evaluation group was classified into three groups—Low, Middle, and High—by evenly dividing the monthly BP average measurement frequency for the 6 months. The evaluation indices were SBP, DBP, weight, and BMI of hypertension patients and the average monthly change from baseline (1 month) to 6 months.
Participants and Study Period
Participants were selected from patients who were able to use a personal computer and who were being treated for hypertension among outpatients at three tertiary university medical schools. Those participants who completed the measurements with the SmartCare services from December 1, 2011 to August 30, 2012 were selected for final analysis, and the study was conducted after receiving Institutional Review Board approval.
The selection criteria to participate in the SmartCare service are as follows: 1. Adult male/female patients over 20 years old who are able to visit hospitals for treatment. 2. Patients with administration of one or more antihypertensive preparations: • Who do not have diabetes mellitus or renal disease and whose SBP is 140 mm Hg or higher or • Who do have diabetes mellitus or renal disease and whose SBP is 130 mm Hg or higher. 3. Patients who can understand the purpose of the study and who have literacy skills. 4. Patients who can use the SmartCare personal computer used in the study. 5. Patients who have participated in the study voluntarily and signed a written consent form.
The exclusion criteria from participation in the SmartCare service are as follows: 1. Hypertensive patients with severe hypertension of 200 mm Hg or higher mean SBP twice during the sitting measurement in the screening visit. 2. Patients with secondary hypertension. 3. Patients with a hemoglobin A1c level over 11%. 4. Patients who are hospitalized or require hospitalization due to hypertension. 5. Patients who experienced myocardial infarction or serious coronary artery disease within 6 months or who have clinically significant congestive heart failure or cardiovascular defects. 6. Patients with alcoholism, psychosis, or drug dependence.
Smartcare Center
In the SmartCare center, health managers (nurses, nutritionists, and exercise prescribers) monitored the measurement data transmitted by participants through the SmartCare system, analyzed data using the clinical decision support system (CDSS), 14 and provided personalized health management counseling services. The health managers provided the prevention, consultation, and education services remotely to patients when they thought there was no medical risk with the remote telehealth. In addition, when participants received care from the medical institutions, they enabled physicians to refer to the patient's health management information in order to provide adequate care.
Health managers who were well-trained professional staff from the remote health consultation company (AIMMED, Seoul, South Korea) provided the SmartCare remote consultation services. If the doctor's decision was required while the counselor provided the consultation to the patient, a doctor who belonged to the SmartCare Center gave the consultation. The consultation manual used by health managers was prepared with the appropriate contents based on medical determination from the specialists, and the remote consultation service hours were adjusted by the strict consultation time schedule so that all subjects could receive the consultation evenly. Similarly, the healthcare contents and consultation manual were produced by medical experts from the professional healthcare company, and the final distribution was done when they were appropriate after being reviewed by doctors.
Smartcare Service Procedure
The SmartCare system is a Web-based remote patient monitoring system. 15 The SmartCare service pilot project's participants were evaluated for their suitability according to the general descriptions and participant selection criteria. They then filled out the application and consent form. For participants who went through the consent procedure, a netbook (mini-notebook) equipped with the SmartCare application, a video camera, and a medical device (BP and weight scale) were provided for telemonitoring. All participants also received user manuals containing the SmartCare application and instructions for the medical device. The devices and manuals were provided to the participants for free through the funding for the national project.
When the participants measured their BP and weight at home using the medical device provided, the measurement data were transmitted to the SmartCare system through the netbook. With the transmitted data, the results report was automatically created based on the personal health condition of participants according to the CDSS algorithm built into the SmartCare system. Based on this report of results, participants and health managers were able to check health information through the SmartCare application (Fig. 1).
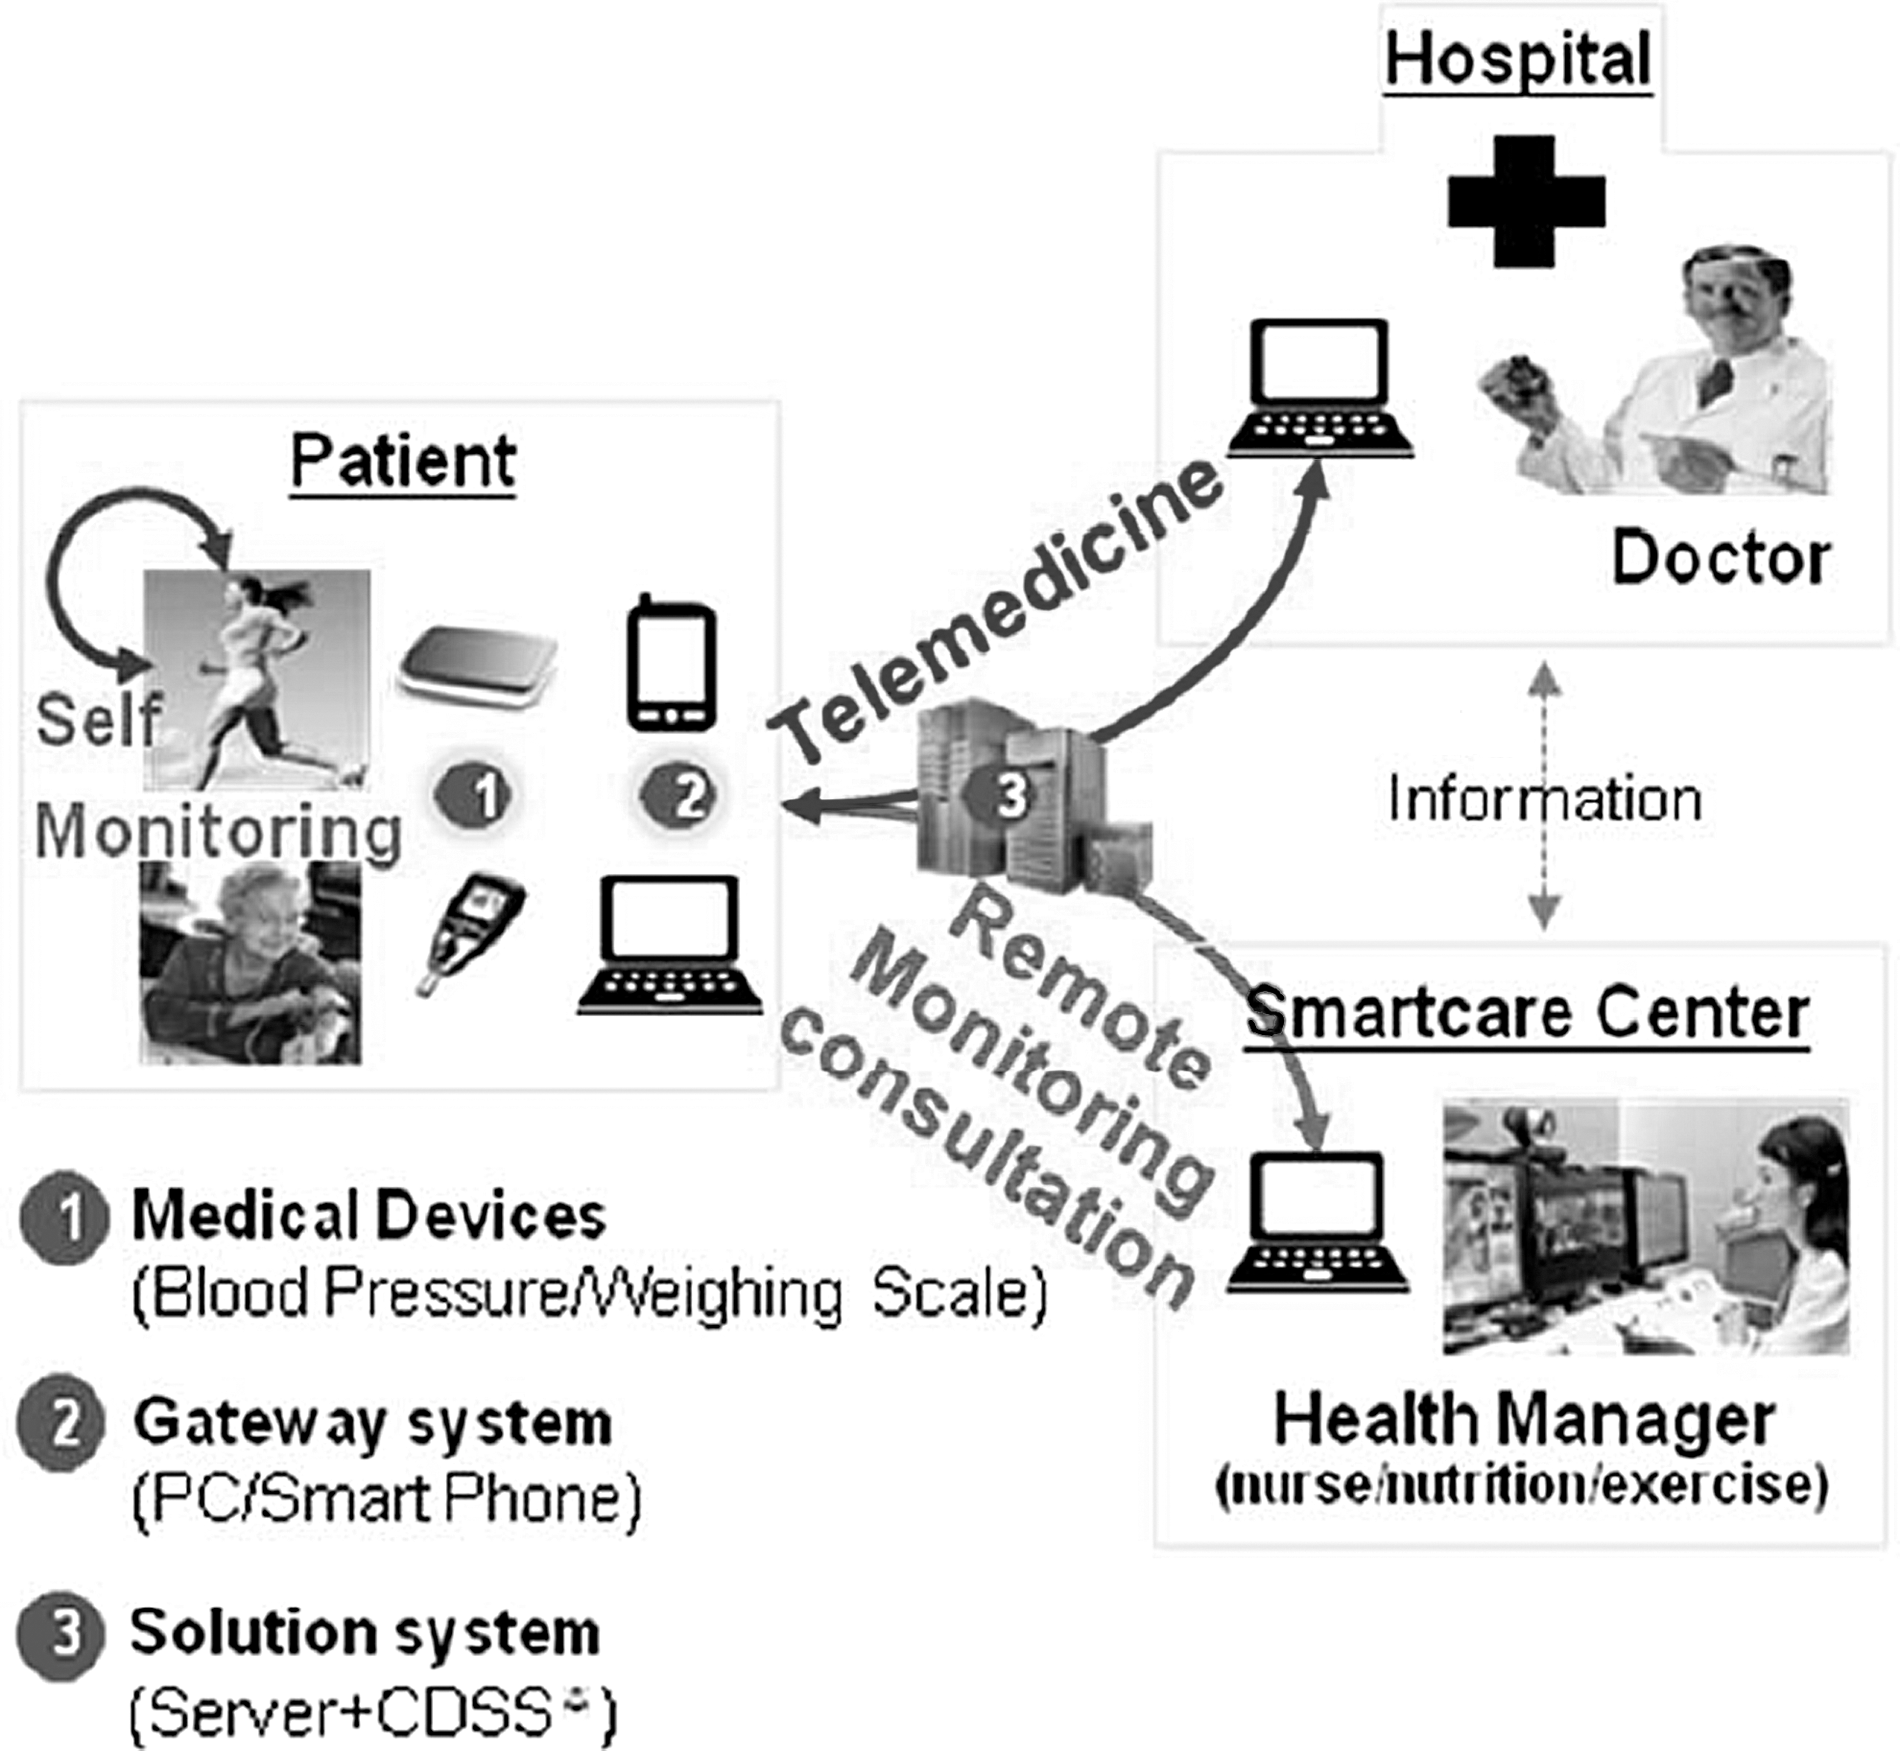
Model of SmartCare services. CDSS, clinical decision support system; PC, personal computer.
Based on the accumulated data and CDSS result reports, health managers in the SmartCare center provided participants with telemonitoring and consultation services according to the prescribed manual. The services provided to participants included the accumulated information of the measurement results through real-time monitoring, as well as a health consultation using telephone and video telephone (once a week), providing health information using messages or e-mail (once a week), providing the health promotion program with a health status survey, progress management, and status evaluation (once a month), and sending a personalized health report (once a month) (Table 1).
SmartCare Center Services
All subjects who received the SmartCare service are patients with hypertension so they visited the hospital at least once every 2 months, consulted a doctor, and were prescribed with hypertension medicine. When participants visited the hospital, doctors gave treatments based on the records of the SmartCare system. Participants received telemonitoring and consulting services of the SmartCare Center regularly, except when they saw the doctor and got a prescription for hypertension medicine once every 2 months.
Data Collection and Analysis Method
Based on the assumption that the more the group uses the SmartCare service, the greater the effect, data collection and analysis were performed as follows: 1. The collected data were analyzed using the Statistical Package for the Social Science (SPSS) WIN version 19.0 program (SPSS, Inc., Chicago, IL). 2. Evaluation groups were classified depending on the level of measurement frequency. The number of monthly measurements was calculated by summing the number of daily measurements stored in the SmartCare system. This was classified into three groups according to the monthly average measurement frequency for 6 months: Low (<29 times/month), Middle (30–49 times/month), and High (≥50 times/month). 3. Evaluation indices were the SBP, DBP, weight, and BMI of hypertension patients. 4. Once the individual measures himself or herself with the BP device, the measurement data (SBP and DBP evaluation indices) are transmitted to the netbook through Bluetooth® (Bluetooth SIG, Kirkland, WA) and transmitted via the Internet from the netbook to the SmartCare server. 5. When weight was measured using weight scales equipped with a Bluetooth function and data were transmitted to the netbook, which in turn were transmitted to the SmartCare server via the Internet, the BMI was automatically saved in the SmartCare system after dividing the transmitted mass by the square of their height (in mass/height
2
). 6. The service time provided to patients by each counselor was calculated as the monthly average time of the service provided for the 6-month service period by analyzing the computer telephony integration's server logs. 7. The chi-squared test was performed for the general demographic characteristics to identify the difference between technical analysis and measurement level groups. 8. Analysis of variance was performed to test for any difference between measurement level groups and service time provided to participants by each counselor. 9. In analyzing the measurement evaluation indices, the differences in monthly average between the initial baseline (Month 1) and end point (Month 6) were analyzed within each group with the paired t test. The differences in the monthly average between the initial baseline (Month 1) and end point (Month 6) were compared and analyzed between groups with analysis of covariance. Covariance was adjusted for ages that showed differences in demographic characteristics and the initial baseline. 10. A power analysis was conducted using G power software ( 11. All significance levels were analyzed based on a Cronbach's alpha value of 0.05.
Results
General Participant Characteristics
In total, 231 people were enrolled in the SmartCare service, and the final analysis was conducted with 213 patients who completed all BP measurements for 6 months (Table 2). Cross-analysis was performed for measurement frequency levels (Low, Middle, and High) by gender, age, and hospital. No statistically significant difference was found in gender and hospital; however, a statistically significant difference in ages was shown in the Low Group (<60 years for 48 participants [72%] and ≥60 years for 19 participants [28%]), in the Middle Group (<60 years for 44 participants [60%] and ≥60 years for 29 participants [40%]), and in the High Group (<60 years for 27 participants [37%] and ≥60 years for 46 participants [63%]).
Patient Characteristics
Data are number (%).
Consulting Time by Smartcare Service
The average consulting times that health managers provided to participants with the SmartCare service are shown in Table 3. No statistically significant difference was found in the monthly average hours for consultation provided by health managers. Participants received equal consulting time from health managers.
SmartCare Consulting Hours
Data are mean±standard deviation values.
BP, blood pressure.
Changes in Participants' Measurement Levels
The monthly average measurements as per the participants' evaluation measurement level group are shown in Table 4.
Changes in Criteria over 6 Months
Data are mean±standard deviation values.
BMI, body mass index; BP, blood pressure; DBP, diastolic blood pressure; SBP, systolic blood pressure.
SBP showed a decrease in the Middle and High Groups over the 6 months, whereas DBP showed a slight decrease in the Low and High Groups (Fig. 2). Weight and BMI slightly increased in the Low Group and slightly decreased in the Middle and High Groups over the 6 months (Fig. 3).
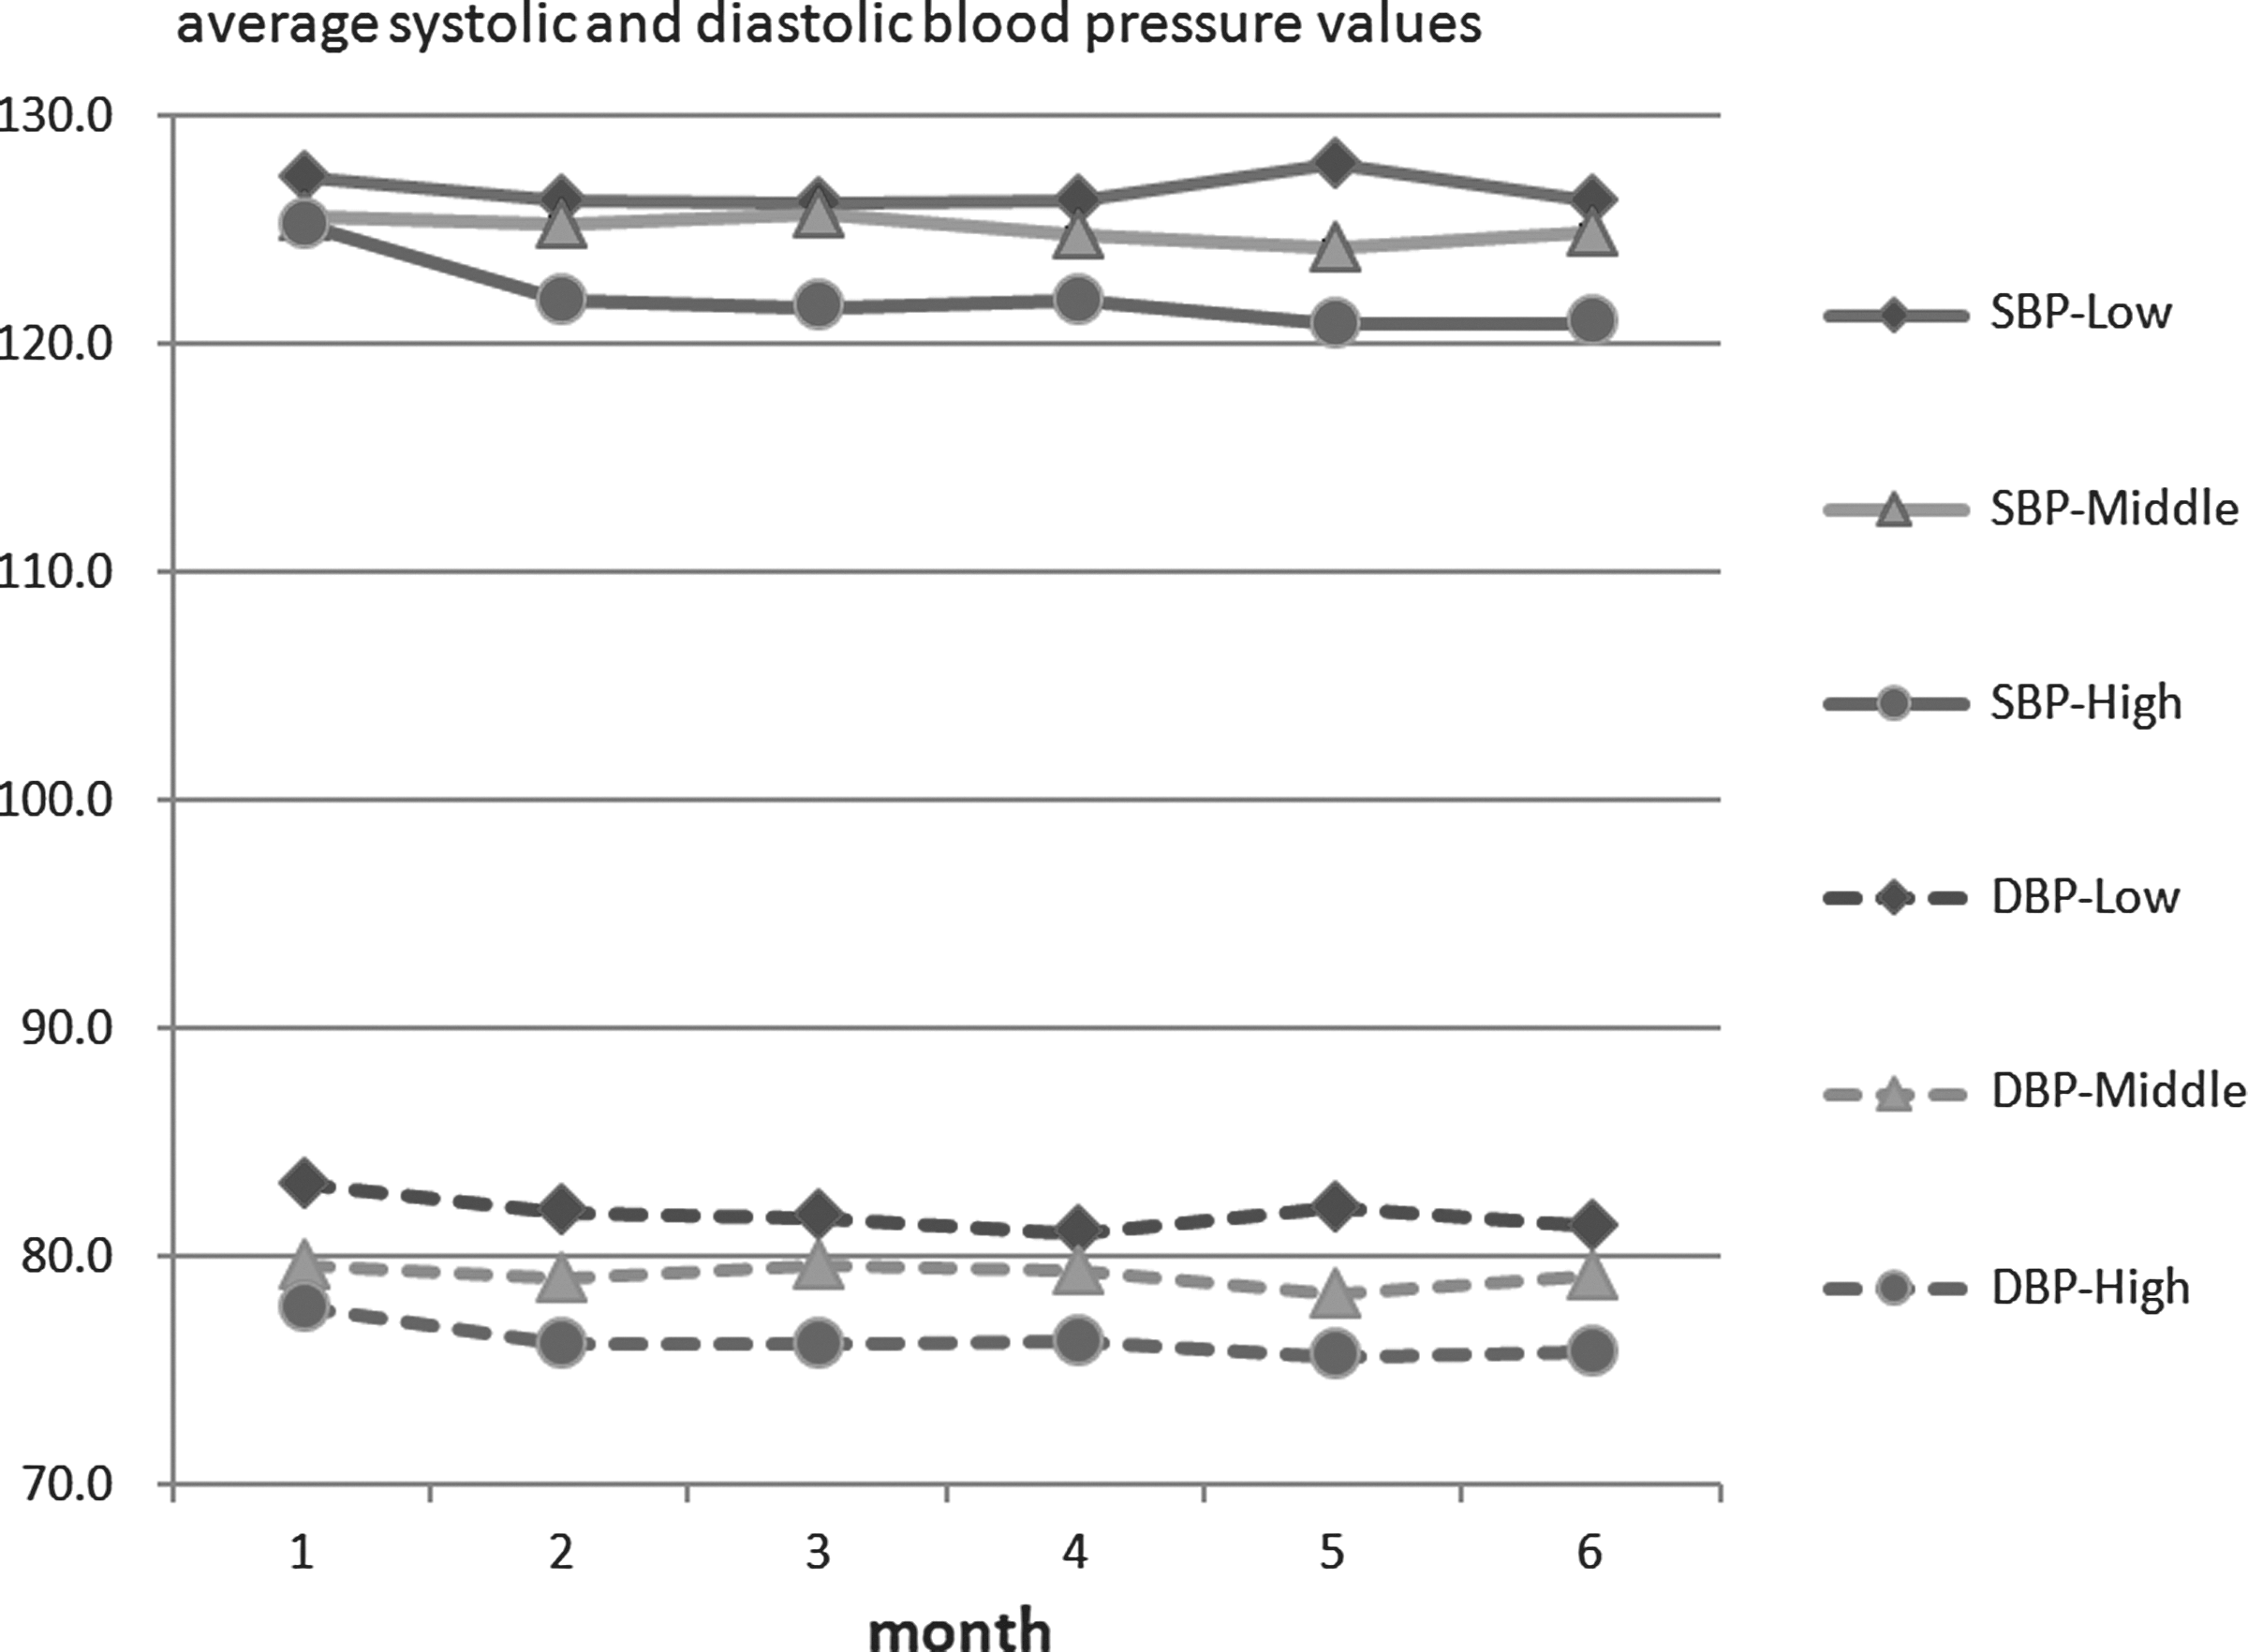
Changes in systolic and diastolic blood pressure (SBP and DBP, respectively) during a 6-month period.
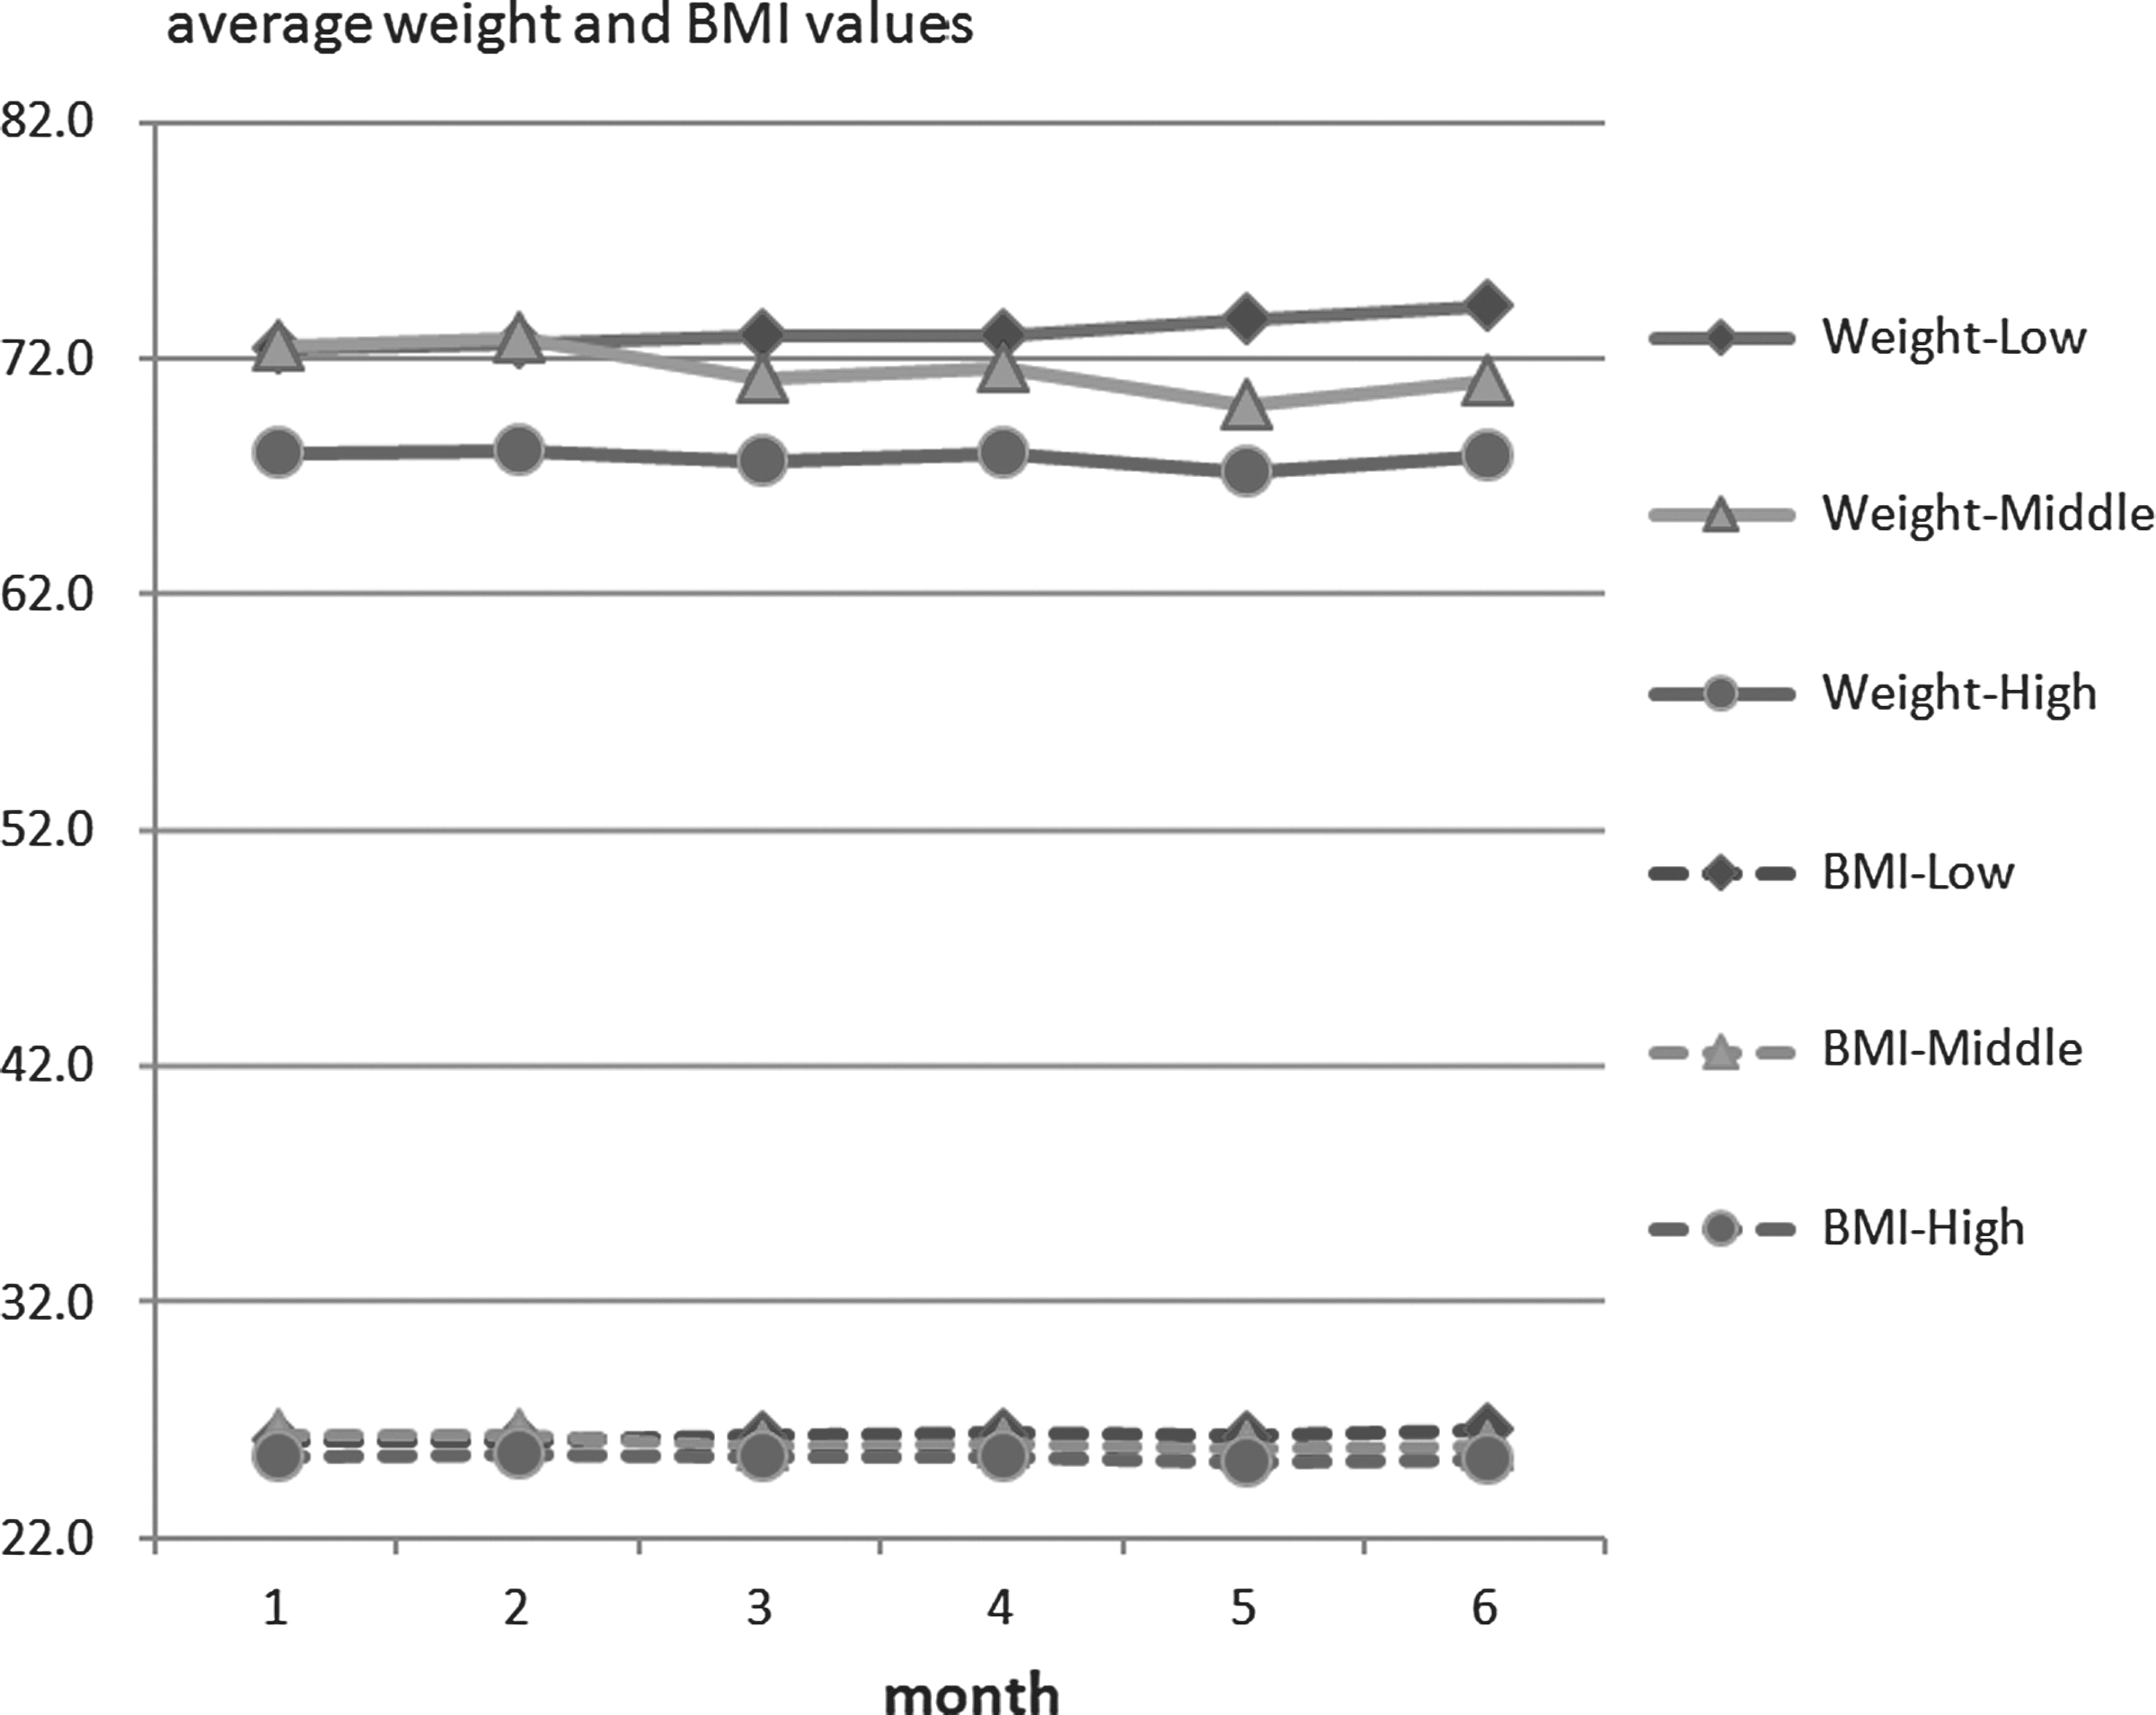
Changes in weight and body mass index (BMI) during a 6-month period.
The monthly average changes over 6 months are shown in Table 5 based on the baseline as per the measurement frequency level. After the monthly average changes within the group were analyzed, the Low Group showed a slight decrease in SBP and DBP and a slight increase in weight and BMI; however, not all of the average changes at the end point (Month 5) were statistically significant. In the Middle Group, SBP, DBP, weight, and BMI were somewhat decreased, and only weight and BMI showed statistically significant difference in the average changes at the end point (Month 5) (p<0.05). In the High Group, SBP, DBP, weight, and BMI decreased and also showed statistically significant differences in changes at the end point (Month 5) (p<0.05).
Monthly Average Changes in Measurement Frequency Level
BMI, body mass index; BP, blood pressure; DBP, diastolic blood pressure; M1, baseline versus 2 months; M2, baseline versus 3 months; M3, baseline versus 4 months; M4, baseline versus 5 months; M5, baseline versus 6 months; SBP, systolic blood pressure; SD, standard deviation.
The difference between groups for changes at the end point (Month 5) was statistically significant for SBP, weight, and BMI (p<0.05) but not for DBP.
Discussion
Home telemonitoring is effective in hypertension control and overtreatment. 15 Recent studies have focused on patient education, self-monitoring, and intervention by nurses or pharmacists to achieve the control goal by reducing BP. 16,17 Most previous studies have been comparative studies between the control group and test group. Until now, no study has analyzed the difference in effect on the disease depending on the measurement frequency of participants who received the service.
In this study, health managers provided the telemonitoring and consultation service, and there was no difference in the total service time provided to patients. The SmartCare system provided health information according to the CDSS algorithm based on the transmitted data to health managers and participants. 14 Participants of the SmartCare service received the management schedules that were appropriate for their health characteristics from health managers at the commencement of the service. The monitoring and consultation services provided by the nurses were to check participants' BP and drug compliance and to provide information on the overall health status and BP. The nutritionists monitored the diet diaries of patients that were transmitted to the SmartCare system and provided consultation on menu composition appropriate for patients with hypertension. The exercise prescribers monitored the exercise records that were transmitted to the SmartCare system and provided consultation on exercise suitable for hypertension patients. Excluding exceptional emergency cases, patients were to visit the corresponding hospitals every 2 months to receive outpatient care.
According to a recent theory, the basic mechanism to improve BP control via home BP monitoring involves compliance with drug therapy. 17 A higher frequency of BP measurements by patients who have hypertension could mean that they comply more strictly with professional guidelines for taking drugs, diet control, and exercise control.
The SmartCare model in South Korea provided patients with a professional consultation service via teleconferences. This study's purpose was to reduce the frequency of unnecessary hospital visits and to identify the effect on disease improvement. The study's results can support the recent theory that the basic mechanism to improve BP control with home BP monitoring involves compliance with drug therapy. 18
Because most participants were old, some had difficulty using the devices. When patients could not operate the devices after the initial installation and education or when the Internet was unavailable, installation and education were performed again through revisits. In some cases, some participants lost or had trouble with their devices, causing interruption of BP measurements and resulting in new devices being provided. Some participants asked for additional devices to enable them to measure BP during extended travel or while in their workplaces, but they were advised that the experiment was limited to home measurement only.
This study had several limitations; therefore, further analysis, using larger sample sizes, is needed regarding drug compliance and its effect on BP control, as well as the specific content of the consultations by health managers.
Conclusions
The purpose of this study is to confirm the improvement effect of SBP, DBP, weight, and BMI based on the self-measurement compliance of patients with hypertension using the SmartCare service. In this study, the monthly average BP decreased more in the High Group than in the Low and Middle Groups (Month 5, High>Low>Middle), and the SBP showed statistically significant differences between groups. The average weight and BMI also showed an increase in the Low Group but a decrease in the Middle and High Groups, and the difference between groups was statistically significant (Month 5, Middle>High>Low).
In conclusion, patients who received the SmartCare services with higher measurement frequency levels at home showed greater effectiveness regarding the provided services compared with those patients with lower levels of BP, weight, and BMI control.
Footnotes
Acknowledgments
This study was supported by a research grant (1003518) from the Ministry of Trade, Industry and Energy of South Korea in 2010.
Disclosure Statement
C.-H.L. is an employee of LG Electronics. B.-Y.C. declares no competing financial interests exist.