




Abstract
Introduction
Recent advances in mobile technology represent a valuable opportunity for general practitioners and other health professionals to develop new screening tools for the measurement of visual acuity (VA) that are accessible, portable, and reliable and that can combine multiple tests within a single device. 1 VA is a vital indicator of visual function and an important measure taken in variable contexts such as school screening, occupational testing, and driver licensing.
There are several types of visual charts available, each with its advantages and disadvantages. 2 –5 Accurate assessment of VA critically depends on a range of factors such as viewing distance, chart illumination, the type of VA chart used, and the scoring technique used. 1 Due to these limitations, rapid developments of software applications to measure VA have been achieved using highly portable devices such as the Apple (Cupertino, CA) iPad®. Many software applications (apps) in ophthalmology departments are available from the App Store (Apple, Inc.), but only a few have been through a pilot trial to test its accuracy or reliability compared with traditional methods of measuring VA. 6 Also, previous studies used the iPad directly as a VA chart, but the glossy screen of the device is highly susceptible to glare, resulting in poorer VA. 1
We developed an app (mirroring chart; App Store) that used the mirroring technique to avoid susceptibility to glare, to randomize letters or optotypes to prevent chart learning, and to adjust stimulus size to accommodate the available viewing distance. The aim of this study was to assess whether measurements of distance VA using this app were in agreement with standard clinical tests of VA in adults with normal vision.
Materials and Methods
Participants
Forty-three participants (average age, 30 years; range, 25–45 years) took part in the VA measurements. Of the 43 participants, 26 were aided with eyeglasses, and 17 were unaided (22 men, 21 women). Exclusion criteria were VA worse than 20/25 measured using the Early Treatment of Diabetic Retinopathy Study (ETDRS) chart and any self-reported history of ocular pathology. The study was approved by the Chungbuk National University Human Ethics Committee. All participants provided full, written informed consent, and all study protocols were in accordance with the Declaration of Helsinki.
Apparatus and Test Environment
VA was measured using a third-generation Apple iPad (iPad Retina Display) and an ETDRS letter chart. The iPad (screen size, 9.7 inches; screen resolution, 2048 × 1536 pixels) was set to maximum brightness in the display settings throughout all testing procedures. The software we developed allows for the iPad to be used as a remote control/response device via a wired connection or wireless WiFi dongle (Kivic Inc., Seongnam, Gyeonggi, Korea) with a liquid crystal display (LCD) computer monitor with a matte surface screen (18 inches; 1280 × 1024 pixels) (Fig. 1).

Example of checking visual acuity by the mirroring technique.
Our VA app contains a Snellen chart, a Tumbling E chart, a Landolt C chart, and a VA chart consisting of Arabic figures, which were designed according to the International Organization for Standardization guidelines (Fig. 2). Alphabet letters and Arabic figures were categorized by cognoscibility as easy (7, 4; O, U, C, V, Z), moderate (3, 5, 2; D, P, S), and difficult (6, 9, 8; N, E, F, H, R) and presented in a random method to prevent chart memory. 7
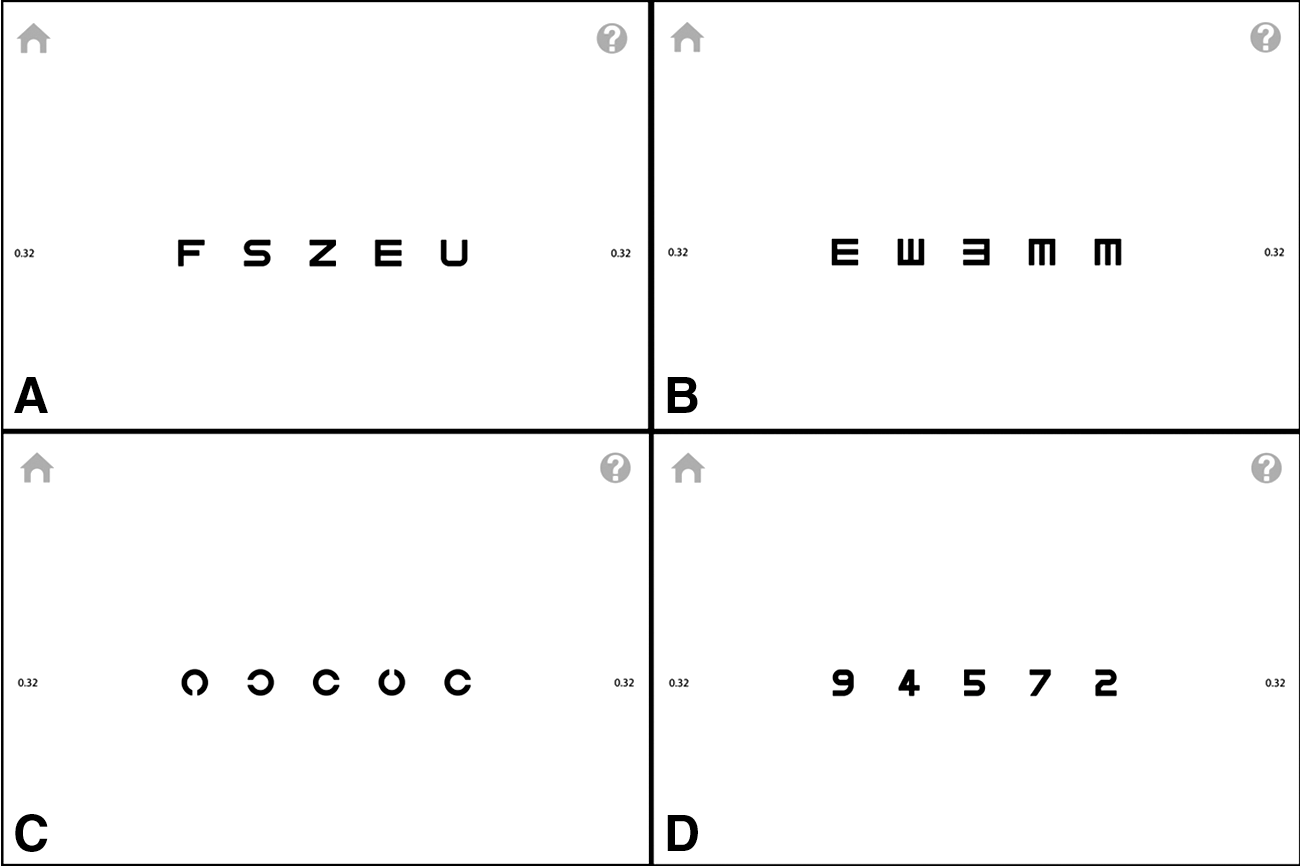
Examples of the visual acuity charts inside the mirroring chart application:
A full 4-m lane (charts were viewed directly, not by reflection) was used to measure VA by the ETDRS chart and app charts. The test room was lit by fluorescent tubes (FEELUX T4-HE18W65; FEELUX Co., Ltd., Yangju, Gyeonggi, Korea) that gave a quoted color temperature of 6,500 K and had a color-rendering index of 98 (to stimulate daylight). 1
Procedure
The VA was first measured by the printed externally illuminated ETDRS chart. Then VA was measured by the app presented on the monitor shown in the following order: Snellen chart, Tumbling E chart, Landolt C chart, and Arabic figure chart. After a 10-min interval, VA was retested with each chart in the same order. Measurements were both made with habitual eyeglasses correction in place and then were repeated 1 day later with +1.00 and +2.00 diopter (D) of optical defocus added to the participant's habitual correction using a trial frame.
For all measurements, the participants were tested by one of the three experienced VA testers (S.R., H.J.L., or J.-h.K.). We encouraged the subjects to try their maximum effort to see as clearly as possible without hurrying them. For each test we started from the first line until no more letters could be discerned. VA was recorded if the patient could read three or more letters of each line. Testing was always conducted in the standard clinical order of right eye, then left eye. Results were recorded in logMAR units (log minutes of arc).
Statistics
For data analysis, SPSS statistical software (version 14.0K; SPSS Inc., Chicago, IL) and Medcalc software (version 14.8.1; Medcalc Software bvba, Ostend, Belgium) was used. The Snellen VA results from the four charts in the app were converted to logMAR VA for comparison with the ETDRS chart VA: logMAR VA = log(1/Snellen VA). Repeatability and agreement between the VA chart were assessed using the Bland–Altman method with 95% limits of agreement (LOA), which correspond to ± 1.96 standard deviation (SD) of the differences between tests. The difference between the scores for each test was calculated for each subject. The distribution of these differences was described by calculating the mean, SD, and the 95% LOA. The breadth of those LOA indicates the repeatability of the test. The narrower the LOA, the more repeatable the test. 8 The repeatability of each VA charts was compared by using paired t test. A value of p < 0.05 was considered statistically significant.
Results
In total, 86 eyes of 43 consecutive participants who had Snellen VA better or equal to 0.8 in both eyes with or without eyeglasses were evaluated. The average spherical equivalent was –2.06 ± 2.52 D for the right eye and –1.98 ± 2.46 D for the left. The mean logMAR VA from each chart is shown in Table 1. The logMAR VA showed no significant difference between the ETDRS chart and the iPad Snellen chart (p = 0.66) and iPad Arabic figure chart (p = 0.29). The logMAR VA of the ETDRS chart was significantly better than that of the iPad Tumbling E chart (p < 0.01) or iPad Landolt C chart (p < 0.01) (Table 2).
Scores of Visual Acuity in Multiple Visual Acuity Charts (n = 86 Eyes)
Data are mean ± standard deviation values.
D, diopter; ETDRS, Early Treatment of Diabetic Retinopathy Study; logMAR, log minutes of arc; sph, spherical; VA, visual acuity.
Mean Bias and 95% Limits of Agreement for Each of the Four Test Pairs in Log Minutes of Arc
These data are presented graphically in Figure 2.
CI, confidence interval; ETDRS, Early Treatment of Diabetic Retinopathy Study.
Bland–Altman analysis revealed a mean difference (bias) with 95% LOA as follows: 0.004 logMAR units (95% LOA, –0.02 to 0.02) between the VA results from the ETDRS chart and the iPad Snellen chart (Fig. 3A), –0.03 logMAR units (95% LOA, –0.05 to –0.01) between the ETDRS chart and the iPad Tumbling E chart (Fig. 3B), 0.04 logMAR units (95% LOA, 0.02 to 0.06) between the ETDRS chart and the iPad Landolt C chart (Fig. 3C), and –0.01 logMAR units (95% LOA, –0.03 to 0.01) between the ETDRS chart and the iPad Arabic figure chart (Fig. 3D).
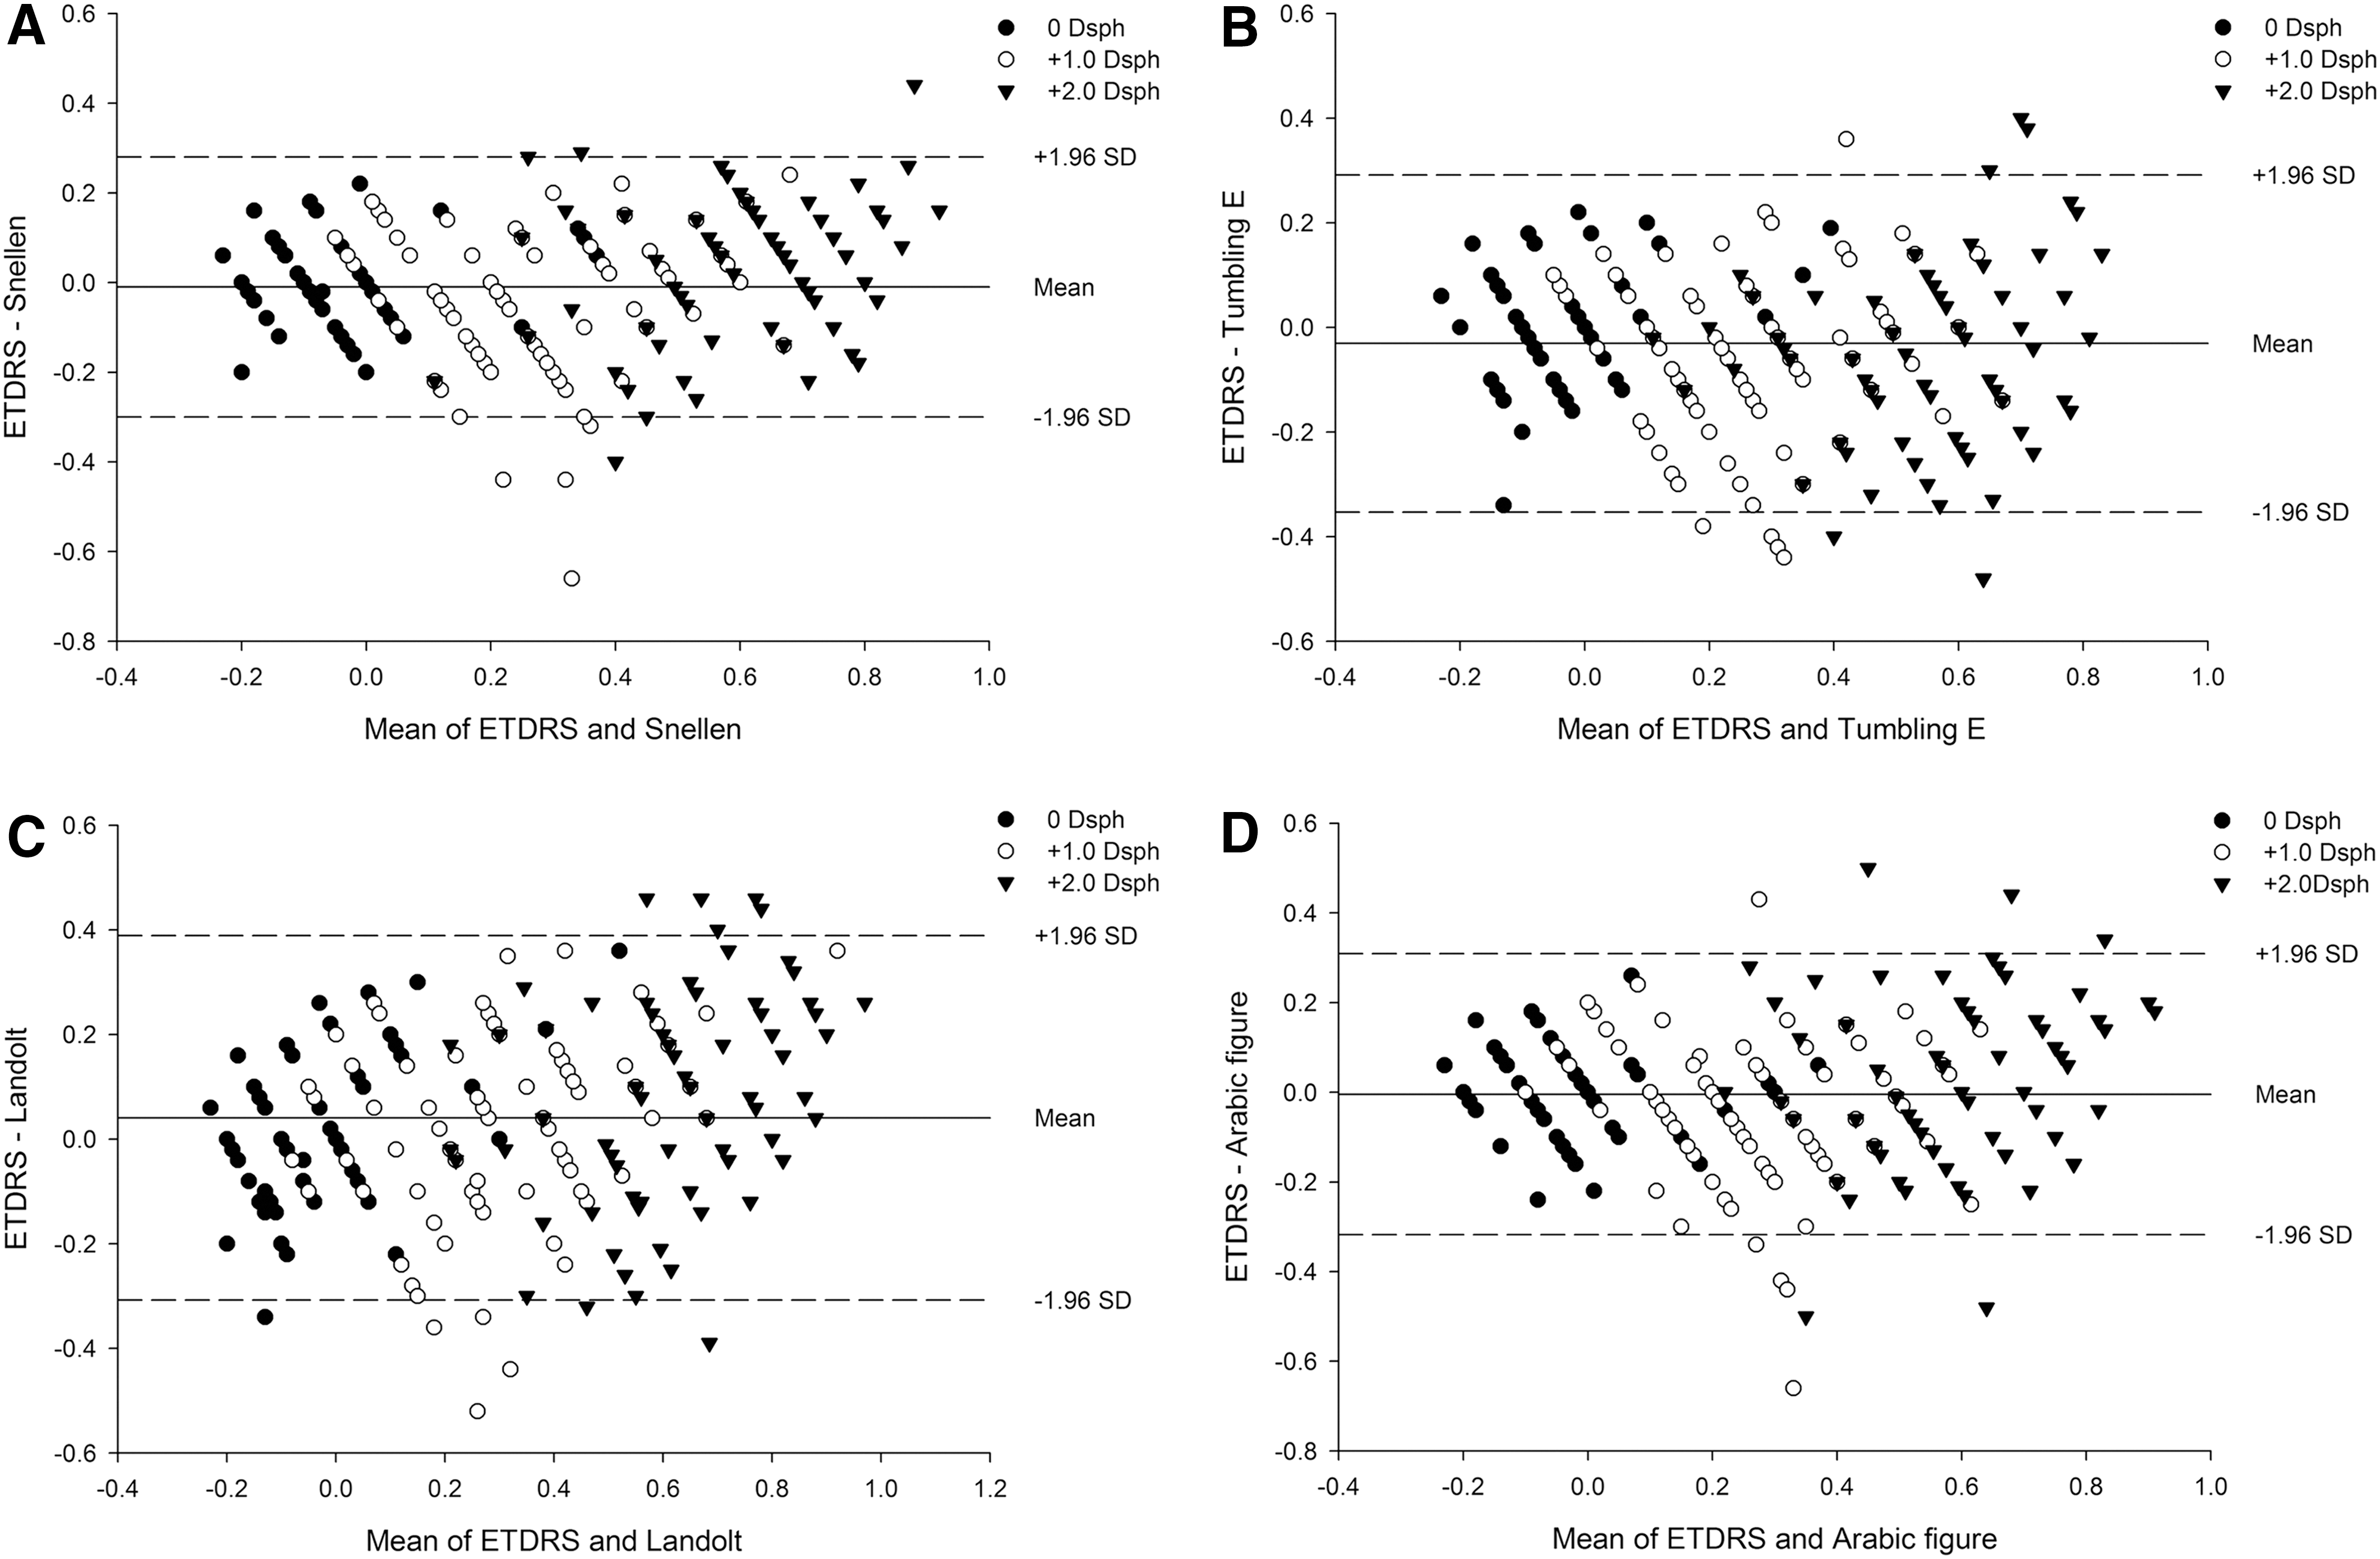
Bland–Altman plot of the difference versus average for the log minutes of arc visual acuity from the Early Treatment of Diabetic Retinopathy Study (ETDRS) chart versus the mirroring chart application:
The logMAR VA of each chart at 0 and 10 min is shown in Table 3. The subjects showed no chart letter memory of the ETDRS chart (p < 0.05), iPad Snellen chart (p = 0.62), and iPad Arabic figure chart (p = 0.12). The logMAR VA of the Tumbling E chart (p = 0.03) and Landolt C chart (p = 0.001) was significantly better at 10 min.
Scores for the First and Second Administration of Each Visual Acuity Test (n = 86 Eyes)
Data are mean ± standard deviation values.
ETDRS, Early Treatment of Diabetic Retinopathy Study.
Kappa scores were typically calculated for the agreement between tests measured on categorized variables with an ordinal or a nominal scale. VA is a continuous variable with a step of 0.02 in the ETDRS chart and 0.1 in the other charts. Therefore we calculated the interclass correlation among the different VA charts (Table 4).
Interclass Correlation Calculation for Each of the Four Test Pairs
ETDRS, Early Treatment of Diabetic Retinopathy Study; ICC, interclass correlation calculation.
Discussion
Screen mirroring is a feature that allows one to mirror a smartphone or other compatible mobile device's screen onto another monitor screen with or without a wired connection. This feature allows one to use a bigger screen instead of the device's smaller screen for showing contents.
Although various kinds of apps for ophthalmology are available, 9,10 there are few studies comparing the conventional VA charts and app VA charts. 1,6 However, in these studies, the iPad was used directly as a VA chart, and problems such as not being able to adjust the brightness of the iPad precisely or acuity measurements made using the iPad being highly susceptible to glare were discovered. 1,6 To prevent this kind of limitations, we used the mirroring technique to display our VA charts on the conventional LCD computer monitor. We can customize the optotype size according to the monitor size and lane distance so this app can be used in small areas and any size LCD monitors. Although we used the iPad as the remote to change the VA chart optotypes, an Apple iPhone® also can be used instead if the software version is higher than iOS 7.0. This makes our app more portable and cost-effective to conduct mass VA screening.
The two basic types of measures are recognition acuity (i.e., reading letters), including Snellen charts and the ETDRS chart, and resolution acuity (i.e., detecting a gap in a ring), including the Landolt C chart and the Tumbling E chart. 11 Our results showed that the Snellen chart and the Arabic figure chart VA have significant agreement with the conventional ETDRS chart. The resolution acuity from the iPad Landolt C and the Tumbling E charts were lower than the VA from the ETDRS chart. Although there are several studies showing that resolution acuity is lower than recognition acuity in low vision subjects, 11,12 our subjects had normal vision so we could not ascertain why the ETDRS chart produced better scores than the Landolt C or Tumbling E chart. Further studies also including low vision subjects may clarify the difference.
It has been shown that significant memory of a chart letter subset can be passively acquired after a single VA measurement. 13 The incidental memory of chart letters, which is acquired during a routine eye examination involving several references to the same chart, has also been shown to last for up to 10 days. 13 In order to prevent this kind of chart learning, our app presents each optotype in a randomized method. We also categorized alphabet letters and Arabic figures by cognoscibility so the optotypes were presented in a similar level of difficulty. Our results showed that the Snellen chart and the Arabic figure chart had no learning effect. However, the Landolt C and Tumbling E charts showed better VA when tested 10 min later. This may be due to the lack of variety of optotypes compared with the Snellen or Arabic figure chart. Further studies are also needed to verify this difference.
This present study has some limitations. The ETDRS chart was a printed, externally illuminated chart, whereas the iPad charts were shown on a monitor. The reading scales of the two kinds of charts were not identical. Visual charts with Snellen notations were compared in this study. However, our study is the first to compare the ETDRS chart with app VA charts that are shown on a LCD computer monitor by the mirroring technique.
In conclusion, the Snellen chart and Arabic figure chart in our app showed significant agreement with the conventional ETDRS chart and revealed no chart memory. We recommend our VA app in clinical practice and in iPhone- or iPad-owning families. One of the most important goals of our study is to encourage the development of self-testing visual fields and, more important, the testing of macular function with an Amsler grid chart. This type of self-testing could be an important component of monitoring for patients at risk for age-related macular degeneration. We are currently developing an Amsler grid chart compatible with iPhones and iPads, and further studies with a larger number of subjects including low vision and pediatric patients are currently underway to compare the usefulness of our app with conventional VA charts.
Footnotes
Acknowledgments
This study was supported by grant NRF-2014R1A1A2A16051562 to J.K. from the National Research Foundation of Korea (
Disclosure Statement
No competing financial interests exist.