
Abstract
Introduction
The past 30 years have given rise to considerable accomplishments in the field of behavioral health. These accomplishments include the development of numerous evidence-based psychological treatments for various mental health conditions, particularly depressive and anxiety disorders. However, consumers of mental health treatment rarely receive these interventions as they were intended, if at all 1 ; for example, in 2010, an estimated 5.2 million American adults in need of mental health treatment did not receive any in the past year. 2 This science-to-service gap arises from the high cost of transitioning a treatment from the research lab to community settings, the dearth of mental health providers trained in evidence-based treatment, and the cost and logistics involved with maintaining treatment fidelity among treatment providers. 3,4
In recent years, computerized psychotherapy (CP), which involves self-directed learning of therapeutic concepts and skills through online or other technological platforms, has gained recognition as one potential solution to the rift between evidence-based therapies and community practice. 5 –8 CP programs can be easily distributed to anyone with a computer and/or Internet connection, remain at absolute fidelity to their underlying treatment models, do not tire or burnout, can be easily updated and redisseminated as new findings emerge, and can be accessed at places and times convenient for consumers. In this way, CP is analogous to psychotropic medication in that its initial development and testing can result in swift marketing to a widespread consumer base with minimal cost to the developer. However, CP may ultimately surpass medication in terms of cost-effectiveness. When comparing the cost of CP for depression with the cost of antidepressant medication, the National Institute for Health and Clinical Excellence estimated a savings of $2,000–$16,000 per client in costs due to sickness, disability, and lost income. 9,10
The advantages to CP are numerous, and, encouragingly, there is mounting evidence that CP can reduce symptomatic distress across a wide variety of disorders. Specifically, CP, most commonly in the form of computerized cognitive behavioral therapy (cCBT), has been tested among various behavioral disorders such as anxiety, 10,11 depression, 12 and addictive behaviors. 13 –15 To date, 10 meta-analyses have been published indicating the feasibility, acceptability, and efficacy of CP. 6 –8,12,16 –21
However, researchers cannot assume that treatment effects demonstrated in controlled trials with carefully selected participants will generalize to the larger, more complex population to which treatments may ultimately be disseminated, 22 and this is particularly troublesome given the ease of dissemination of cCBT. Along those lines, recent research has criticized the treatment utility of cCBT for depression, noting that cCBT does not produce long-term maintenance of treatment gains and demonstrates considerably high dropout rates. 23 Furthermore, innovative meta-analyses of randomized controlled trials (RCTs) of various psychotherapies for posttraumatic stress disorder 24 and cognitive behavioral therapy for depression, generalized anxiety disorder, and panic disorder 25 reported significant relationships between indices of participant exclusion and treatment outcome, such that studies using a greater number of exclusion criteria or excluding higher percentages of potential participants report larger treatment effects. However, researchers have yet to assess the relationship between participant exclusion and treatment outcome in the body of RCTs that compose the primary “evidence base” for CP, and hence the potential performance of CP in nonresearch settings.
In this study, we present a multidimensional meta-analysis of RCTs of CP for anxiety and depression, with the goal of describing a range of indices that bear on efficacy and generalizability. More specifically, we analyzed RCTs of cCBT for major depression, social anxiety disorder, generalized anxiety disorder, and panic disorder, published through August 2014, in order (1) to update the CP meta-analysis literature and to report previously unanalyzed treatment outcome variables related to clinically significant change, (2) to enumerate common exclusionary criteria for online treatments, and (3) to quantify the relationship between two indices of participant exclusion (number of exclusion criteria and exclusion rate) and both treatment acceptability and treatment outcome variables, using similar methodology to that of previous multidimensional meta-analyses. 24,25
Materials and Methods
Search Strategy and Inclusion Criteria
The search strategy and inclusion criteria of the current study replicated those of a previous meta-analysis of cCBT for depression, social phobia, panic disorder, and generalized anxiety disorder, which included RCTs published through December 2010. 17 In order to update the CP meta-analysis literature, we additionally reviewed studies published between January 2010 and August 2014. To identify studies published in that interval, we searched PubMed, the Cochrane Database of Systematic Reviews and Register for Controlled Trials, Cinahl, PsycINFO, the Social Sciences Citation Index, and EMBASE by combining terms indicative of computerization (e.g., “Internet”), and anxiety and depressive disorders (e.g., “depression”). We retained RCTs of cCBT if they were (1) written in English, (2) included a no-treatment control condition (placebo or waitlist), (3) enrolled adult participants, and (4) established Diagnostic and Statistical Manual of Mental Disorders diagnoses through a structured clinical interview.
Our search strategy retrieved 854 studies. We excluded 683 studies based on the title, 88 based on the abstract, and a further 66 based on an examination of the full text article. Seventeen studies were retained for analysis, which yielded a total sample of 36 studies 26 –61 when combined with 19 studies from Andrews et al. 17 Retrieved studies were commonly excluded for not having randomized controlled designs, for testing computerized interventions that were not based on a cognitive behavioral therapy model or did not target anxiety or depression, and for not establishing diagnoses through a structured clinical interview.
G.G.Z. and H.K.L. independently collected target information from each study and subsequently reconciled discrepancies by consensus. C.R.W., G.G.Z., and H.K.L. met weekly to adjudicate any unresolved discrepancies.
Predictor Variables
We used two indices of participant exclusion: the exclusion rate and the number of exclusionary criteria applied during the screening process. Exclusion rate was calculated using the number of participants excluded divided by the number of participants who completed applications to participate. Participants who did not return or complete applications were omitted from the calculation. Exclusion criteria were counted using a similar approach to a recent meta-analysis of psychotherapy for posttraumatic stress disorder 24 : ambiguous exclusion criteria (e.g., “better suited to a different program”) were counted as 2, and separate exclusion criteria pertaining to a general theme of exclusion (e.g., “alcohol use” and “drug use”) were counted as 1.
Outcome Variables
To capture the full range of outcomes for each study, we collected both treatment acceptability and treatment outcome information. Treatment acceptability variables included study completion rate and treatment completion rate. Study completion rate was defined as the number of participants who completed posttreatment measures, divided by the study's intention-to-treat sample size. Treatment completion rate was defined as the number of participants who completed all treatment sessions divided by the study's intention-to-treat sample size.
Treatment outcome variables included effect sizes, proportion reporting clinically significant change in the treatment group, and the relative probability of clinically significant change in the treatment versus the control group. Only data from primary symptom measures were reviewed.
Effect sizes were calculated using Hedges' g. We calculated both between-group effect sizes, which compare treatment with control groups at posttreatment, and within-group effect sizes, which compare pre- and posttreatment symptomatology in the treatment group only. If studies used multiple primary symptom measures, we computed an average effect size.
The proportion reporting clinically significant change within the treatment group was calculated by dividing the number of treatment group participants classified as clinically changed by the intention-to-treat sample size. If studies reported multiple definitions of clinically significant change, we computed an average proportion changed.
Relative probability of clinically significant change in the treatment versus the control group was computed by dividing the average proportion clinically changed in the treatment group by the average proportion clinically changed in the control group. This outcome describes how many times more likely a participant in the treatment group was to be classified as clinically changed compared with a participant in the control group.
Analytic Plan
If studies included two cCBT treatment groups, outcome variables were calculated separately for each treatment group in relation to the control group and were analyzed as separate cases. This approach captured the variability in outcomes that could be associated with specific methodologies of participant exclusion. Eight studies in our sample included two cCBT treatment groups, which resulted in 44 analyzable cases. The values for n reported in Results refer to either the number of studies or the number of cases, depending on the nature of the analysis.
Following Andrews et al., 17 random effects modeling was used to pool treatment outcome variables across studies. Random effects analyses were performed in R software according to an established method. 62,63 Proportions clinically changed in the treatment group and relative probabilities of clinically significant change in the treatment versus control group were transformed with variance stabilizing functions prior to being pooled in random effects models. Pooled estimates were subsequently back-translated. The variation, or heterogeneity, of pooled effects across studies was assessed using the Q test and the I 2 statistic. 64 The Q test provides a binary indication of the presence of heterogeneity (yes or no), whereas the I 2 statistic describes the percentage of variability in outcomes that may be attributed to systematic factors rather than chance. Significant Q tests (p < 0.05) or I 2 statistics greater than 50% are generally taken as evidence of significant heterogeneity that may be explained by methodological diversity across studies (e.g., varying degrees of restrictiveness in the participant selection process). Finally, relationships between the predictor and outcome variables were assessed using Pearson's r.
Analyses were performed for all studies (n = 44 cases), depression studies (n = 15 cases), and anxiety studies (n = 27 cases). Studies investigating cCBT for co-occurring anxiety and depression (n = 2 cases) were only included in the “all studies” analyses; hence the number of cases included in the “all studies” analyses was greater than the sum of the cases included in the depression and anxiety subanalyses.
Results
Pooled Treatment Outcome Estimates
Table 1 displays random effects estimates for the four treatment outcome variables, with 95% confidence intervals.
Pooled Treatment Outcome Estimates from Random Effects Modeling
95% confidence intervals are given in parentheses. All estimates were significant at the p < 0.0001 level.
Heterogeneity of Treatment Outcomes
Q tests revealed significant heterogeneity (p < 0.05) in between-group effect sizes for anxiety studies and in proportions clinically changed in the treatment group in both all studies and anxiety studies. I 2 statistics revealed significant heterogeneity (I 2 ≥ 50%) in proportions clinically changed in the treatment group in both all studies and anxiety studies. The proportions clinically changed in the treatment group in both all studies and anxiety studies therefore demonstrated particularly strong evidence of heterogeneity with corroboration from both the Q test and the I 2 statistic, suggesting that these outcomes likely varied across studies in connection with a systematic methodological factor.
Participant Exclusion
The average numbers of exclusion criteria (range) for all studies, anxiety studies, and depression studies were 13.0 (4–24), 13.3 (7–17), and 12.0 (4–24), respectively. The average exclusion rates (and range) for all studies, anxiety studies, and depression studies were 0.49 (0.08–0.92), 0.50 (0.20–0.92), and 0.51 (0.32–0.75), respectively. Table 2 displays the prevalence of different criteria and themes of exclusion across studies. Risk for suicide was the most common reason for exclusion, followed by problematic alcohol and/or substance use.
Frequency of Exclusion Criteria Across Studies
Data are number (%).
Quotation marks indicate verbatim but undefined language.
Correlation Analyses
Due to the small number of studies in our sample, we consider these findings preliminary. Table 3 displays the correlations between the number of exclusion criteria and the exclusion rate with the treatment acceptability and outcome variables. Figure 1 depicts the strong, positive correlation found between the number of exclusion criteria and the proportion clinically changed in the treatment group for anxiety studies, in comparison with the null relationship between the same variables in depression studies. The regression line for anxiety studies suggests that each additional exclusion criterion was associated with an additional 4.8% of participants showing clinical improvement. The significant relationship in the all studies analysis between the number of exclusion criteria and the proportion clinically changed in the control group likely reflects the strong relationship of these two variables in anxiety studies combined with the “noise” of nonsignificant relationship between these two variables in depression studies. Separate analyses revealed that the number of exclusion criteria and exclusion rate were not significantly related to each other for all studies [r(40) = 0.10; 95% confidence interval, −0.21 to 0.39; p = 0.52], anxiety studies [r(25) = 0.16; 95% confidence interval, −0.23 to 0.51; p = 0.43], or depression studies [r(11) = 0.19; 95% confidence interval, −0.41 to 0.67; p = 0.54].
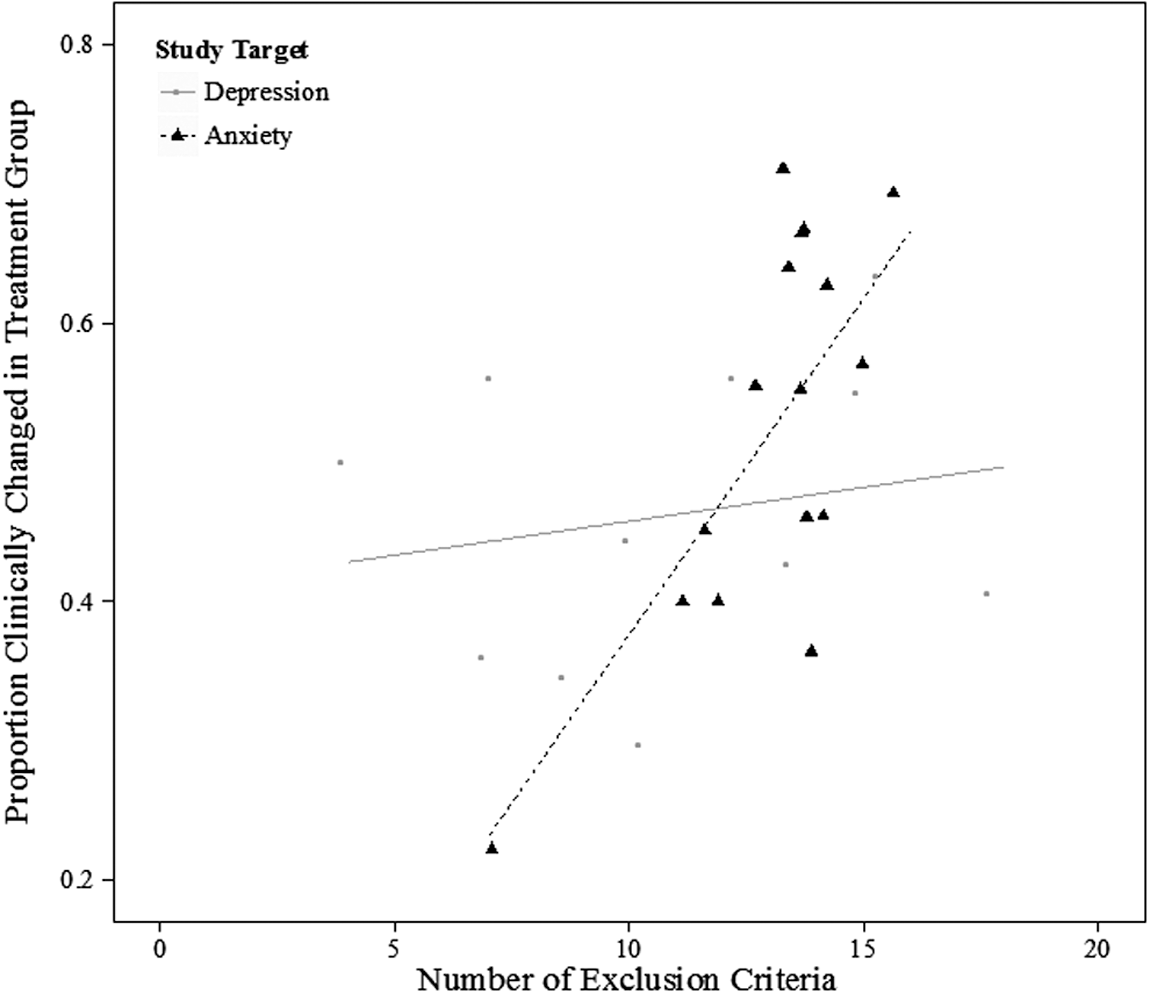
Scatter plot showing relationship between participant exclusion and treatment outcome.
Correlations Between Participant Exclusion Indices and Treatment Acceptability/Outcome Variables
Significant at the p < 0.05 level.
Discussion
The aims of this article were to systematically review a multidimensional set of treatment and acceptability outcomes in RCTs of CP for depression and anxiety disorders, to enumerate common exclusionary criteria used in RCTs of CP, and to quantify the relationship between two indices of participant exclusion (number of exclusion criteria and exclusion rate) and both treatment acceptability and treatment outcome variables. There were several notable findings from this study. First, after 4 more years of cCBT research, the number of RCTs has nearly doubled. In addition, cCBT still appears to be effective for anxiety and depressive disorders. In 2010, Andrews et al. 17 reported a pooled between-group effect size of 0.88; we found a pooled estimate of 0.85. Clinical significance outcomes suggest a similar conclusion. Pooled effect estimates showed that roughly 50% of participants receiving cCBT for anxiety or depression will experience clinically significant change, a rate about three times greater than that of control group participants. This finding is also comparable to traditional in-person therapy, adding to the literature suggesting that CP is a viable option for individuals unable or unwilling to engage with traditional face-to-face psychotherapy. For example, averaging the rates of clinical change Westen and Morrison 25 reported separately that studies of in-person cognitive behavioral therapy for depression, generalized anxiety disorder, and panic disorder yield an improvement rate of 45%.
Participant Exclusion
A multidimensional meta-analytic method has the benefit of identifying factors that may qualify conclusions about treatment effects or generalizability. This study focused on participant exclusion as one such factor. We found that the cCBT trials excluded, on average, 49% of patients interested in participating. This rate of exclusion is higher than for in-person trials. 24,25 The most common exclusion criterion was risk for suicide, which was used in 91.7% of studies, followed by substance and/or alcohol abuse/dependence, which was used in 75% of the studies. Although CP may not be equipped to deliver an optimal level of care for those at risk for suicide or those using alcohol and drugs, these groups have proportionally higher rates of treatment nonattendance in comparison with those with other forms of psychopathology. 2,65 –67 Moreover, national survey data suggest that roughly 20% of those diagnosed with depression, generalized anxiety disorder, social phobia, or panic disorder also meet criteria for a substance use disorder. 68 Reports from similar national surveys indicate that the presence of depressive and anxiety disorders increases the likelihood of thinking about or engaging in suicidal behavior. 69,70 As a result, limiting easily accessible treatment options for these groups of individuals may only maintain the treatment gap for two particularly risky and sizeable groups.
Exclusion and Outcome
Our correlation analyses revealed that the number of exclusion criteria was strongly and positively correlated with the proportion of cCBT participants experiencing clinically significant change for anxiety studies. This result provides preliminary evidence that cCBT for anxiety may lack effectiveness for those with more complex clinical presentations. Thus, initiatives to implement cCBT for anxiety in nonresearch settings should be paired with careful outcome monitoring.
These conclusions, however, are tempered by other null results from the correlation analyses. For anxiety studies, the number of exclusion criteria was not associated with any of the five other outcome variables, and exclusion rates were not associated with any of the outcome variables. Regarding the null correlations between the number of exclusion criteria and our other treatment outcome variables, these are not surprising because heterogeneity analyses did not suggest that there was sufficient variability in these outcomes across studies to be explained by methodological factors. This lack of heterogeneity could reflect either our small sample size or an actual null relationship between the number of exclusion criteria and those outcomes.
Regarding the uniformly nonsignificant relations between exclusion rates and treatment and acceptability outcomes, this may reflect the imprecision of the exclusion rate as an index of participant exclusion. For example, high or low exclusion rates may indicate the quality of a study's recruitment strategy, with studies using vague advertisements in settings that likely contain noneligible participants reporting higher exclusion rates. These explanations of null results also pertain to the nonsignificant results in the depression subgroup analyses, where our sample size was particularly low.
Limitations
Beyond the issues concerning small samples sizes discussed above, we only analyzed published RCTs and therefore did not attempt to address the “file drawer” problem by tracking down unpublished studies. Given that the “file drawer” problem describes the restricted publication of studies showing limited or null effects, including such studies in our analyses may have resulted in the heterogeneity needed to test more comprehensively the relationship between participant exclusion and treatment outcome. Future meta-analyses focusing on participant exclusion should make a point to review unpublished studies.
Implications
There are two notable implications from this study. First, for the roughly 50% of patients meeting inclusion criteria for trials of cCBT, the outcomes are promising. However, the extent to which these treatments would be efficacious for more heterogeneous patient populations is unknown, and particularly for those with anxiety, our data suggest that the effectiveness of cCBT may rapidly decline with increasing clinical complexity. Because the rationale for computerized therapy relies on its potential to broadly disseminate efficacious treatment, future trials should examine the effectiveness of cCBT for anxiety and depression for patients with more complex clinical presentations. cCBT developers need to determine how existing cCBT protocols for anxiety and depression could be augmented to include those commonly barred from RCTs, including people at risk for suicide or who use alcohol and drugs.
Footnotes
Disclosure Statement
No competing financial interests exist.