
Abstract
Introduction
Large socioeconomic disparities in morbidity due to acute childhood illness 1,2 prevail in Rochester, NY. This may partly reflect disparities in access to care. National statistics reflect both substantial demand for care of children with acute illness and substantial challenges in accessing it. 3 –5
Health-e-Access Telemedicine Model is a patient-to-provider, primary care, telemedicine model designed to enhance equity in access to primary care. System design and operations are detailed elsewhere. 6,7 Health-e-Access Telemedicine has enabled more than 14,000 telemedicine visits for children with acute illness at neighborhood access sites since 2001, 8 demonstrating a 63% reduction in absence from inner-city childcare centers due to illness 9 and 22% less emergency department (ED) use among children with Health-e-Access Telemedicine in childcare or elementary schools (CCES) than among a control group. 10 Health-e-Access Telemedicine has been enthusiastically received by inner-city parents and CCES staff. 11,12
Early assessments indicated that experienced pediatricians were confident in using Health-e-Access Telemedicine technology for 85% of pediatric acute problems presenting in an office setting, 13 and their diagnostic and management decisions were reliable and effective. 14 Clinical, organizational, and technical features of Health-e-Access Telemedicine are detailed elsewhere. 6,9 In the first 3.5 years, operations included six inner-city childcare sites served by 3 clinicians based at the University of Rochester Medical Center (URMC). Beginning January 2005, additional child sites (city elementary schools and suburban childcare and elementary schools) were gradually added to the network, bringing the total to 22 access points. Beginning May 2005, provider groups expanded to include 10 primary care practices distributed among both city and suburbs. For children with a participating practice, a high level of continuity of care (83%) was achieved. 15
Among children with Health-e-Access Telemedicine available, however, a 24% increase in overall acute care use (including office, ED, and telemedicine) was observed, 10 raising the possibility that Health-e-Access Telemedicine might lead to overuse. Yet use by suburban children was minimal, suggesting that suburban families experienced few barriers in using traditional health services and perceived little incentive to try telemedicine. Accordingly, we speculated that the increase in overall acute care use was concentrated among underserved urban children. Analysis herein focused on the hypothesis that Health-e-Access Telemedicine reduced disparity in acute care access between largely impoverished inner-city children and their more affluent suburban counterparts.
Patients and Methods
Study Population and Design
Using a pragmatic design with both concurrent and historical controls (Fig. 1), we conducted an intervention study of health services utilization for acute illness. We compared acute care use based on billing claims for two groups of child-months, those with Health-e-Access Telemedicine available (with telemedicine) and those for whom it was not (without telemedicine). Parents of intervention children consented both to participation in Health-e-Access Telemedicine and to analysis of their child's healthcare use. Claims data for children who never enrolled in Health-e-Access Telemedicine included no identifying information. Conduct of this study was approved by the University of Rochester Institutional Review Board.
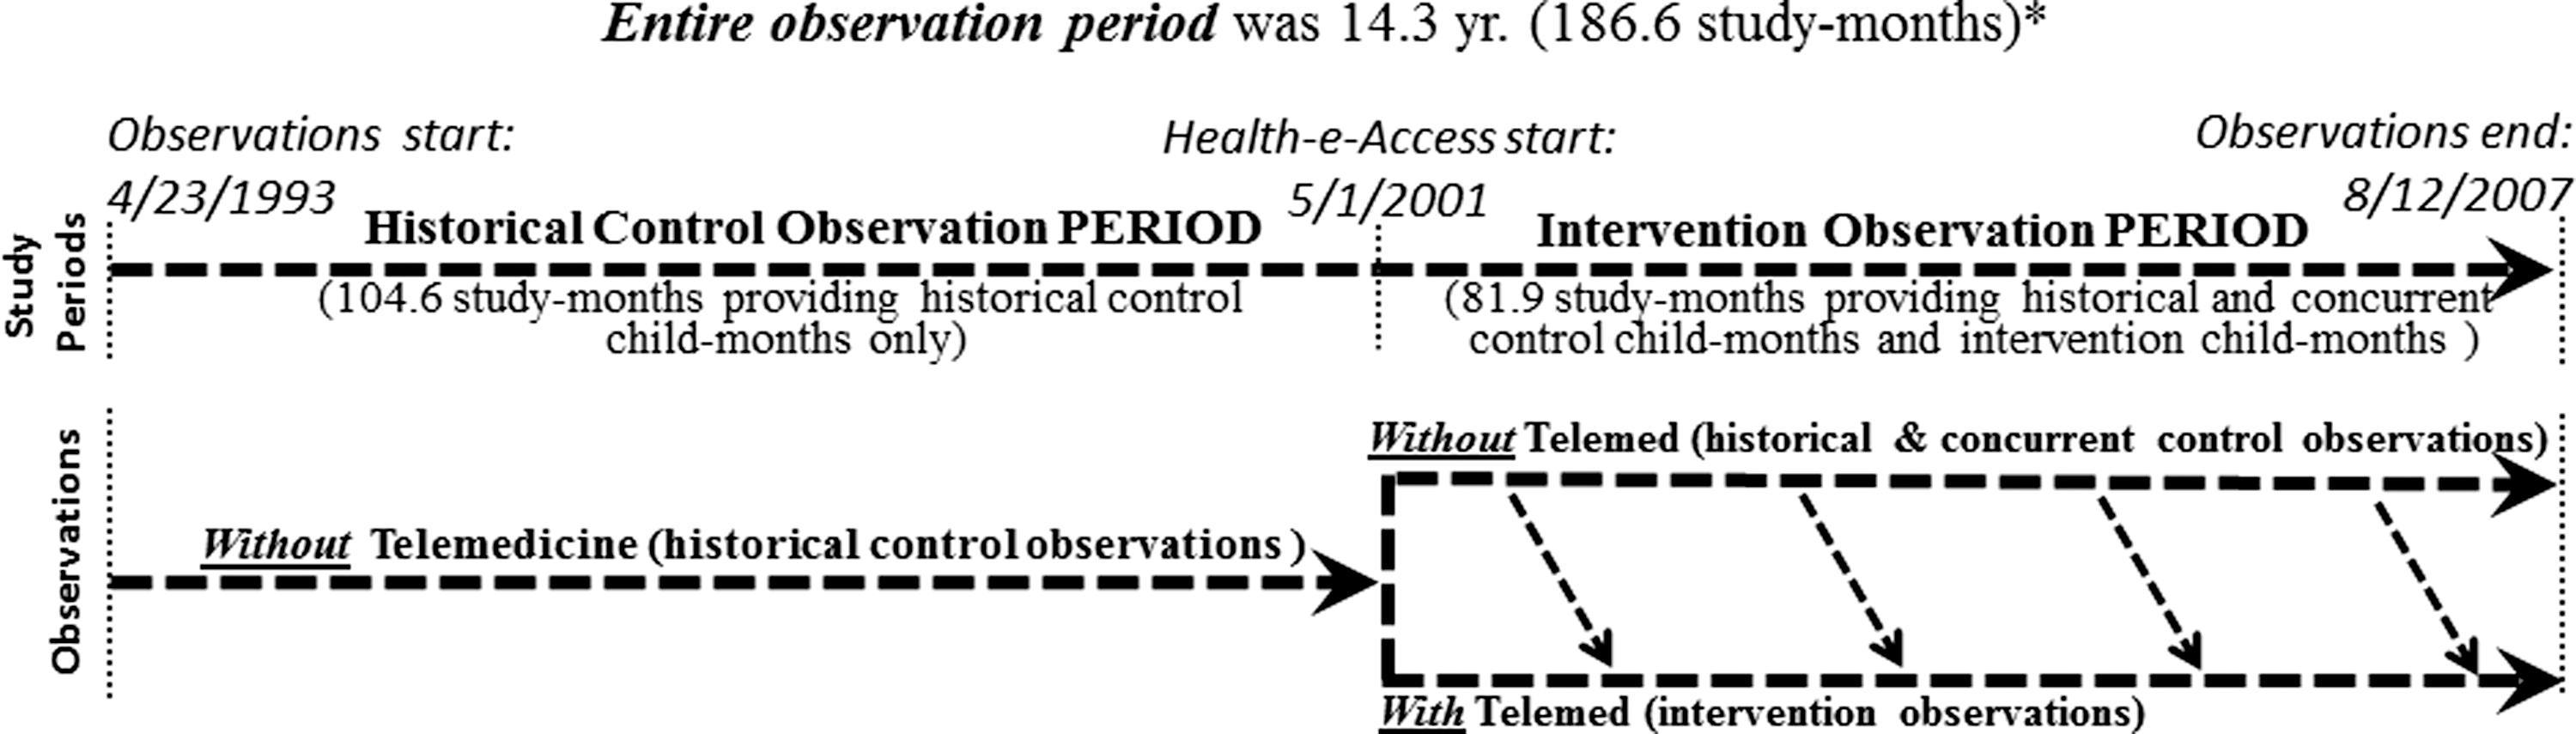
Initiation of participation, with an increasing number of child-months moving from the group Without Telemedicine (control observations) to the group With Telemedicine (intervention observations), is represented by the downward-slanting diagonal arrows. *The sum of study-months in the Historical Control Observation Period plus the Intervention Observation Period equals 185.5, rather than the actual total of 186.6, because of rounding error.
Acute care use was studied from 04/23/93 through 08/12/07 (Fig. 1). For purposes of analysis, calendar years were divided into 13 equal periods of 28 days, each termed a study month. The entire observation period spanned 186.6 study-months. Health-e-Access Telemedicine was initiated in a staggered manner starting during the study month 105 (May 2001), commencing at an increasing number of sites over time. 10 Health-e-Access Telemedicine became available to a family following parental consent. Inclusion of child-months in analysis required coverage by an insurance organization that provided claims data. The unit of analysis was child-month, defined as a study month observed for one child. A child-month with telemedicine was defined as one contributed by a child attending a participating site and with parental consent for Health-e-Access Telemedicine care.
One thousand two hundred seventeen intervention children were eligible to contribute child-months for analysis. Matching on age, sex, and socioeconomic area was performed for prior analysis, assessing the impact of Health-e-Access Telemedicine on utilization patterns during the Intervention Observation Period (Fig. 1). 10
Among children excluded, an adequate match for their study-months could not be found for 281. An additional 758 intervention children failed to provide child-months meeting inclusion criteria as follows:
Analysis of child-months was limited to sets of full months from an individual child before age 6, limiting analysis to a period when children are in childcare or in the first year of elementary school when illness-related utilization is greatest. Finally, child-months for an individual child beyond 60 in a sequence (totaling 82 child-months) were excluded because few children contributed sets longer than that and few acute illness visits of any type occurred during these child-months. Including such months in analysis would not allow robust statistical estimates. Altogether, a total of 84,287 child-months met all inclusion criteria.
At the beginning of the Intervention Observation Period (study-month 105, May 2001), control child-months were selected, from claims files of children never enrolled, to match child-months of intervention children. Prior analysis included no observations before the study-month 105.
This analysis was based on a convenience sample comparing utilization between child-months without versus child-months with telemedicine available. Matching performed for prior analysis 10 contributed to the similarity, as shown in Tables 1 and 2, of the comparison groups without and with telemedicine.
Distributions of Potentially Confounding Variables by Study Groups: Worst-Case Comparisons
Mean age (years) at end of child-month.
Child-months contributed by male children.
Child-months in which child was covered by Medicaid.
Child-months during the illness season (months 13 and 1 through 6).
Worst-case analysis considered all suburban child-months as without telemedicine, consistent with the minimal use of telemedicine among suburban children. This produced a suburban group without telemedicine for worst-case analysis of greater mean age (3.1 year) than for the suburban group without telemedicine in the best-case analysis (2.2 year) and, therefore, also a lower acute illness utilization rate. (On average, older children have less acute illness than younger children.) From the perspective of those seeking a more equitable community, results of this analysis represent a worst-case assessment; actual impact in reducing inner-city disadvantage will be at least as large as that found in worst-case analysis.
Distributions of Potentially Confounding Variables by Study Groups: Best-Case Comparisons
Mean age (years) at end of child-month.
Child-months contributed by male children.
Child-months in which child was covered by Medicaid.
Child-months during the illness season (months 13 and 1 through 6).
Best-case analysis considered all suburban child-months before 5/1/2001 as without telemedicine and suburban child-months from that date through the end of the observation period (8/12/2007) as with telemedicine. This convention resulted in a suburban-with group with a mean age of 3.4 years, greater than the mean age for the suburban group (3.1 years) used in the worst-case comparison. Consequently, in the best-case comparison of suburban-with versus inner-city-with child-months, the overall use rate for the suburban comparison group was lower than in worst-case analysis. Analysis using this lower use rate for the suburban comparison group, in turn, generated a lower bound estimate for a rate difference in which the suburban rate exceeded that of child-months of inner-city children. From the perspective of those seeking a more equitable community, results of this analysis represent a best-case assessment; that is, they represent a “ceiling” for the actual impact.
As depicted in Figure 1, the observation period lasted 14.3 years, with claims available from 4/23/1993 through 8/12/2007. The Historical Control Observation Period (first 104.6 study-months) provided only child-months without telemedicine. Some children with claims during the Historical Control Observation Period eventually gained access to telemedicine, joining the With Telemedicine group at some time after the first access site commenced participation on 5/1/2001. Additional sites were recruited and commenced participation at times subsequent to 5/1/2001. The With Telemedicine group thus also included child-months contributed by children who contributed no observations before 5/1/2001. Intervention for an individual child began only after both their childcare or school began participating and their parent consented for participation.
Measures
Telemedicine access was the primary independent variable. Primary dependent variables included rates of acute illness visits at various sites (office, ED, or telemedicine) and overall utilization (sum of all three sites combined). Rates presented are visits/100 child-years. Visits for chronic illness management or well-childcare were excluded because Health-e-Access Telemedicine did not include these services. Potential confounding variables included major determinants of utilization (child age, season, sex, insurance type, socioeconomic status). All except socioeconomic status were determined for child-months based from insurance files. Zip code of residence was used as a proxy for socioeconomic status and other sociodemographic attributes. Zip codes in the Rochester area correlate very closely with income, educational attainment, automobile ownership, race, ethnicity, and insurance type. 16 –18 On the basis of the 2000 US Census, 16 51.2% of families with children <5 years of age who lived in Rochester's four inner-city zip codes fell below the federal poverty level; 59.8% of inner-city families were black and 27.9% were Hispanic. Illness season was dichotomized based on overall illness utilization rates as low (study-months 7 through 12) and high (study-months 13 and 1 through 6).
Zip code of child residence was used to classify child-months as inner city, rest-of-city, or suburban. These distinct geographic areas in this community correlate strongly with sociodemographic patterns and with levels of family economic resources. 1
Analysis
This analysis focused on the difference between changes in overall acute care use, for inner-city intervention children, without versus with telemedicine availability, compared to that for suburban children.
Although Health-e-Access Telemedicine enrollment required research consent, changes in school or childcare enrollment did not. Consequently, if an intervention child left a participating site and did not move to another, researchers were not always aware that access to the intervention had ceased. This introduced a conservative bias to analysis.
Multivariate analysis was conducted using Poisson regression models. The dependent variable was the number of acute illness visits, with study group as the independent variable after adjusting for covariates. Estimates of regression coefficients and standard errors were obtained using the generalized estimating equations (GEE) method. Because each child contributed multiple child-months, data were clustered within subject. GEE accounts for autocorrelation among observations from the same subject. By specifying marginal mean effects of independent variables on the outcome variable, the GEE method offers consistent and robust estimates. Interaction effects between study group and study period were also included. Appropriate contrasts were specified to examine both within- and between-group differences in rates.
Acute illness utilization rates (telemedicine, ED, and office) per 100 child-years were calculated for each intervention group, study period, and socioeconomic area. Comparisons between inner-city child-months without and with telemedicine access versus suburban child-months were of particular interest.
For inner-city and for rest-of-city children, child-specific start dates were determined by parental consent for telemedicine use at a participating site. In contrast, because all suburban child-months were controls, the date differentiating before and after periods for suburban child-months was necessarily arbitrary. To ensure that findings were robust, therefore, analysis comparing inner-city and suburban child-months was performed to produce worst-case and best-case estimates for Health-e-Access Telemedicine impact.
Tables 1 and 2 break down child-months included in worst- and best-case comparisons by socioeconomic area and potentially confounding variables. Worst-case analysis treated all suburban child-months as without access, consistent with the fact that virtually no suburban children had telemedicine visits. Following this approach, the suburban group included the child-months with the oldest as well as the youngest ages, thus maximizing the age of the suburban comparison group. Because utilization rates for acute illness are known to decrease substantially over the first few years of life, this analysis produced a lower-bound estimate of acute care use for suburban child-months. Thus, in a comparison that finds greater use among suburban than urban child-months, the estimate produced by this analysis provides a lower-bound estimate of the true difference; the true difference will be as great as or greater than that estimated through worst-case analysis. If one's objective is to contribute to a more equitable community, results of this analysis represent a worst-case assessment of the potential of Health-e-Access Telemedicine to contribute toward that end. Similarly, in a comparison that finds less use among suburban than urban child-months, the true difference will be less than that observed.
Best-case analysis treated suburban child-months before any children gained access as without-group members, and all those suburban child-months after that time (5/1/2001 and beyond) as with-group members. As shown in Table 2, the best-case analysis narrows the age difference between the inner city with group and the suburban group to which it is compared (the suburban-with group). Consequently, the effect of age on observed suburban versus inner-city group differences in utilization rates is reduced. Thus, in a comparison that finds greater use among suburban than urban child-months, the true difference will be less than that estimated through the best-case analysis; this analysis provides an upper bound for a finding of greater use among suburban children.
Results
Table 1 displays distributions among groups defined by telemedicine access and socioeconomic area for worst-case analysis. Table 2 does likewise for best-case analysis. Also displayed are distributions within subgroups of potentially confounding variables, including age, sex, insurance type (% Medicaid), and illness season. As expected, the proportions of child-months for males and during the illness season were similar for all study groups, and the proportions of child-months with children covered by Medicaid were greater for city than suburban subgroups. Availability of telemedicine to suburban children had little impact on utilization. During the 7,446 child-months of observation (Table 2) contributed by all 243 suburban children ever enrolled in Health-e-Access Telemedicine, 4 telemedicine visits occurred, versus 1008 for children from other socioeconomic areas.
Worst-Case Analysis
These tables show that the inner city versus suburban comparison groups used in worst-case analysis were very similar in mean years of age (suburban without, 3.1 vs. inner-city without, 3.0). Despite closeness among groups in age as well as other potential confounders, observed overall acute illness rate (expressed as visits per 100 child-years) was substantially greater for suburban without (449) than inner-city without (328) child-months (Fig. 2). In multivariate analysis assessing this comparison (Table 3), the point estimate for this rate ratio was 1.75 (p < 0.0001).

The comparison of primary interest is between differences in overall use by the suburban group without telemedicine and the inner-city groups without and with telemedicine access. *Rates expressed as visits/100 child-years. **Child-months without telemedicine include concurrent and historical control child-months for suburban, rest-of-city, and inner-city groups. #Based on values used in worst-case analysis, actual impact of telemedicine in reducing disparity in access is at least as great as that found in worst-case analysis. See text. ED, emergency department.
Adjusted Rate Ratios for Key Rate Comparisons
Rate ratios presented as suburban rate divided by city rate (inner city or rest-of-city).
inner = inner city; rest = rest-of-city; without = intervention not available; with = intervention available.
Adjusted Rate Ratios—Interaction between group and study period was tested after adjusting for within-subject clustering and controlling for covariates of age, sex, and illness season.
All acute visits—Includes office, ED, and telemedicine.
Suburban comparison group without telemedicine as defined for worst-case analysis. In this analysis, when observed suburban use is greater than observed use in other areas, the true difference will be as great or greater.
Suburban comparison group without telemedicine as defined for best-case analysis. In this analysis, when observed suburban use is greater than observed use in other areas, the true difference will be less than that observed in this analysis.
CL, confidence limit; ED, emergency department; NS, not statistically significant.
Greater overall acute care use for inner-city child-months with telemedicine access (519) compared to those without telemedicine (328) was attributable almost entirely to telemedicine visits (Fig. 2). Excluding the 185 telemedicine visits per 100 child-years, the total inner-city acute care use without (328) and with (334) telemedicine was almost identical.
The observed overall acute care rate was greater for the suburban-without comparison group than for inner-city child-months without (449 vs. 328, Fig. 2), despite the fact that the suburban group was slightly older (3.1 vs. 3.0 years, Table 1). Multivariate analysis indicated that this suburban rate was 75% greater (Table 3, rate ratio 1.75, p < 0.0001). Given that this is a worst-case comparison, the true difference was at least as great as this estimate.
In contrast, the observed overall use rate for inner-city child-months with telemedicine (519) exceeded that for the suburban-without comparison group (449), and this difference approached statistical significance (suburban:inner-city rate ratio, 0.80, p = 0.07).
Discussion
Overall use of acute illness care was 75% greater among suburban than inner-city children without telemedicine access. When telemedicine was available during 4,725 child-months observed for inner-city children, the overall acute visit use for these child-months increased to a rate that approximated that for suburban child-months without (adjusted rate ratio 0.80, p = 0.07). Overall acute visit rate remained at least 56% greater for suburban than inner-city child-months without telemedicine access, however. Findings support the hypothesis that Health-e-Access Telemedicine redresses socioeconomic disparities in access.
Telemedicine accounted for a substantial proportion of all illness-related utilization observed, 32.0% and 35.6% for rest-of-city and inner-city groups with Health-e-Access Telemedicine availability, respectively. Following Health-e-Access Telemedicine initiation, office visits still comprised a larger proportion of all illness visits than telemedicine visits (Fig. 1) in both these intervention groups. In light of prior research suggesting that 85% of acute illness office visits could be managed effectively with the Health-e-Access Telemedicine model 14 and parents value this care model highly, 11,12 it appears that a much larger proportion of these visits could and should have been provided through telemedicine; Health-e-Access Telemedicine was underutilized. One likely explanation for underuse is that Health-e-Access Telemedicine availability during the study period was limited to childcare or school settings. Illness symptoms often first appear, while neither childcare nor school is in session. Health-e-Access Telemedicine offers appropriate care for many ill children who will not be sent to school. The majority of pediatric nonemergency ED visits occur during evenings and weekends, supporting the belief that after-hours Health-e-Access Telemedicine availability in other convenient neighborhood settings (e.g., family service agencies, community centers) would benefit the many parents not in a position to seek care until home from work.
Limitations
Mean age during inner-city observations with telemedicine was greater compared with suburban-without and suburban-after comparison groups. Acute illness episodes are less frequent among older children, raising concern about bias in analysis comparing utilization rates with groups with a younger mean age. Age differences for these key comparisons were not great, however (3.7 vs. 3.1, Table 1; 3.7 vs. 3.4, Table 2). Moreover, multivariate analysis adjusted for age differences as well as other important influences on acute care use, including sex and season of the year. Finally, multivariate analysis accounted for within-subject correlations, adjusting for the possibility that bias might result from contributions of more child-months by some children than others.
As noted above, we do not know when, before ending observations, access to the intervention ended for some children. Accordingly, if an enrolled child left a participating site and did not move to another participating site, child-months of observation would accrue for that child in counts used in analysis without actual access to telemedicine. In assessing this design limitation, one should understand the following: (1) Billing claims provided complete information on illness-related utilization, including telemedicine visits. (2) With counts of intervention child-months overestimating time when some children had access and, thus, with analysis falsely treating some months as if intervention were available, estimates of impact are conservative. Thus, true impact was probably greater than we observed.
Implications
Greater convenience and additional capacity often yield both greater use and overall costs. 19,20 However greater use can also yield lower costs if less costly events replace a sufficient number of more costly ones. Net payments for acute care among intervention children compared to those for control children undoubtedly fell, despite a 24% increase in acute care visits, because ED visits, which fell 22%, 10 are priced almost 10-fold higher in this community than Health-e-Access Telemedicine visits. 21
For a provider organization encompassing both primary care and ED services, full adoption of this telemedicine model, while operating under fee-for-service financing, would impact financial status negatively. This assessment assumes that per-visit payments to the provider organization are substantially greater for ED than for telemedicine visits, and true per-visit costs to deliver the service are roughly equivalent. In the Rochester area, NY, payments for ED visits addressing common acute problems have been ∼10-fold greater than for telemedicine or office visits. 21 Also, costs to provider organizations for delivering Health-e-Access Telemedicine visits are actually somewhat less than for ED visits, given that physician time required for Health-e-Access Telemedicine visits is no greater than for ED visits and patient-site personnel for Health-e-Access Telemedicine visits are technicians. Thus, assumptions required to support this assessment–within fee-for-service financing, provider organization business strategy does not favor Health-e-Access Telemedicine implementation–appear sound.
Such a business strategy overlooks the value of Health-e-Access Telemedicine to families, reflected in satisfaction surveys, indicating that lower socioeconomic status families served by Health-e-Access Telemedicine valued it highly 12 and it ignores the transition to value-driven financing associated with healthcare reform. 21 –23 Although fee-for-service financial considerations discourage provider organizations from implementing this innovation, patient preferences are more likely to dominate implementation decisions when capitated financing prevails.
Conclusions
We observed a striking disparity in access in a community that has long prided itself on primary care access for all. 24 Equality is a core characteristic of fair societies. 25 Fair societies embrace service models offering lower socioeconomic status children as much care as middle-class children. Findings suggest that the Health-e-Access Telemedicine Model can be a powerful tool toward that end.
Footnotes
Acknowledgments
Klaus J. Roghmann recognized the full potential of connected health before any of us, and he mentored our use of methodological approaches essential to its assessment. Monroe Plan for Medical Care and Excellus Blue Cross provided deidentified claims data on which analysis was based. These organizations and MVP Healthcare provided reimbursement for telemedicine visits.
This study was supported by grants from the following organizations: Agency for Healthcare Research and Quality (R18 HS01891, R01 HS15165); New York State Healthcare Foundation; New York State Health Department—Health Care Efficiency and Affordability Law NY Phase 6—Primary Care Infrastructure (HEAL6); Maternal and Child Health Bureau (R40 MC03605); US Department of Commerce; Rochester Area Community Foundation; Daisy Marquis Jones Foundation; United Way of Rochester and Monroe County; Halcyon Hill Foundation; Davenport-Hatch Foundation; Rochester's Child; Gannett Foundation; Wilson Foundation; Wilmott Foundation; Weyerhaeuser Company Foundation; Feinbloom Foundation; and Robert Wood Johnson Foundation, Local Initiative Funding Partners. None of these organizations had any role, other than approval of proposals for funding, in the design and conduct of the study; collection, management, analysis, and interpretation of the data; preparation, review, or approval of the article; nor in the decision to submit this article for publication.
Disclosure Statement
At one time, Kenneth McConnochie and Nancy Wood held financial interests in TeleAtrics, Inc., which purchased the software used to deliver services described in this article from Trifecta Technologies of Allentown, PA. TeleAtrics software was then acquired by Trifecta Technologies in August 2008. Dr. McConnochie and Mrs. Wood were cofounders of TeleAtrics, Inc., and, as a result of the August 2008 sale, were to receive a small percentage of potential revenues that might accrue to Trifecta through July 2013 from this product. Neither Mrs. Wood nor Dr. McConnochie received any funds from Trifecta following the time of the sale of TeleAtrics in August 2008.
At one time, Kenneth McConnochie and Nancy Wood held financial interests in TeleAtrics, Inc., which purchased the software used to deliver services described in this article from Trifecta Technologies of Allentown, PA. TeleAtrics software was then acquired by Trifecta Technologies in August 2008. Dr. McConnochie and Mrs. Wood were cofounders of TeleAtrics, Inc., and, as a result of the August 2008 sale, were to receive a small percentage of potential revenues that might accrue to Trifecta from this product through July 2013. Neither Mrs. Wood nor Dr. McConnochie received any funds from Trifecta following the time of the sale of TeleAtrics in August 2008. Neither TeleAtrics nor Trifecta provided any funds for support of Health-e-Access Telemedicine or for the research described herein. The other authors have no potential conflicts of interest to disclose.