
Abstract
Introduction
Telemedicine is used frequently to address gaps in healthcare disparities, allowing providers and patients to connect despite geographic barriers. Research has shown that telemedicine can improve access to care, while also offering high quality and cost-effective services. 1 –6 Demonstrated benefits of telemedicine include excellent management of chronic diseases, shared staffing, reduced travel times, and fewer and/or shorter hospital stays. 7 –9 In fact, several studies indicate that healthcare services delivered using telemedicine are just as good as traditional in-person consultations. 4,5,8 Literature from the past decade has underscored patient satisfaction and support for telemedicine services, highlighting the positive feedback from reduced travel times for the patient. 10 –12 As the cost and quality of telehealth technologies become more favorable, and as the reimbursement policies for telehealth become more equitable, the use of telemedicine to reach rural and underserved populations is increasingly appealing.
Telemedicine clinics located in areas of high need have the potential to deliver quality care to patients who might otherwise not have access. 3,13,14 However, there is a lack of geospatial and socioeconomic information evaluating whether or not the locations of telemedicine clinics are in alignment with locations having the greatest healthcare need. Geospatial Information Systems (GIS) can provide data superimposed upon geographical maps to provide a visual representation of data by region. The use of such data by those involved in the delivery of healthcare, such as payers, health systems, and hospitals, could assist in the strategic planning and allocation of services. This is especially important given the evolving state of healthcare delivery through the Affordable Care Act and emphasis on accountable care models to provide quality healthcare across expanding regions at lower rates. Populations with the greatest healthcare needs would be most likely to benefit from the improved access and cost reductions of telemedicine, aligning with the needs of the current healthcare system. 1,15
The goal of this study was to use GIS, ZIP Code Tabulation Areas (ZCTAs), and a measure of community healthcare need to analyze and compare communities receiving telemedicine services to communities not receiving telemedicine services from a large academic medical center. We hypothesized that communities served by telemedicine would be those with the greatest healthcare needs based on five evidence-based barriers to access.
Materials and Methods
Telemedicine Sites
This was a retrospective study using the complete telemedicine database of all outpatient telemedicine consultations provided by the University of California Davis Telemedicine Program between July 1996 and December 2013. During this time, telemedicine services were provided to a total of 198 unique sites located in 47 of California's 58 counties (81%). Addresses for the 198 telemedicine clinic sites were retrieved from the telemedicine database and were geocoded using ArcGIS software, v10.2 (Esri, Redlands, CA). Through this process, a latitude and longitude were assigned to create a point on the map corresponding to each of the telemedicine clinic sites. Of the 198 telemedicine clinic sites, 133 (67%) were geocoded automatically. Of the remaining telemedicine clinic sites, 62 (31%) required a manual geocoding process that included visual validation of the site in Google Earth and three sites were left unmatched (1.5%). The three sites left unmatched had no address listed in the database and were not included in analyses.
Zip Code Tabulation Areas
The most current ZCTA boundaries for California were extracted from a 2010 dated Topologically Integrated Geographic Encoding and Referencing file from the U.S. Census Bureau. During analysis of the 195 clinic sites, one additional clinic site was excluded because it was located in a ZCTA lacking the data needed to calculate the community needs index (CNI) score. This resulted in the evaluation of 194 clinic sites in this study.
Community Needs Index
The CNI created in this study was an adaptation of Dignity Health's CNI. The CNI was calculated based on five evidence-based barriers to healthcare access, including income, culture, education, insurance, and housing. 16 Each barrier was represented by publically available data derived from the U.S. Census Bureau (American Community Survey) and was assigned a quantitative score reflecting the level of need. The “Income Barrier” is based upon the percentage of households below poverty line with a head of household age of 65 or more; the percentage of families with children less than 18 below poverty line; and the percentage of single female-headed families with children less than 18 below poverty line. The “Cultural Barrier” is based upon the percentage of population that is minority (including Hispanic ethnicity) and the percentage of the population more than age five that speaks English poorly or not at all. The “Education Barrier” is based upon the percentage of the population more than 25 without a high school diploma. The “Insurance Barrier” is based upon the percentage of the population in the labor force, aged 16 or more, without employment and the percentage of population without health insurance. The “Housing Barrier” is based upon the percentage of households renting their home. Each of the five barriers was categorized into quintiles and assigned a rank of one through five, with one indicating the lowest need and five representing the highest need. The scores for each barrier were then equally weighted and averaged across all barriers to produce a final CNI score for each ZCTA.
CNI Barriers
To create the measure for each of the five barriers to healthcare access, multiple fields from the census data were used. For measures that used more than one source of data (e.g., the culture barrier is calculated from census data on language and race), ZCTA specific averages of the different components were used (Table 1). Each barrier to healthcare access was examined individually, and ZCTA level observations were divided into quintiles, as previously described. When all five barriers to healthcare were ranked within their quintiles, the rank scores were then averaged across indicators for each ZCTA, creating the ZCTA specific CNI score.
CNI Measures and Census Variables Used to Determine the Five Established Barriers to Healthcare Access
Census variables defined according to:
California CNI Map
ArcGIS was used to produce a map of California that illustrated the level of healthcare need across ZCTAs. The map reflects the community need scores at a ZCTA level based on the five calculated barriers to healthcare. A color gradient applied to the map acts as a visual indicator of varying levels of healthcare needs with darker colors indicating higher levels of need. Second, each of the telemedicine clinic sites participating in the UC Davis Telemedicine Program was overlaid on this map (Fig. 1).
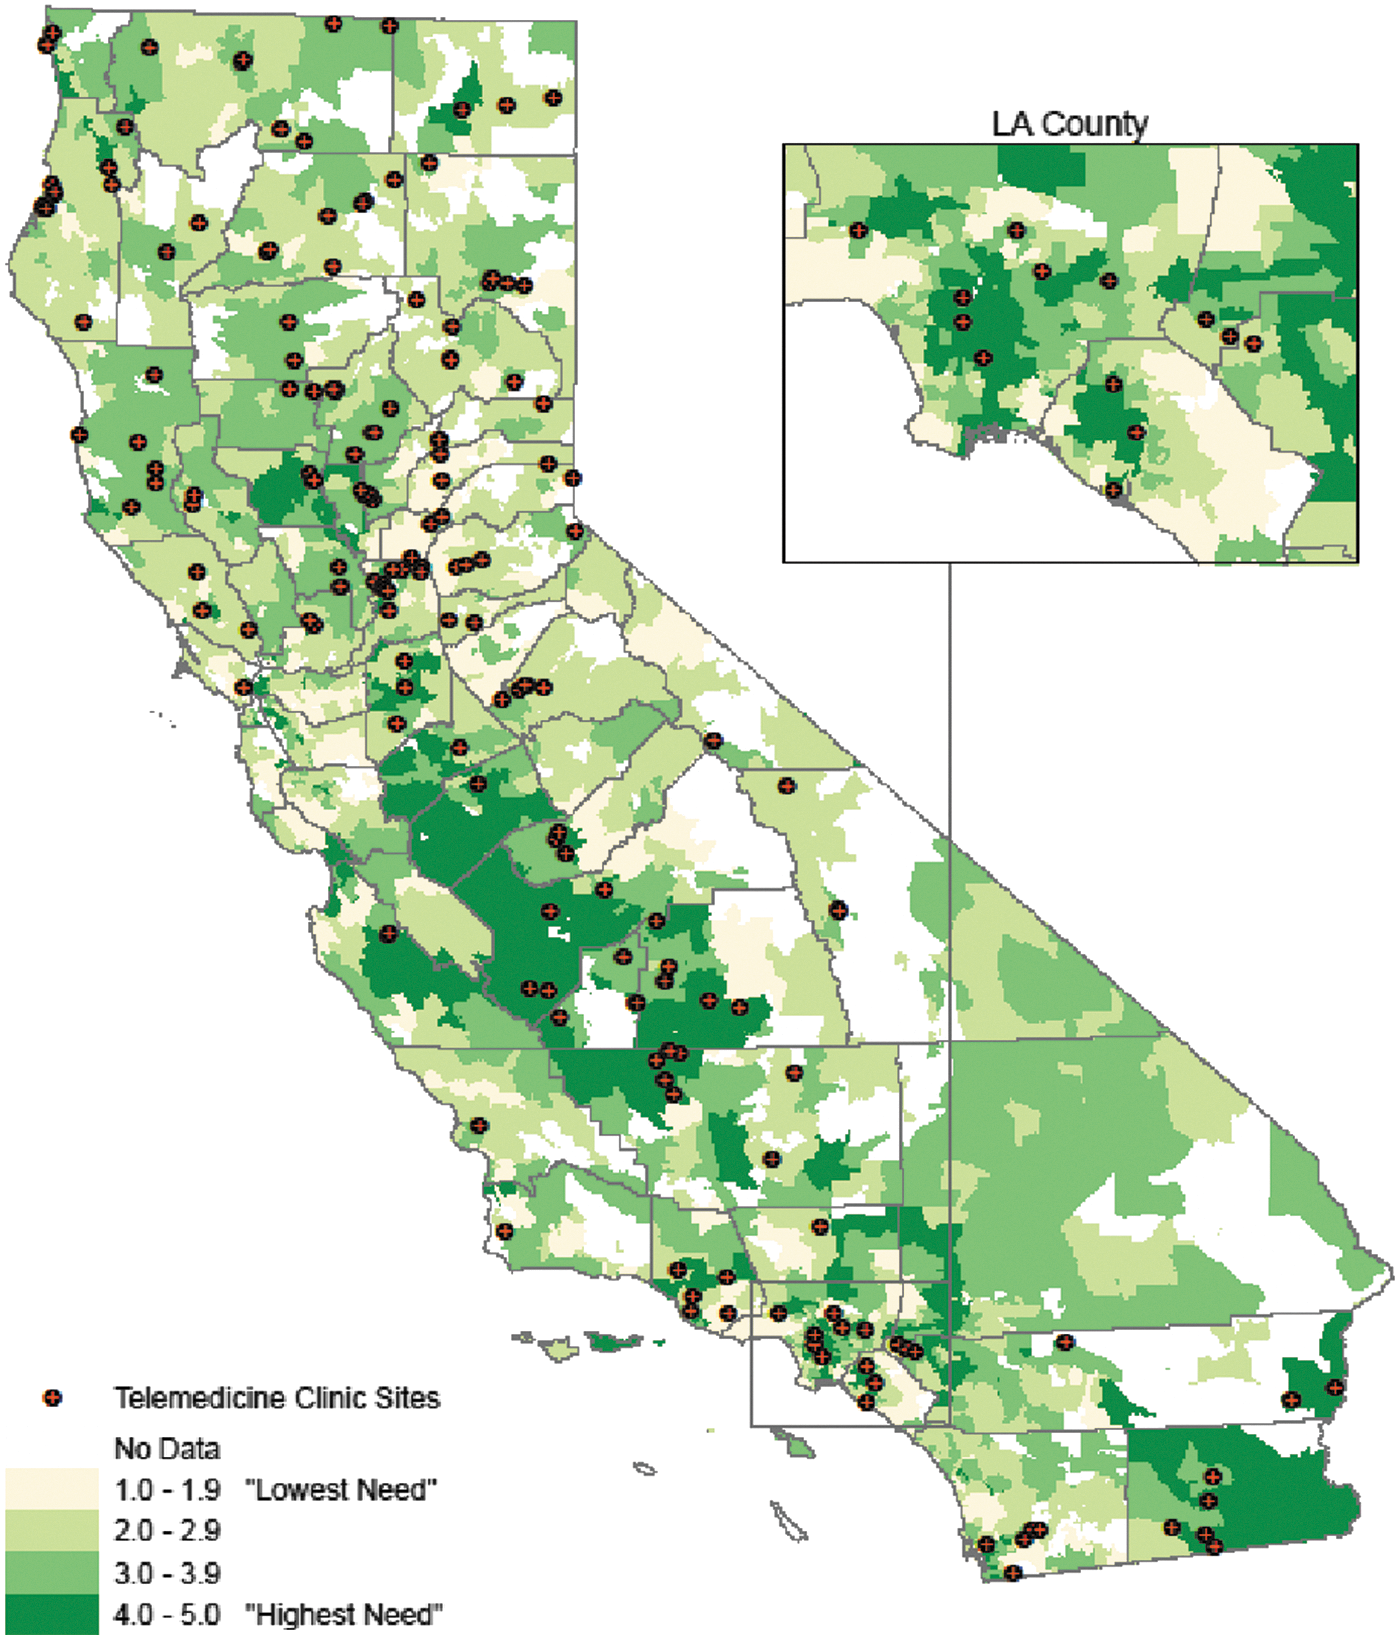
Map of telemedicine clinic sites with CNI by ZCTA, 2012. CNI, community needs index; ZCTA, ZIP Code Tabulation Area.
Statistical Analysis and Human Subjects
Statistical analysis was performed using Microsoft Excel 2013. The mean CNI for all ZCTAs with at least one telemedicine clinic site was compared to the mean CNI for ZCTAs without telemedicine clinics using a two-tailed Student's t-test. The Human Subjects Review Committee at UC Davis approved this study.
Results
There are a total of 1,834 ZCTAs in California, of which 213 (11.6%) were excluded because they represented uninhabited coastal regions, forested areas, including State and National Parks, and sparsely populated frontier areas. Overall, the average CNI score of the 1,621 ZCTAs in California was 2.99 ± 1.01. There were 147 (9%) ZCTAs containing at least one of the 194 telemedicine clinics. The average CNI score for the 147 ZCTAs with at least one telemedicine site was 3.32 ± 0.84. The average CNI score for the 1,475 ZCTAs without a telemedicine clinic was 2.95 ± 0.99. The mean CNI score for ZCTAs with at least one telemedicine clinic was significantly higher than the mean CNI score for ZCTAs without a telemedicine clinic (p < 0.001), as well as the mean CNI score for all ZCTAs in California (p < 0.001).
Of the 1,621 ZCTAs, 340 (21%) had a CNI score of 4–5, which were deemed very high need. At the next highest need level, there were 466 (28.7%) ZCTAs with a CNI score of 3–3.9. Combining the two highest quintile ranks, 806 (49.7%) ZCTAs had above average healthcare need with a CNI score of three to five for all of California (p < 0.001).
Of the 194 telemedicine clinic sites, 71.4% were located in those communities with above average need (CNI between 3 and 5), 33.2% of the clinic sites were located in communities with very high needs (CNI between 4 and 5), and only 2.6% of the telemedicine clinic sites were located in communities with the lowest need (CNI between 1 and 1.9). This overall distribution of communities receiving telemedicine services had significantly higher CNIs than expected compared to the overall CNI distribution of communities throughout California (p < 0.001).
Discussion
Improving population health and achieving healthcare equity, identified as national and international priorities, 17,18 require broad approaches targeting social, economic, and environmental factors that influence health. 19,20 The current study used five evidence-based socioeconomic barriers to healthcare to determine community health needs in California. The results demonstrate that a university-based telemedicine program has been delivering telemedicine services disproportionately to communities with higher healthcare needs, where telemedicine has the potential to be most effective. 21 By utilizing the methods described in this study, telemedicine programs, state officials, and federal agencies could take steps in closing the gap in the delivery of healthcare disparities by evaluating the existing and planning for future telemedicine sites to more efficiently and effectively deliver care to underserved communities.
Furthermore, the use of objective measures to evaluate healthcare needs and barriers to access enables healthcare providers, payers, and policy makers to use a standardized quantitative tool to assist in allocating resources in response to the evolving healthcare system. The use of GIS in published studies has previously evaluated access to specialty healthcare through telemedicine, 22,23 yet, to our knowledge, this is the first study to map and overlay community healthcare needs with GIS methodologies, which can be instrumental for future funding and planning initiatives. In addition, as the Affordable Care Act continues to successfully widen health coverage for more Americans, and as the Center for Medicare and Medicaid Services is focusing priorities on population health, patients' experience of care, and per capita cost, the ability to provide greater access to care at a lower cost becomes even more relevant. The use of telemedicine, in combination with objective population health delivery measures, has the opportunity to serve as the platform for effective affordable access to care.
There are several limitations to our study. First, the original description of the CNI used some Census level data that are not publically available, which limited our ability to calculate CNIs for all ZCTAs (specifically, those in designated Frontier Areas). The use of public data allows the study to be replicated more easily under the same standards with the same quality of data and lends itself to be examined over time. Second, we were unable to identify all telemedicine clinic sites because of missing or incomplete location data, but relatively speaking, these sites only represented 1.5% of the total number of clinics. Third, while we are able to demonstrate that the telemedicine clinics were located in communities with the highest healthcare needs, we are not sure that the populations served by these clinics are reflected by the clinic site CNIs.
The data and maps produced in this study could provide a valuable resource in helping to determine where future telemedicine programs should be established. The high need communities lacking a telemedicine clinic site should be under consideration for implementation of a telemedicine program. Further research is necessary to determine which of these communities would benefit most from telemedicine services. On a larger scale, the CNI enables healthcare providers, administrators, and policy makers to use a quantitative tool to assist in allocating resources where they are most needed.
Footnotes
Disclosure Statement
No competing financial interests exist.