
Abstract
Background:
Telemedicine in the intensive care unit (tele-ICU) is expected to address geographic health disparities through more efficient resource allocation. Our previous economic evaluation demonstrated tele-ICU to be cost-effective in most cases and cost saving in some cases, compared to conventional intensive care unit (ICU) care without adequate intensivist coverage.
Introduction:
This study's objective is to examine how to optimize the cost-effectiveness of tele-ICU use by selecting highest risk (i.e., both highest mortality and highest cost) subpopulations. We also explore potential cost savings.
Materials and Methods:
We conducted simulation analyses among a hypothetical adult ICU patient cohort defined by the literature, distinguishing four types of hospitals: urban tertiary (primary analysis), urban community, rural tertiary, and rural community. The selected tele-ICU use was assumed to affect per-patient ICU cost and hospital mortality among highest risk subpopulations (10–100% of all ICU patients), defined by an established illness-severity measure.
Results:
We found a U-shaped relationship between the economic efficiency and selected tele-ICU use among all 4 hospital types. Optimal cost-effectiveness was achieved when tele-ICU was applied to the 30–40% highest risk patients among all ICU patients (incremental cost-effectiveness ratio = $25,392 [2014 U.S. dollars] per extending a quality-adjusted life year) in urban tertiary hospitals (primary analysis). Our break-even analyses indicated that cost saving seems more feasible when reducing ICU medical care cost, rather than lowering the cost to operate telemedicine alone.
Discussion and Conclusions:
A selected use of tele-ICU based on severity of illness is likely to improve tele-ICU cost-effectiveness. To achieve cost saving, tele-ICU must reduce more than just telemedicine-related cost.
Introduction
Telemedicine in the intensive care unit (tele-ICU) is defined as “networks of audio-visual communications and data systems to link hospital intensive care units (ICU) to intensivists and other critical care professionals at remote locations.” 1 Tele-ICU is expected to reduce health disparities in ICU care created by geographic distances through more efficient resource allocation, including intensivists, critical care nursing, and critical care pharmacists. However, the spread of tele-ICU has slowed, partly due to high equipment installation costs and limited evidence of economic efficiency. 2
Measuring health outcome improvements is an essential part of evaluating the economic efficiency of a health intervention. 3 Specifically, the first step of such an evaluation is to examine whether a new and focused health intervention yields at least an equal or better health outcome compared to an existing intervention. 3 After confirming it does, the next step is to examine whether a new and focused health intervention is cost saving, that is, costing less than an existing intervention, without assigning any monetary value for a health outcome improvement. If tele-ICU is determined to be “always” better in health outcomes and lower in cost (compared to conventional ICU care without telemedicine), tele-ICU is concluded to “dominate” conventional ICU care or be a dominant case. 3 In a dominant case, tele-ICU would be strongly recommended for all ICUs and supported by all stakeholders, including insurers who could reimburse care at a higher rate if using tele-ICU.
“Always” observing such a dominant case is very rare in healthcare in general. Tele-ICU was no exception. For instance, tele-ICU will not add an incremental benefit for an ICU that has adequate intensivist coverage and hence has the best outcomes. 4 Another example is reported in our previous study, 5 which integrated the mixed literature regarding tele-ICU impacts on ICU outcomes (including both clinical and financial ones) using mathematical simulation models. 5 Our probabilistic simulation analyses projected that tele-ICU “dominates” a conventional ICU and hence achieves “cost saving” in 37.2% of 1,000 iterations. 5 To further explore the remaining possibilities, the third step was performed to determine whether tele-ICU was “reasonably” more expensive than conventional ICU care. This step, a cost-effectiveness analysis (CEA), measures the incremental cost for improving a certain standardized health outcome improvement compared to the status quo. An intervention with a lower incremental cost indicates a “relatively” higher economic efficiency (compared to another intervention with a higher incremental cost), which is still, however, economically less optimal than a cost-saving intervention. Because a CEA can only rank “relative” economic efficiency, judging whether a health intervention is “reasonably cost-effective” requires a reference threshold, described hereafter.
Our previous study measured health outcomes with quality-adjusted life years (QALYs), and estimated an incremental cost-effectiveness ratio (ICER) in terms of extra cost per additional QALY. This standardized economic evaluation enabled us to compare tele-ICU to other health interventions using a standardized reference (i.e., the QALY). For instance, we previously estimated tele-ICU to have an ICER of $50,265, meaning that the extra cost for tele-ICU to extend life by one QALY (for a single patient) is $50,265. With this ICER estimate, tele-ICU would be considered cost-effective with a willingness-to-pay threshold of $100,000 per QALY. 6 In addition, our probabilistic analyses projected that 66.8% of the iterations (including 37.2% of cost saving described earlier) would fall below the cost-effectiveness threshold of $100,000. 5 These diverse estimates of tele-ICU's economic efficiency reflect wide variations of tele-ICU-related clinical outcomes and costs across hospitals, which in turn are partly attributed to hospitals' different characteristics such as the expected annual tele-ICU volume and the baseline ICU mortality. These “across-hospital” variations warranted sensitivity analyses and break-even analyses to estimate a set of benchmarks (including a maximum acceptable cost and a minimum required effectiveness) to achieve cost saving or at least meet a cost-effectiveness threshold, as reported in our previous study. 5 These benchmarks can help health policy and hospital administrators determine how tele-ICU should be introduced for each hospital. 5,7
This study's primary purpose is to examine how to improve tele-ICU's economic efficiency by using tele-ICU for a selected subset of ICU patients with the expected highest mortality rates and the highest per-patient cost (called “highest risk subpopulation” hereafter). The aim was to identify an optimal selection of the highest risk subpopulation that would maximize the health outcome improvements per dollar, that is, improving tele-ICU's cost-effectiveness. These health outcome improvements through telemedicine are assumed to occur in conventional ICUs without adequate intensivist coverage. A potential policy implication is to recommend scoring patients' degree of benefit when using tele-ICU.
To be comparable with our previous study, 5 we converted all costs to U.S. 2014 dollars with the consumer price index (CPI). The next aim was to estimate the cost benchmarks to achieve cost saving under tele-ICU. Among these benchmarks, our particular question was tele-ICU equipment installation (start-up) costs that could either increase or decrease over time, depending on costing methodology, for example, applying the “medical care-specific” CPI or the information technology (IT)-specific CPI, respectively (Fig. 1). 8 This was done because a recent study indicated reduced tele-ICU equipment installation costs compared to past tele-ICUs. 9
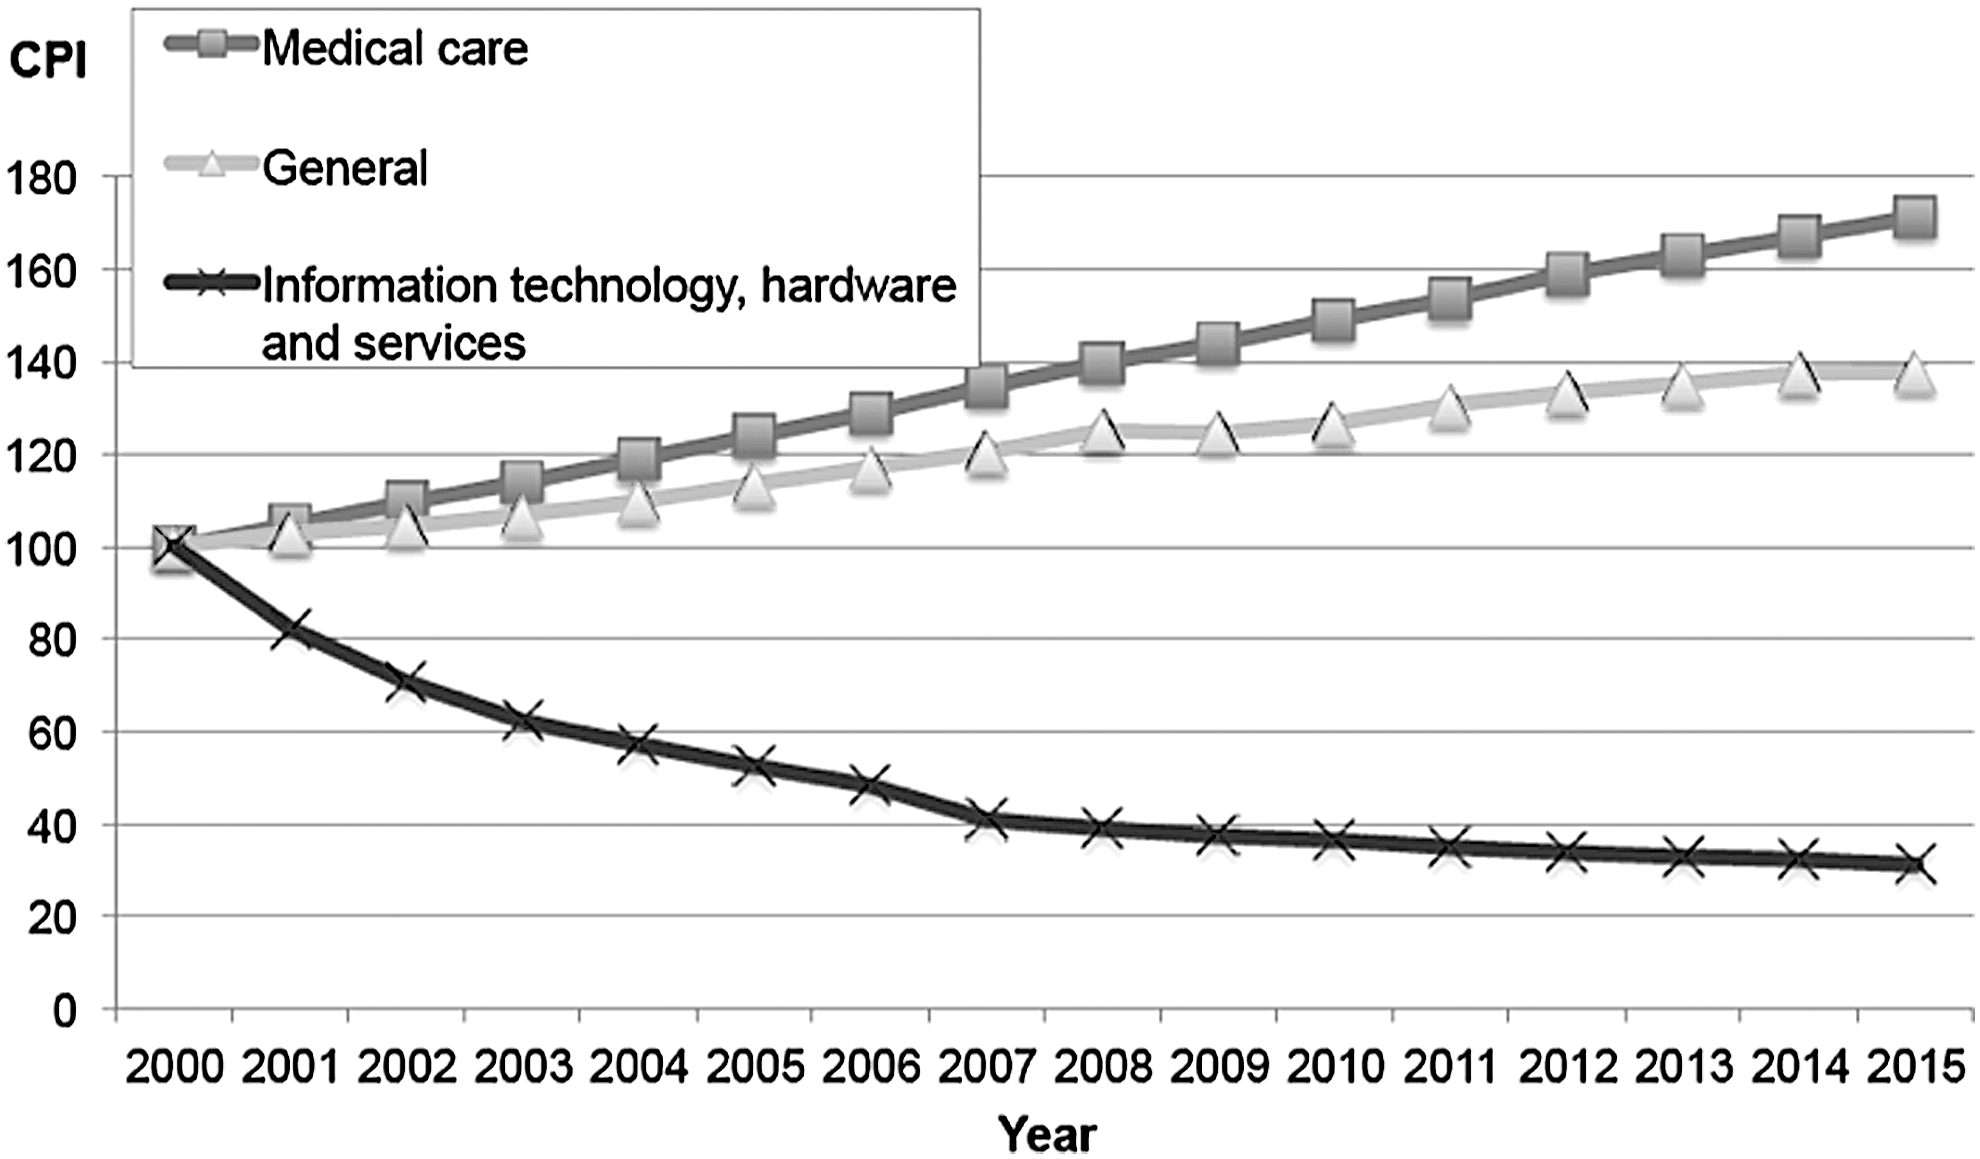
Time trends of the United States consumer price index (CPI) since 2000 (standardized to 100 as of 2000). 8
Materials and Methods
We conducted simulation analyses among a hypothetical adult ICU patient cohort (excluding patients younger or equal to 18 years of age) whose characteristics follow published literature, as described in our previous study. 5 The University of California, Davis, Institutional Review Board (IRB) reviewed the study protocol and waived a full IRB review (IRB ID: 625108-1).
Standard decision models were developed to estimate the ICER of tele-ICU care compared to ICU without telemedicine or adequate intensivist coverage, from the perspective of a healthcare system. These models adopted a time horizon of 5 years after ICU discharge and a set of assumptions derived from previous literature regarding tele-ICU impacts. 5 Specifically, tele-ICU was assumed to either decrease or increase per-patient per-hospital-stay ICU cost, decrease ICU mortality with its magnitude defined as a range, either decrease or increase floor mortality (among ICU survivors) after ICU discharge, and have no impact on any outcome after a hospital discharge. 5 These key assumptions on tele-ICU's impacts are kept for our new analyses presented later in this article (Appendix Table A1). To account for such uncertainties of tele-ICU's impacts, we conducted probabilistic CEAs with a Monte Carlo simulation, where all model parameters followed statistical distributions. 5 Probabilistic CEAs can examine how multiple parameters' uncertainties simultaneously affect ICER estimates. A Monte Carlo simulation estimates a mean and 95% confidence interval of ICERs among 1,000 iterations.
We also conducted the break-even analyses to estimate the cost benchmarks (i.e., maximum allowable cost) to achieve cost saving under tele-ICU. All decision models were constructed with TreeAge Pro 2013 software. In converting costs to U.S. 2014 dollars, we applied a medical care-specific CPI, 8 except for applying an IT-specific CPI for tele-ICU equipment installation costs.
The hypothetical tele-ICU was assumed to connect seven ICUs at six hospitals. The monitoring site was assumed to be located within one of the hospitals, including an ICU. Unlike our previous study, we conducted analyses where only a certain proportion of ICU patients were cared for using the tele-ICU model during the most typical operational hours (19/24 h for weekday/weekend). Nine hypothetical highest risk subpopulations were defined by the ICU severity-of-illness scoring system, the Acute Physiology and Chronic Health Evaluation IV (APACHE-IV), 10 whose proportions among all ICU patients ranged from 10% to 90% with a 10% increment. These subpopulations were assumed to have higher baseline values in per-patient ICU cost, ICU mortality, and floor mortality, compared to the average cost and mortality among the overall ICU patient population. 10,11 Subpopulation-specific ICU cost ratios were estimated by combining the ICU length of stay (LOS) predicted by APACHE-IV 11 and the ICU LOS-specific cost (detailed in Table 1 and Appendix Table A1). 12 The APACHE-IV (scored at the time of ICU admission) has a high efficacy to predict ICU LOS and ICU mortality, indicated by the small differences between mean observed and mean predicted ICU LOS (e.g., 1.9 h) 11 and a good discrimination, respectively. 10 Since ICU LOS is a good predictor for hospital costs, 12 the APACHE-IV has a high efficacy to predict the hospital cost as well. We assumed that the APACHE-IV scores used in these reference studies 10,11 are available without additional organizational costs/changes, although some ICUs not routinely collecting APACHE-IV measures will incur additional costs.
The Cost and Mortality of a Selected Highest-Risk Subpopulation in Intensive Care Unit
Defined by the ICU severity-of-illness scoring system, the Acute Physiology and Chronic Health Evaluation IV (APACHE-IV). The APACHE-IV (scored at the time of ICU admission) has a high efficacy to predict ICU length of stay (LOS) and ICU mortality, indicated by the small differences between mean observed and mean predicted ICU LOS (e.g., 1.9 h among all patients, and at most 0.5 days when comparing the deciles) 11 and by a good discrimination index of area under the receiver operating characteristic curve (0.88), respectively. 10 Since ICU LOS explains roughly 85–90% of interpatient variations in hospital costs, 12 the APACHE-IV has a high efficacy to predict the hospital cost as well.
Ratio compared to the reference case applying Tele-ICU for all (100%) ICU patients (bottom row).
For example, the average ICU/floor mortality rate among the 10% highest risk group is 4.7 times higher than the overall average of the entire ICU patient population.
Our detailed method for estimating ratios in this table is as follows:
Subpopulation-specific ratios of ICU mortality and floor mortality followed those of the hospital mortality for each decile defined by APACHE-IV. 10
Subpopulation-specific cost ratios were estimated by combining the ICU-LOS predicted by APACHE-IV 11 and the ICU-LOS-specific cost. 12 The former study reported that the ICU LOS for each decile (defined by APACHE-IV) were 1.40, 1.72, 1.93, 2.32, 2.70, 3.30, 4.04, 5.05, 6.71, and 9.40 [days]. 11 The latter study reported the per-patient per-day ICU cost ratios, compared to a per-patient per-day floor cost (between an ICU discharge and a hospital discharge). 12 We further estimated the weighted average of these reported ratios collected from two medical centers, based on the number of cases in these medical centers. The estimated cost ratios for ICU day 1, 2, 3, 4, 5, 6, 7, 8, and more than 8 were 4.99, 2.89, 2.74, 2.92, 2.74, 2.60, 2.70, 2.73, and 2.53, respectively. These ratios indicate that the per-patient per-day ICU cost tends to be constant except day 1 in ICU. When the average ICU-LOS for a decile was 1.40 days, we further calculated the decile-specific cost ratio as 6.15 = 4.99 (ICU day 1) plus 0.40 × 2.89 (ICU day 2).
Ratio compared to the reference case applying Tele-ICU for all (100%) ICU patients (bottom row).
For instance, the average per-patient ICU cost among the 10% highest risk group is 2.15 times higher than the overall average of the entire (100%) ICU patient population. The point estimate of ICU LOS was 3.86 days, following a large APACHE-LOS study. 11
The mean per-patient cost of “Urban Community Hospitals” is 66.7% of “Urban Tertiary Hospitals.” 13,14 The point estimate of ICU LOS was 2.32 days ( = 3.86 days × 0.6), following a large APACHE-LOS study 11 and the ratio of LOS of tele-ICU studies. 13,14 The methods to define hospital-type-specific LOS/cost parameters are detailed in Appendix Table A1.
The mean per-patient cost of “Rural Tertiary Hospitals” is 89.5% of “Urban Tertiary Hospitals.” 13 –15 The point estimate of ICU LOS was 3.36 days ( = 3.86 days × 0.87), following a large APACHE-LOS study 11 and the ratio of LOS of tele-ICU studies. 13 –15
The mean per-patient cost of “Rural Community Hospitals” is 60.0% of “Urban Tertiary Hospitals.” 13 –15 The point estimate of ICU LOS was 2.01 days ( = 3.86 days × 0.52), following a large APACHE-LOS study 11 and the ratio of LOS of tele-ICU studies. 13 –15
Although the ratios across 10 subgroups are the same for all 4 types of hospitals, the average morality rates (both ICU mortality rate and floor mortality rate) of “Urban Community Hospitals,” “Rural Tertiary Hospitals,” and “Rural Community Hospitals” are 75%, 60%, and 50% of “Urban Tertiary Hospitals,” respectively. 13 –15 Therefore, the point estimates of baseline ICU mortality/floor mortality rates were assumed as follows: Urban Tertiary Hospitals (9.14%/3.19%), Urban Community Hospitals (6.87%/2.39%), Rural Tertiary Hospitals (5.48%/1.91%), and “Rural Community Hospitals (4.58%/1.60%), also detailed in Appendix Table A1.
ICU, intensive care unit; Tele-ICU, telemedicine in the ICU.
Due to the limited literature, we assumed an “equal” impact of tele-ICU in terms of the “percentage changes” from the baseline per-patient ICU cost, ICU mortality, and floor mortality across all high-risk groups. Consequently, selected tele-ICU use among the higher risk populations leads to a “greater absolute reduction” in mortality and ultimately “greater absolute gains” in QALY per patient. Using the same logic, we expected a “greater absolute reduction” in the baseline per-patient ICU cost. While the “total” maintenance cost and clinical staffing cost for tele-ICU were assumed to increase proportionally as the number of patients increased, the tele-ICU equipment installation cost was assumed to be fixed regardless of the overall ICU volume. That is, “per-patient” tele-ICU equipment installation cost would be higher (per patient) when tele-ICU was applied to fewer patients. Consequently, selected tele-ICU use would have offsetting effects on smaller highest risk subpopulations, with higher per-patient tele-ICU equipment installation costs, but greater absolute reductions in baseline per-patient ICU cost. Because of these assumptions, we hypothesized a nonlinear U-shaped relationship between cost-effectiveness and selected tele-ICU use.
We conducted sensitivity analyses to examine how differences in patient clinical severity across hospitals affect the tele-ICU's economic efficiency. Since our key APACHE references collected data mostly in urban tertiary hospitals, our primary analysis is assumed to represent urban tertiary hospitals. Compared to this hospital type, the other hospital types (urban community, rural tertiary, and rural community) were assumed to have lower baseline ICU/floor mortality rates and a shorter ICU LOS based on the literature, as detailed in Table 1 and Appendix Table A1. 13 –15 For example, the baseline (point estimates of) ICU mortality without tele-ICU was assumed to be 9.14% in urban tertiary hospitals and 4.58–6.87% in other hospital types. In addition, selected tele-ICU use was assumed to have different impacts on cost ratios (for highest risk groups) across these hospitals types. For instance, the average per-patient ICU cost among the 10% highest risk group is 2.15 times higher than the overall average ICU patient population for urban tertiary hospitals, while this ratio ranges 2.06–2.13 in other hospitals (top row in Table 1). The average ICU/floor mortality among the 10% highest risk group is assumed to be 4.7 times higher than the overall average ICU patient population, which is equal for all hospital types.
Results
As hypothesized, our analyses found a monotonic negative association between the proportion of highest risk subpopulations and the incremental effectiveness of tele-ICU compared to conventional ICU care without telemedicine. Specifically, in the primary analysis, the incremental effectiveness of tele-ICU was 0.011 QALYs when tele-ICU was applied to 100% of ICU patients 5 and monotonically increased to 0.013, 0.026, and 0.055 QALYs as the proportion of highest risk populations declined from 100% to 90%, 40%, and 10%, respectively (Table 2). Conversely, we found a nonlinear U-shaped relationship between the proportion of highest risk subpopulations and the incremental cost of tele-ICU. That is, tele-ICU's incremental cost estimates were $2,331 for the 10% highest risk subpopulation, $514 for the 70% highest risk subpopulation, and $520 when tele-ICU was applied to the entire ICU population. Similar findings were observed for the other three hospital types (Appendix Tables A2–A4).
Cost-Effectiveness/Economic Efficiency of Telemedicine in Intensive Care Unit, Depending on the Selected Use of Telemedicine in Intensive Care Unit, for Primary Analysis (Urban Tertiary Hospitals)
Defined by the ICU severity-of-illness scoring system, the APACHE-IV.
Incremental cost: (per-patient per-hospital-stay cost, including ICU cost and tele-ICU cost) minus (per-patient per-hospital-stay cost, including ICU cost without using tele-ICU).
Incremental Effectiveness: (per-patient expected cumulative QALYs after discharge from hospital where tele-ICU was used) minus (per-patient expected cumulative QALYs after discharge from hospital where tele-ICU was not used).
The lower ICER values indicate that tele-ICU is more efficient in an economic sense. A health intervention would be considered cost-effective if its ICER estimate is below the common health policy threshold of $100,000 per QALY.
(2.5 percentile, 97.5 percentile) based on a probabilistic model (1,000 iterations).
Cost saving of tele-ICU compared to pre-tele-ICU without a telemedicine team, that is, tele-ICU dominates pre-tele-ICU without a telemedicine team.
All costs in U.S. 2014 Dollars.
ICER, incremental cost-effectiveness ratio = (incremental cost)/(incremental effectiveness); ICU, intensive care unit; QALY, quality-adjusted life year; Tele-ICU, telemedicine in the ICU.
Combining these estimates of incremental effectiveness and incremental cost, Figure 2 indicates the U-shaped association between the proportion of a highest risk population and tele-ICU's ICER for all four types of hospitals. For urban tertiary hospitals (primary analysis), the ICER was estimated to reach its minimum value of $25,392 per QALY when the proportion of highest risk population was 40%, nearly half of the ICER estimate of $50,265 when tele-ICU was used for all ICU patients (bottom curve in Fig. 2). Similarly, the ICER estimates took a minimum value when tele-ICU was used for 30% of the total population in urban community hospitals (ICER = $55,402), rural tertiary hospitals (ICER = $43,105), and rural community hospitals (ICER = $84,062), respectively (Fig. 2 and Table 3). ICER estimates tended to be lower for hospital types with a higher mortality rate, a longer ICU LOS, and a higher per-patient cost. All the ICER estimates in Figure 2 (i.e., mean values of probabilistic models) were considered cost-effective when employing a threshold of $100,000 per QALY, except applying more than 50% of the highest risk patients in rural community hospitals (Fig. 2).
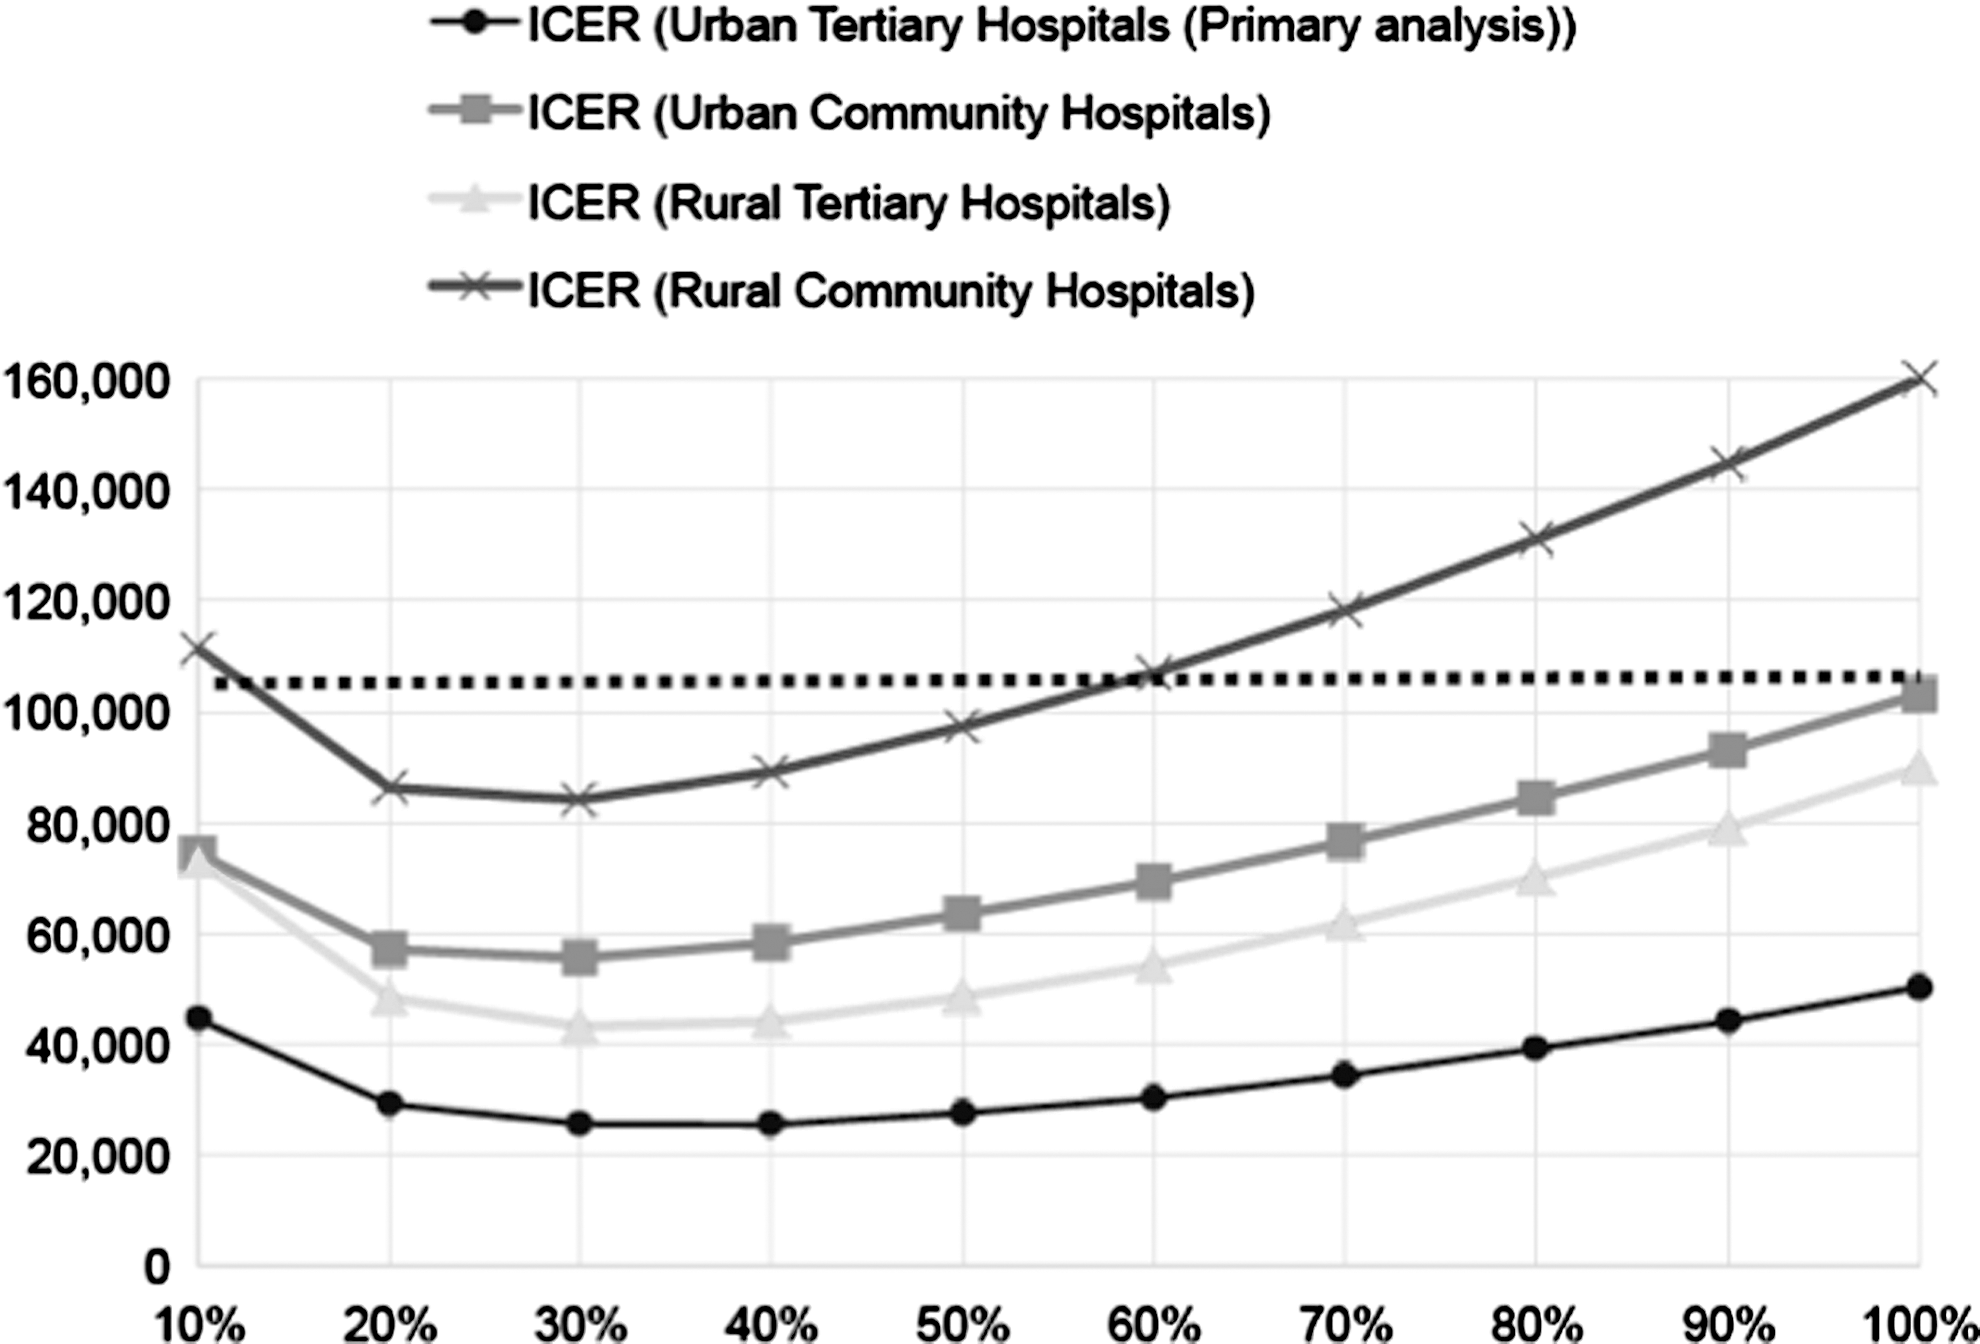
Cost-effectiveness/economic efficiency of telemedicine in ICU, depending on the selected use of telemedicine in ICU and the type of hospital. ICER, incremental cost-effectiveness ratio = (incremental cost)/(incremental effectiveness) based on probabilistic models. Y axis = ICER with the unit of [$ per QALY]. The lower ICER values indicate that tele-ICU is more efficient in an economic sense. A health intervention would be considered cost-effective if its ICER estimate is below the common health policy threshold of $100,000 per QALY (Horizontal dashed line). The detailed results are reported in Table 2. X axis = Proportion of highest risk ICU patients receiving tele-ICU, determined by the ICU scoring system, the Acute Physiology and Chronic Health Evaluation IV (APACHE-IV). All costs in U.S. 2014 Dollars. ICU, intensive care unit; QALY, quality-adjusted life year; tele-ICU, telemedicine in the ICU.
Cost-Effectiveness/Economic Efficiency of Telemedicine in Intensive Care Unit
Proportion of highest risk ICU patients receiving tele-ICU, determined by the ICU scoring system, the APACHE-IV.
The lower ICER values indicate that tele-ICU is more efficient in an economic sense. A health intervention would be considered cost-effective if its ICER estimate is below the common health policy threshold of $100,000 per QALY. The detailed results are reported in Table 2.
(2.5 percentile, 97.5 percentile) based on a probabilistic model (1,000 iterations).
More detailed simulation results are presented in Appendix Table A5.
Cost saving of tele-ICU compared to pre-tele-ICU without a telemedicine team, that is, tele-ICU dominates pre-tele-ICU without a telemedicine team.
All costs in U.S. 2014 Dollars.
APACHE-IV, Acute Physiology and Chronic Health Evaluation IV; CPI, consumer price index; ICER = (incremental cost)/(incremental effectiveness), compared to ICU without tele-ICU; ICU, intensive care unit; IT, information technology, hardware and services; QALY, quality adjusted life year; Tele-ICU, telemedicine in the intensive care unit.
In addition, for the primary analyses (urban tertiary hospitals), using tele-ICU for the 40% highest risk population increased the proportion of interactions being cost-effective (falling below the cost-effectiveness threshold of $100,000) from 66.8% (when using tele-ICU for all ICU patients) to 82.1% (far right column in Table 3). Likewise, this proportion for cost saving increased with a smaller magnitude, that is, from 37.2% to 40.5%. Similar findings were observed among other hospital types.
Table 3 also shows that the use of the IT-specific CPI moderately reduced an ICER ($39,867), compared to the primary analysis using the medical care CPI ($50,265). 5 This reduction was due to lower tele-ICU equipment installation costs, decreased by $61 per patient. In addition, Table 3 presents the further reduction in tele-ICU's ICER ($14,066 per QALY) when tele-ICU was used for the 40% highest risk subpopulation and the IT-specific CPI was applied simultaneously in the primary analysis.
Cost saving was achieved if tele-ICU could further reduce the cost by at least $577 per-patient per-hospital stay. Thus, cost saving was not feasible even if the tele-ICU equipment installation cost ($200–$348) was assumed to be $0 (Table 4). If other tele-ICU-related costs (excluding tele-ICU equipment installation cost) can be lowered from $700 to $132, cost saving is feasible. A more feasible option is to reduce all ICU medical care cost (excluding all telemedicine-related costs) by 8.6% (out of $14,035 per patient), while our models assumed 6% as a point estimate.
Break-Even Analyses to Achieve Cost Saving a for Primary Analysis (Urban Tertiary Hospitals)
Cost saving of tele-ICU compared to pre-tele-ICU without a telemedicine team, that is, tele-ICU dominates pre-tele-ICU without a telemedicine team.
Assuming 5-year depreciation, although this is a one-time cost occurring only at the time of equipment installation (i.e., year 1).
Including both staffing cost (clinical and IT staffing cost) and nonstaffing cost (hardware and software to maintain telemedicine) that will occur annually after the tele-ICU equipment installation and vary in proportion to ICU patient volume.
Tele-ICU can either increase or decrease the ICU medical care cost according to the past studies, as summarized in the previous study. 5
All costs in U.S. 2014 Dollars.
Tele-ICU, telemedicine in the intensive care unit.
Discussion
The selected use of tele-ICU based on patient severity of illness (APACHE-IV) is likely to improve its cost-effectiveness. We found that tele-ICU's economic efficiency was optimal when applied to patients in the 30–40% highest risk ICU population, depending on hospital types (rural/urban and tertiary/community). Our finding that tele-ICU was cost-effective in most cases is robust to different types of hospitals (except using tele-ICU for more than 50% of highest-risk patients in rural community hospitals) and different methods of adjusting cost inflation, and consistent with previous analyses. 5 Tele-ICU's economic efficiency tends to be higher for hospital types with a higher mortality rate and a higher per-patient cost. In addition, our break-even analyses indicated that cost saving seems more feasible if tele-ICU could reduce ICU medical care cost ($14,035 per patient, excluding all telemedicine-related costs) by $577, rather than lowering telemedicine-related costs ($909–$1057).
As described earlier, we could hypothesize a nonlinear U-shaped relationship between cost-effectiveness and selected tele-ICU use due to the offsetting impacts of applying tele-ICU to a smaller population, that is, higher per-patient tele-ICU equipment installation cost and greater absolute reductions in baseline per-patient ICU cost. However, the exact selection proportion (i.e., 30–40% in our case) for each hospital type is unpredictable without conducting simulation analyses. The general strength of a simulation analysis is to obtain those proportions before performing an actual intervention that takes more time and has a higher intervention cost. It seems reasonable that the adoption of tele-ICU is simulated to be more efficient for hospitals with higher proportions of severe patients.
The new assumption in costing methodology had a moderate impact on tele-ICU's cost-effectiveness. This result seems reasonable for a relatively small proportion of tele-ICU equipment installation (start-up) cost among total tele-ICU operation costs. Specifically, regarding the per-patient tele-ICU operation cost, our previous study assumed $938 as the likeliest value (of an assigned triangular distribution, ranging from $909 to $1,057). 5 Among this per-patient total tele-ICU operation costs, the equipment installation cost (depreciated over 5 years) and other operation costs were around 25% ($238) and 75% ($700), respectively. Applying the IT-specific CPI (instead of medical care-specific CPI), the equipment installation cost declined from $238 to $177. It should be noted that these cost estimates in our analyses were derived from the two studies using the most prevalent tele-ICU product in the United States (Phillips eICU), 13,16 while Fortis and associates used a different tele-ICU system and a cost unit of “per-ICU-bed per-year.” 9
Although APACHE IV is an established and widely used clinical measure, it has been overlooked in the costing literature on tele-ICU that may have limited our modeling. 13 Therefore, our assumptions concerning the uncertain tele-ICU impacts on clinical and financial outcomes need to be validated by future studies. These impacts may differ across high-risk subpopulations, which could either improve or worsen tele-ICU's cost-effectiveness compared to those estimated in our study.
This study is limited by the paucity of relevant health outcome data and the limited generalizability of cost data available from the most prevalent tele-ICU product in the United States (Phillips eICU). For instance, our models did not account for the distinction between planned and unplanned ICU admissions, the use of specific care pathways/protocols, ICU specialty, the unique characteristics of coronary artery bypass graft cases, the presence of a regional trauma unit, the inclusion/exclusion of patients admitted for less than 4 h, the utility trends regarding mental health and physical sequelae after ICU discharge, the uncertain efficacy of APACHE's predictability depending on patient characteristics not captured by our modeling, the indirect organization cost/changes for adopting tele-ICU and collecting APACHE-IV data, an evidence-based more generalizable tele-ICU organizational form, and the uncertainty of our assumptions about the equal tele-ICU impacts on all subpopulations.
Despite the limitations described earlier, this study is expected to help hospital decision-makers and clinicians improve health outcomes per dollar by focusing on clinically higher risk subpopulations. Although cost-effectiveness is one of the criteria used to determine tele-ICU use, our findings could justify the scoring of patients to receive tele-ICU, given other clinical criteria are met as well. The operational feasibility of such scoring should be examined in a future study.
In conclusion, a selected use of tele-ICU based on severity of illness is likely to improve tele-ICU's cost-effectiveness. To achieve cost saving, it seems more feasible to reduce ICU medical care cost, rather than lowering telemedicine-related costs alone.
Footnotes
Acknowledgments
B.K.Y. and M.K. were supported by funding from the Department of Public Health Sciences, University of California, Davis. The work was performed at the University of California, Davis.
Disclosure Statement
No competing financial interests exist.
Cost-Effectiveness/Economic Efficiency of Telemedicine in Intensive Care Unit, Depending on the Selected Use of Telemedicine in Intensive Care Unit, for Urban Community Hospitals
|
|
|
|
|
|
|
|
|---|---|---|---|---|---|---|
| 10 | ICU without telemedicine | $24,797 ($22,202, $27,075) | 0.607 (0.577, 0.637) | |||
| tele-ICU | $27,677 ($23,284, $32,008) | $2,880 (−$657, $6,324) | 0.648 (0.611, 0.684) | 0.041 (0.023, 0.059) | $74,270 (cost saving, f $186,329) | |
| 20 | ICU without telemedicine | $23,321 ($20,634, $25,568) | 0.705 (0.675, 0.736) | |||
| tele-ICU | $24,933 ($20,834, $29,156) | $1,612 (−$1,547, $4,766) | 0.735 (0.702, 0.770) | 0.030 (0.016, 0.044) | $57,086 (cost saving, f $191,125) | |
| 30 | ICU without telemedicine | $21,977 ($19,273, $24,173) | 0.766 (0.734, 0.797) | |||
| tele-ICU | $23,202 ($19,302, $27,237) | $1,225 (−$1,674, $4,177) | 0.789 (0.757, 0.823) | 0.024 (0.012, 0.035) | $55,402 (cost saving, f $213,339) | |
| 40 | ICU without telemedicine | $21,035 ($18,287, $23,176) | 0.809 (0.776, 0.841) | |||
| tele-ICU | $22,074 ($18,327, $25,922) | $1,039 (−$1,675, $3,861) | 0.828 (0.795, 0.862) | 0.019 (0.009, 0.029) | $58,138 (cost saving, f $240,438) | |
| 50 | ICU without telemedicine | $20,180 ($17,423, $22,278) | 0.840 (0.808, 0.873) | |||
| tele-ICU | $21,124 ($17,462, $24,854) | $944 (−$1,641, $3,599) | 0.856 (0.823, 0.890) | 0.016 (0.008, 0.024) | $63,352 (cost saving, f $275,877) | |
| 60 | ICU without telemedicine | $19,532 ($16,766, $21,615) | 0.863 (0.830, 0.896) | |||
| tele-ICU | $20,417 ($16,770, $24,056) | $885 (−$1,572, $3,420) | 0.877 (0.843, 0.911) | 0.014 (0.007, 0.021) | $69,277 (cost saving, f $309,709) | |
| 70 | ICU without telemedicine | $18,937 ($16,176, $21,019) | 0.880 (0.848, 0.914) | |||
| tele-ICU | $19,788 ($16,201, $23,330) | $851 (−$1,559, $3,322) | 0.892 (0.858, 0.927) | 0.012 (0.006, 0.018) | $76,373 (cost saving, f $341,208) | |
| 80 | ICU without telemedicine | $18,407 ($15,649, $20,467) | 0.894 (0.862, 0.928) | |||
| tele-ICU | $19,237 ($15,736, $22,765) | $831 (−$1,537, $3,242) | 0.905 (0.871, 0.940) | 0.011 (0.005, 0.016) | $84,401 (cost saving, f $382,372) | |
| 90 | ICU without telemedicine | $17,948 ($15,166, $19,998) | 0.906 (0.873, 0.940) | |||
| tele-ICU | $18,766 ($15,336, $22,235) | $818 (−$1,512, $3,180) | 0.916 (0.881, 0.950) | 0.010 (0.004, 0.015) | $93,040 (cost saving, f $427,092) | |
| 100 | ICU without telemedicine | $17,477 ($14,682, $19,508) | 0.916 (0.882, 0.951) | |||
| tele-ICU | $18,291 ($14,873, $21,698) | $815 (−$1,468, $3,117) | 0.925 (0.890, 0.960) | 0.009 (0.004, 0.013) | $103,080 (cost saving, f $475,551) |
Defined by the ICU severity-of-illness scoring system, the APACHE-IV.
Incremental cost: (per-patient per-hospital-stay cost, including ICU cost and tele-ICU cost) minus (per-patient per-hospital-stay cost, including ICU cost without using tele-ICU).
Incremental effectiveness: (per-patient expected cumulative QALYs after discharge from hospital where tele-ICU was used) minus (per-patient expected cumulative QALYs after discharge from hospital where tele-ICU was not used).
The lower ICER values indicate that tele-ICU is more efficient in an economic sense. A health intervention would be considered cost-effective if its ICER estimate is below the common health policy threshold of $100,000 per QALY.
(2.5 percentile, 97.5 percentile) based on a probabilistic model (1,000 iterations).
Cost saving of tele-ICU compared to pre-tele-ICU without a telemedicine team, that is, tele-ICU dominates pre-tele-ICU without a telemedicine team.
All costs in U.S. 2014 Dollars.
APACHE-IV, Acute Physiology and Chronic Health Evaluation IV; ICER, incremental cost-effectiveness ratio = (incremental cost)/(incremental effectiveness); ICU, intensive care unit; QALY, quality adjusted life year; Tele-ICU, telemedicine in the intensive care unit.
Cost-Effectiveness/Economic Efficiency of Telemedicine in Intensive Care Unit, Depending on the Selected Use of Telemedicine in Intensive Care Unit, for Rural Tertiary Hospitals
|
|
|
|
|
|
|
|
|---|---|---|---|---|---|---|
| 10 | ICU without telemedicine | $32,412 ($29,281, $35,097) | 0.681 (0.649, 0.714) | |||
| tele-ICU | $34,659 ($29,076, $40,225) | $2,247 (−$2,367, $6,733) | 0.714 (0.677, 0.750) | 0.033 (0.017, 0.048) | $73,062 (cost saving, f $253,290) | |
| 20 | ICU without telemedicine | $29,778 ($26,784, $32,332) | 0.763 (0.731, 0.795) | |||
| tele-ICU | $30,863 ($25,868, $35,970) | $1,084 (−$3,044, $5,136) | 0.787 (0.753, 0.822) | 0.024 (0.012, 0.036) | $48,240 (cost saving, f $257,677) | |
| 30 | ICU without telemedicine | $27,734 ($24,794, $30,203) | 0.812 (0.779, 0.846) | |||
| tele-ICU | $28,494 ($23,842, $33,364) | $761 (−$2,985, $4,476) | 0.831 (0.797, 0.866) | 0.019 (0.009, 0.028) | $43,105 (cost saving, f $280,914) | |
| 40 | ICU without telemedicine | $26,181 ($23,228, $28,567) | 0.847 (0.814, 0.881) | |||
| tele-ICU | $26,809 ($22,382, $31,401) | $628 (−$2,851, $4,045) | 0.863 (0.829, 0.897) | 0.015 (0.007, 0.023) | $43,944 (cost saving, f $324,800) | |
| 50 | ICU without telemedicine | $24,795 ($21,843, $27,114) | 0.873 (0.839, 0.906) | |||
| tele-ICU | $25,372 ($21,143, $29,755) | $577 (−$2,683, $3,849) | 0.885 (0.851, 0.921) | 0.013 (0.006, 0.020) | $48,456 (cost saving, f $365,397) | |
| 60 | ICU without telemedicine | $23,721 ($20,816, $26,009) | 0.891 (0.857, 0.925) | |||
| tele-ICU | $24,274 ($20,225, $28,478) | $553 (−$2,496, $3,683) | 0.902 (0.868, 0.937) | 0.011 (0.005, 0.017) | $54,192 (cost saving, f $407,242) | |
| 70 | ICU without telemedicine | $22,736 ($19,825, $24,985) | 0.905 (0.872, 0.939) | |||
| tele-ICU | $23,287 ($19,350, $27,343) | $551 (−$2,346, $3,537) | 0.915 (0.880, 0.950) | 0.010 (0.005, 0.015) | $61,879 (cost saving, f $449,392) | |
| 80 | ICU without telemedicine | $21,973 ($19,055, $24,218) | 0.917 (0.883, 0.951) | |||
| tele-ICU | $22,523 ($18,640, $26,494) | $550 (−$2,268, $3,424) | 0.925 (0.890, 0.961) | 0.009 (0.004, 0.013) | $69,980 (cost saving, f $491,641) | |
| 90 | ICU without telemedicine | $21,315 ($18,393, $23,541) | 0.926 (0.892, 0.961) | |||
| tele-ICU | $21,869 ($18,085, $25,738) | $554 (−$2,166, $3,319) | 0.934 (0.899, 0.969) | 0.008 (0.004, 0.012) | $78,903 (cost saving, f $538,574) | |
| 100 | ICU without telemedicine | $20,648 ($17,752, $22,832) | 0.934 (0.899, 0.969) | |||
| tele-ICU | $21,215 ($17,522, $24,964) | $567 (−$2,042, $3,206) | 0.941 (0.906, 0.976) | 0.007 (0.003, 0.011) | $89,822 (cost saving, f $585,315) |
Defined by the ICU severity-of-illness scoring system, the APACHE-IV.
Incremental cost: (per-patient per-hospital-stay cost, including ICU cost and tele-ICU cost) minus (per-patient per-hospital-stay cost, including ICU cost without using tele-ICU).
Incremental Effectiveness: (per-patient expected cumulative QALYs after discharge from hospital where tele-ICU was used) minus (per-patient expected cumulative QALYs after discharge from hospital where tele-ICU was not used).
The lower ICER values indicate that tele-ICU is more efficient in an economic sense. A health intervention would be considered cost-effective if its ICER estimate is below the common health policy threshold of $100,000 per QALY.
(2.5 percentile, 97.5 percentile) based on a probabilistic model (1,000 iterations).
Cost saving of tele-ICU compared to pre-tele-ICU without a telemedicine team, that is, tele-ICU dominates pre-tele-ICU without a telemedicine team.
All costs in U.S. 2014 Dollars.
APACHE-IV, Acute Physiology and Chronic Health Evaluation IV; ICER = (incremental cost)/(incremental effectiveness); ICU, intensive care unit; QALY, quality adjusted life year; Tele-ICU, telemedicine in the intensive care unit.
Cost-Effectiveness/Economic Efficiency of Telemedicine in Intensive Care Unit, Depending on the Selected Use of Telemedicine in Intensive Care Unit, for Rural Community Hospitals
|
|
|
|
|
|
|
|
|---|---|---|---|---|---|---|
| 10 | ICU without telemedicine | $23,769 ($21,015, $26,136) | 0.732 (0.700, 0.766) | |||
| tele-ICU | $26,592 ($22,306, $30,826) | $2,823 (−$415, $6,095) | 0.760 (0.723, 0.797) | 0.027 (0.014, 0.040) | $111,166 (cost saving, f $284,163) | |
| 20 | ICU without telemedicine | $22,186 ($19,377, $24,466) | 0.802 (0.769, 0.836) | |||
| tele-ICU | $23,784 ($19,823, $27,851) | $1,598 (−$1,289, $4,610) | 0.822 (0.788, 0.857) | 0.020 (0.010, 0.030) | $86,169 (cost saving, f $290,387) | |
| 30 | ICU without telemedicine | $20,957 ($18,128, $23,162) | 0.844 (0.810, 0.878) | |||
| tele-ICU | $22,180 ($18,416, $26,074) | $1,223 (−$1,479, $4,013) | 0.859 (0.824, 0.894) | 0.016 (0.008, 0.024) | $84,062 (cost saving, f $316,500) | |
| 40 | ICU without telemedicine | $20,039 ($17,211, $22,194) | 0.873 (0.839, 0.907) | |||
| tele-ICU | $21,089 ($17,372, $24,847) | $1,049 (−$1,470, $3,660) | 0.886 (0.851, 0.922) | 0.013 (0.006, 0.019) | $89,113 (cost saving, f $367,475) | |
| 50 | ICU without telemedicine | $19,301 ($16,477, $21,431) | 0.895 (0.861, 0.929) | |||
| tele-ICU | $20,257 ($16,630, $23,919) | $956 (−$1,487, $3,467) | 0.905 (0.871, 0.941) | 0.011 (0.005, 0.016) | $97,234 (cost saving, f $410,076) | |
| 60 | ICU without telemedicine | $18,683 ($15,866, $20,790) | 0.910 (0.876, 0.945) | |||
| tele-ICU | $19,585 ($16,038, $23,153) | $902 (−$1,492, $3,339) | 0.919 (0.884, 0.954) | 0.009 (0.004, 0.014) | $106,919 (cost saving, f $467,465) | |
| 70 | ICU without telemedicine | $18,121 ($15,314, $20,216) | 0.922 (0.888, 0.957) | |||
| tele-ICU | $18,902 ($15,485, $22,503) | $871 (−$1,475, $3,254) | 0.930 (0.895, 0.966) | 0.008 (0.004, 0.012) | $118,300 (cost saving, f $529,607) | |
| 80 | ICU without telemedicine | $17,623 ($14,825, $19,688) | 0.932 (0.897, 0.967) | |||
| tele-ICU | $18,476 ($15,007, $21,935) | $853 (−$1,435, $3,169) | 0.939 (0.904, 0.974) | 0.007 (0.003, 0.011) | $131,051 (cost saving, f $595,347) | |
| 90 | ICU without telemedicine | $17,193 ($14,375, $19,258) | 0.939 (0.905, 0.975) | |||
| tele-ICU | $18,034 ($14,646, $21,499) | $842 (−$1,395, $3,087) | 0.946 (0.911, 0.981) | 0.006 (0.003, 0.010) | $144,705 (cost saving, f $663,220) | |
| 100 | ICU without telemedicine | $16,754 ($13,909, $18,804) | 0.946 (0.911, 0.982) | |||
| tele-ICU | $17,594 ($14,247, $21,017) | $839 (−$1,344, $3,035) | 0.952 (0.916, 0.987) | 0.006 (0.003, 0.009) | $160,384 (cost saving, f $737,381) |
Defined by the ICU severity-of-illness scoring system, the APACHE-IV.
Incremental cost: (per-patient per-hospital-stay cost, including ICU cost and tele-ICU cost) minus (per-patient per-hospital-stay cost, including ICU cost without using tele-ICU).
Incremental effectiveness: (per-patient expected cumulative QALYs after discharge from hospital where tele-ICU was used) minus (per-patient expected cumulative QALYs after discharge from hospital where tele-ICU was not used).
The lower ICER values indicate that tele-ICU is more efficient in an economic sense. A health intervention would be considered cost-effective if its ICER estimate is below the common health policy threshold of $100,000 per QALY.
(2.5 percentile, 97.5 percentile) based on a probabilistic model (1,000 iterations).
Cost saving of tele-ICU compared to pre-tele-ICU without a telemedicine team, that is, tele-ICU dominates pre-tele-ICU without a telemedicine team.
All costs in U.S. 2014 Dollars.
APACHE-IV, Acute Physiology and Chronic Health Evaluation IV; ICER = (incremental cost)/(incremental effectiveness); ICU, intensive care unit; QALY, quality adjusted life year; Tele-ICU, telemedicine in the intensive care unit.
Cost-Effectiveness/Economic Efficiency of Telemedicine in Intensive Care Unit
|
|
|
|
|
|||||||
|---|---|---|---|---|---|---|---|---|---|---|
|
|
|
|
|
|
|
|
|
|
||
|
|
|
|
|
|
|
|
|
|||
| Proportion of ICERs b among 1,000 simulation iterations | ||||||||||
| Cost-saving c (% among 1,000 iterations) | 37.2 | 40.8 | 40.5 | 43.9 | 24.5 | 22.0 | 35.1 | 36.3 | 23.3 | 20.5 |
| ICER = <$100,000 per QALY (including the interactions of cost saving; % among 1,000 iterations) | 66.8 | 68.0 | 82.1 | 85.5 | 52.3 | 74.5 | 54.0 | 68.9 | 42.8 | 59.5 |
Proportion of highest risk ICU patients receiving tele-ICU, determined by the ICU scoring system, the APACHE-IV.
The lower ICER values indicate that tele-ICU is more efficient in an economic sense. A health intervention would be considered cost-effective if its ICER estimate is below the common health policy threshold of $100,000 per QALY. The detailed results are reported in Table 2.
Cost saving of tele-ICU compared to pre-tele-ICU without a telemedicine team, that is, tele-ICU dominates pre-tele-ICU without a telemedicine team.
APACHE-IV, Acute Physiology and Chronic Health Evaluation IV; CPI, consumer price index; ICER = (incremental cost)/(incremental effectiveness), compared to ICU without tele-ICU; ICU, intensive care unit; IT, information technology, hardware and services; QALY, quality adjusted life year; Tele-ICU, telemedicine in the intensive care unit.