
Abstract
Introduction:
As Internet bandwidth has risen, resulting in an exponential increase in the amount of data, one of the challenges is to transform large amounts of unstructured health data into legible information through visualization techniques to facilitate the decision-making between the telehealth managers. Traditionally, data visualization has been two-dimensional (2D), but it is often difficult to visualize and interpret when making decisions with multidimensional data. Three-dimensional (3D) visualization techniques are emerging to address this issue. This study aims to investigate and demonstrate the hypothesis that the use of 3D techniques for information visualization is more effective than some 2D visualization techniques. Hypothesis validation was performed with a usability methodology analyzing of the time, efficiency, effectiveness, and mental workload required in the execution of a task with a developed prototype.
Materials and Methods:
A random sample of telehealth professionals was used. Data were collected through observation and usability questionnaires, including the NASA Task Load Index (TLX) mental workload protocol. Data analysis was based on quantitative and qualitative approaches.
Results:
The study showed that mental workload, despite the time of task execution and effectiveness of the prototype, with 3D technique was less than the 2D technique. The 3D technique required less mental effort than the 2D technique.
Conclusions:
The 3D environment supports the service manager to verify the telehealth quality of service toward the features provided by 3D environment, especially, its capability to identify trends, clusters of interest, and perform indicators comparison.
Introduction
Internet traffic is growing rapidly, giving users the access to more information and knowledge than ever before. In many cases, these data are unstructured, which makes it increasingly difficult for the user to view, to understand, and to find the right data to support decision-making. 1,2 Sometimes, the data are not meaningful, making it difficult to identify and retrieve.
It can be difficult to extract and view information from large quantities of raw data. In some cases, it is necessary to use a tool that will transform the data into information, offered by visualization. There are some visualization tools that use techniques with two-dimensional (2D) interfaces to view data representation, but these 2D interface techniques are not always effective when they represent multidimensional data.
Healthcare managers have a challenge in the interpretation of several multidimensional indicators to find trends and anomalies solutions in 2D representation of multidimensional data. Cognitive processes can be overwhelmed when the information volume collected about indicators generated is large or when the number of variables to be analyzed is higher than two. 3 In this case, the cognitive processes will require greater awareness and mental workload to understand the meaning of the data.
In addition to cognitive factors, it is difficult to display a data set of three or more dimensions in a 2D screen or on a piece of paper without difficulty in seeing and interpreting data. 4 2D traditional visualization techniques do not clearly show all the details of the data and also are not designed correctly to make noticeable trends that are not visible others ways. 5
Visualization techniques with three-dimensional (3D) interfaces arose as a way to solve the problem of visualizing large amounts of multidimensional data. 6 –8 These new 3D techniques allow finding solutions to problems requiring great mental workload, especially when all the details of the data will be displayed and exploited. 3 3D technique adds dimension “Z” that allows rotating the data structure, generating a new view and adding more information in the depth graph. 9,10
Problems with 3D Interfaces
Despite all improvements in recent years, 3D visualization techniques are limited and also have problems in the Human–Computer interaction. One of the problems is associated with cognitive factors related to spatial navigation in 3D environments, 11 often caused by the discrepancy of using 2D screens and 2D input devices to interact with a 3D world. 12
Other problems with interfaces of 3D visualization techniques are interactivity and user adaptation to the 3D environment. Executing actions inside 3D environments requires more efforts than for 2D technologies. 13 –15 In addition to these problems, some interactions with 3D interfaces are limited, such as the ability to rotate an object virtually without becoming disoriented. Another problem that occurs in 3D interfaces is that objects in the 3D environment can be occluded by other object, making it hard to choose the best viewing perspective. 16
Comparative Studies Between 2D And 3D Techniques
There are few relevant comparative studies 10,17,18 related to effectiveness, efficiency, and mental workload on the use of 2D and 3D interfaces for visualizing large amounts of data. Hasbrouck 17 in his research did an experiment with 30 students to validate the hypothesis that the 2D interfaces produce faster results, more accurate for image rotation, and better space localization than 3D interfaces. The experimental results supported the hypothesis that the 2D interface was the best for decision-making when it comes to tasks to identify an object's position. In contrast, the 3D interface was for making decisions regarding an object's shape. In relationship to mental workload, the results were higher for the tasks in 2D interface than the 3D interface.
Another study by Foo et al. 18 assessed the mental workload in conducting a viewing task of three anatomical structures—gallbladder, celiac trunk, and superior mesenteric artery with 2D and 3D techniques through an experiment with 25 first-year medical students. The variables used for the evaluation were accuracy and time. The evaluation protocol of mental workload, NASA's Task Load Index (TLX), was used as a subjective measure. The results showed that participants who performed the tasks in the 3D environment had more precision in locating objects and lower mental workload. The results of this study may be useful for curriculum planning in anatomy teaching, improving the training procedures for surgeons.
In relationship to data visualization, Seipel and Carvalho 19 conducted a study that investigated the comparison between viewing 2D and 3D techniques for presenting bar graphs on geographical maps. The study was conducted through an experiment with 18 participants who viewed the data in 25 different situations. The variables of comparative analysis were time, accuracy, learning, and personal skills. Regarding the accuracy and learning, results indicated no significant difference between the two techniques. In contrast, the time spent performing the task with the 2D technique was greater than with the 3D technique. Visual discomfort was reported by nearly half of the participants, but the performance was not affected. The study also showed that experienced participants did not benefit from the use of 3D visualization in relationship to inexperienced participants.
Faced with the context described above, this article aims to analyze the time, efficiency, effectiveness, and mental workload to visualize indicators through an interface with 3D visualization technique developed by Campos Filho et al. 20 compared with the 2D technique.
Methods
The methodology used to conduct and reach the study goal was a quantitative methodology. The data were collected through a case study involving telehealth professionals. The instruments used to collect data were analyses of time recordings of tasks and a questionnaire based on the NASA-TLX protocol.
Participants
User analysis indicated a sample size of 30. This sample was composed of telehealth professionals between 18 and 62 years of age. The condition to participate in the study is that users work with telehealth system.
Dataset
A dataset, collected from the Telehealth system in Pernambuco called HealthNet, was used. This dataset contains telehealth data from the teleconsulting and telemedicine services in healthcare. The dataset includes several attributes as follows: telehealth unit name, status, telehealth center associated, membership type, city, Regional Health Management (GERES), National Register of Health Centers (CNES), and indicators such as: percentage of treatment changing, teleconsultations requested and answered, requester satisfaction, doctor referrals avoided, connectivity, team, professionals, performed training, and staff turnover.
Usability Evaluation
The usability evaluation aimed to find a significant difference between the scores of participants in the use of 3D and 2D techniques. Four measures were used to evaluate the usability: the time spent performing the task, the effectiveness in accomplishing the task, efficiency in performing the task, and a subjective assessment of mental workload.
Evaluation Setup
The evaluation was held at the Telehealth Center of Clinical Hospital in Federal University of Pernambuco from September to November 2013. A mental workload evaluation was conducted involving a sample of the population composed by 30 random users from 18 to 62 years of age.
During the evaluation, the participants were invited to perform these three tasks: 1. In the telehealth system, go to the option management system and identify the quantity and the names of teleconsulting that did not answer the second opinion in the time. 2. In the telehealth system, go to the option management system and identify which area of professional work is the teleconsulting that had the shortest time in answer to the second opinion request. 3. In the telehealth system, go to the option management system and identify which family health unit had the highest quantity of requests for second opinions in the last 6 months. Among these requests, which were answered within a short period of time.
Instrument
The instrument used to evaluate the mental workload was the NASA-TLX protocol. 21 This protocol is a multidimensional assessment procedure that calculates the overall score of the mental workload based on a weighted average of the scores for the six subfactors of the scale: Mental Demand, Physical Demand, Temporal Demand, Performance, Effort, and Frustration. This process consists of two parts. In the first part, the participants assessed the magnitude of each of six subfactors. Each participant was oriented to evaluate on the scale from 0 (worse) to 100 (better), the impact observed in each subfactor, during performing the task through a single question.
In the second part, the subfactors are weighted according to answers on a questionnaire. For this, subfactors are paired and participants must indicate which one had more impact stress. The six subfactors were combined to form a total of 15 pairs. The results are weighted according to the total number of chosen subfactors in each comparison. The goal is to measure the most significant factor affecting mental workload. This action is justified by the fact that subfactors have different impacts on people. 21
Besides the NASA-TLX protocol questionnaire, direct observation of the participants was used to collect the time and to calculate the effectiveness and efficiency in performing the task.
Procedure
Evaluation procedure had two moments. When participants arrived for evaluation, they had a 5 min introduction to the evaluation goals, tasks to be performed and an explanation of the scenario, in which the tasks would be performed. After the introduction to the usability evaluation, they had 5 min to complete a questionnaire about demographics and any previous experience in visualizing information to measure their initial knowledge. Once participants indicated that they understood the experiment goals, the functionality of the 3D system was demonstrated by performing an example task. They were then introduced to three tasks that they should perform.
After the task explanation, participants were given the first task to be performed. Instructions for all tasks are available at all times in case participants failed to remember how to perform a task. While performing the tasks, the computer screens were recorded to later analyze the interactivity with the 3D technique. The participants had a maximum of 10 min to finish each task. Once participants finished the three tasks using the 3D system, they filled out the usability and mental workload questionnaire.
After finishing mental workload questionnaire for the 3D technique, the functionality of the 2D system was demonstrated by performing an example task. The participants performed the 2D technique and completed mental workload questionnaire with the same three tasks, but other different dataset to be analyzed and compared with 3D technique. During the performance of the tasks, we recorded the computer screens to check and analyze the interactivity with the 2D technique.
The 3D technique was performed first because 3D was the technique that was the main research object to be analyzed, but the tasks were performed with different dataset.
Data Analysis
To analyze the data, R-free software was used under the terms of the Free Software Foundation's GNU General Public License in source code form. R is a language and environment for statistical computing and graphics.
Initially, descriptive statistics were calculated (average, standard deviation, frequency, and percentage) to identify the profile and characteristic of the group for each system. After this, the Student's T test was applied with 95% confidence interval to determine if the mean of the values obtained in 2D and 3D techniques affected the participants' perceived mental workload.
Results
Users who participated in the assessment of mental workload were the same who participated in the usability evaluation of the 3D interface. The mean values of the weighted global rate of mental workload obtained from the results of the NASA-TLX questionnaire for the 2D and 3D systems are displayed in Figure 1.
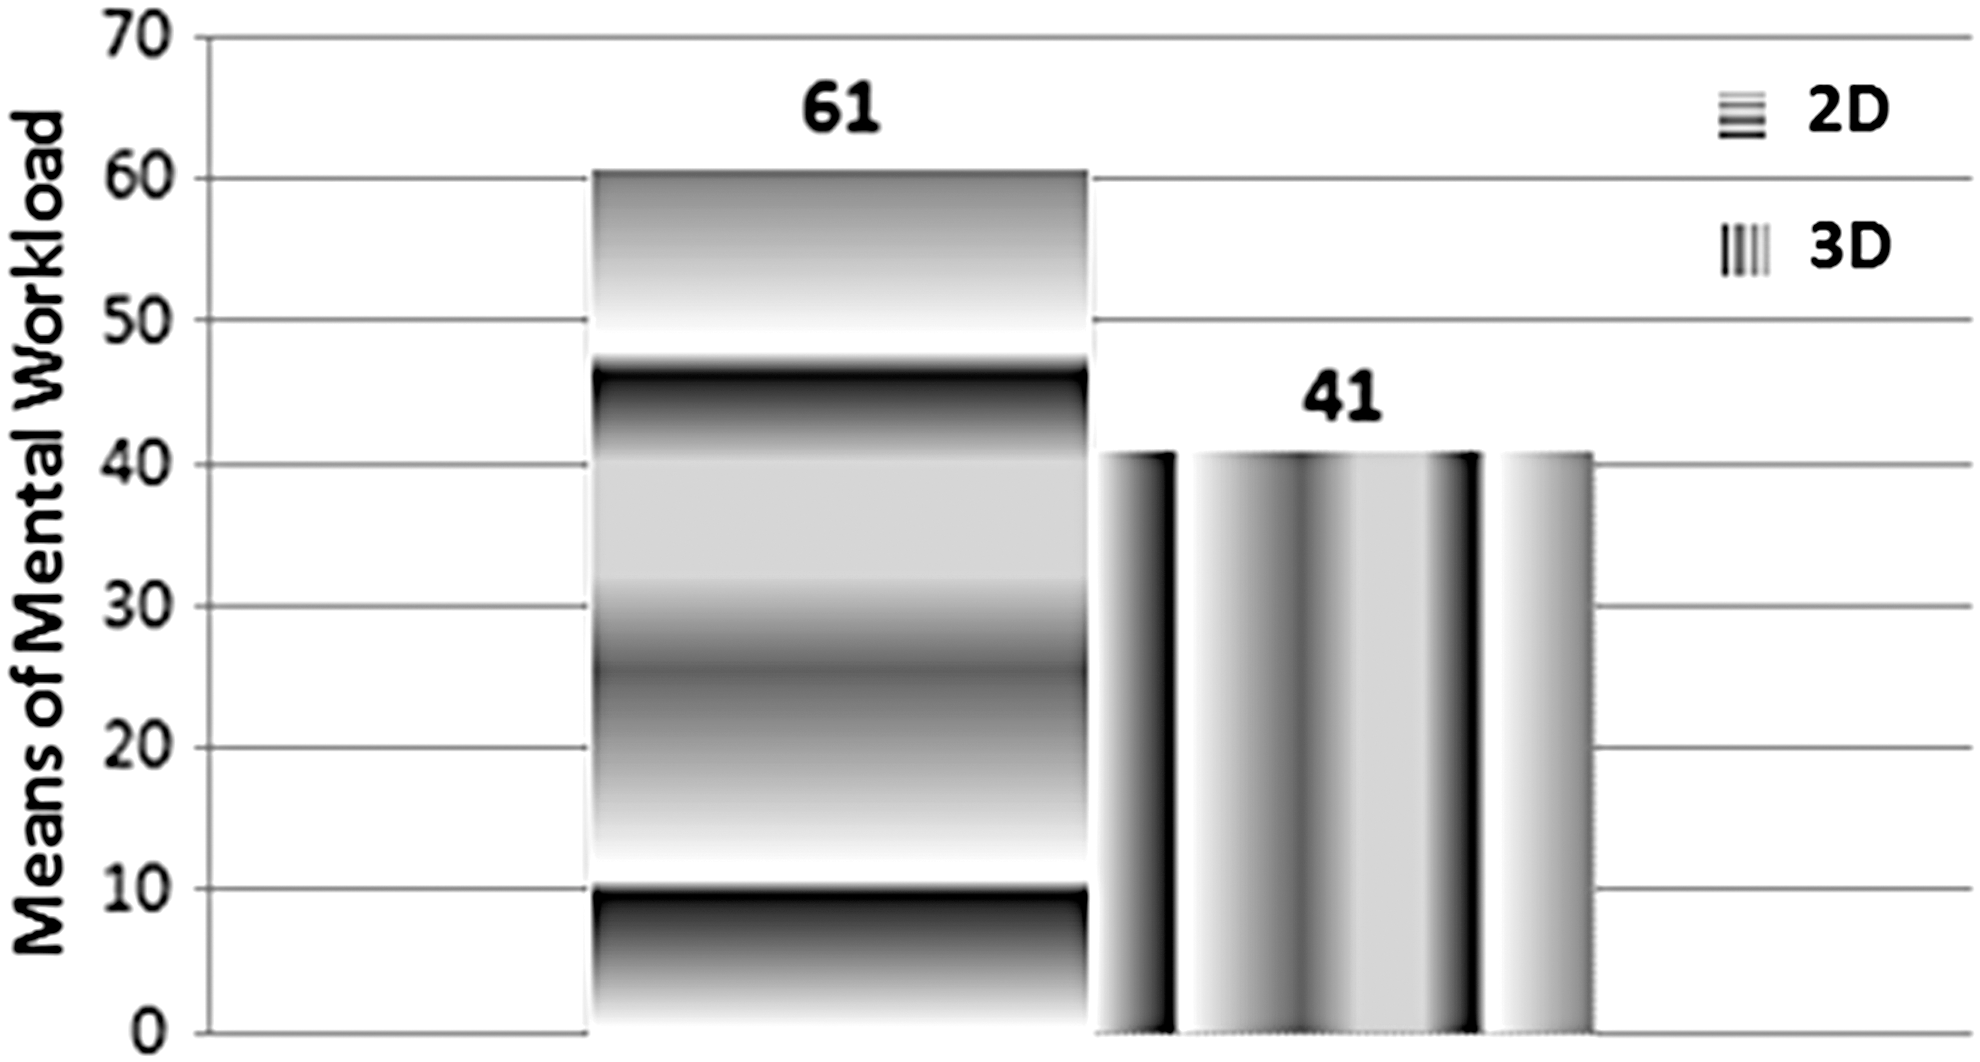
Mean of global rate weighted.
According to Figure 1, the mental workload of the participants performing tasks with the 2D technique was significantly higher than with the 3D technique (p = 1.232e-06, p < 0.05). Besides that, each subfactor composing the calculation of overall mental workload was analyzed separately (Fig. 2).
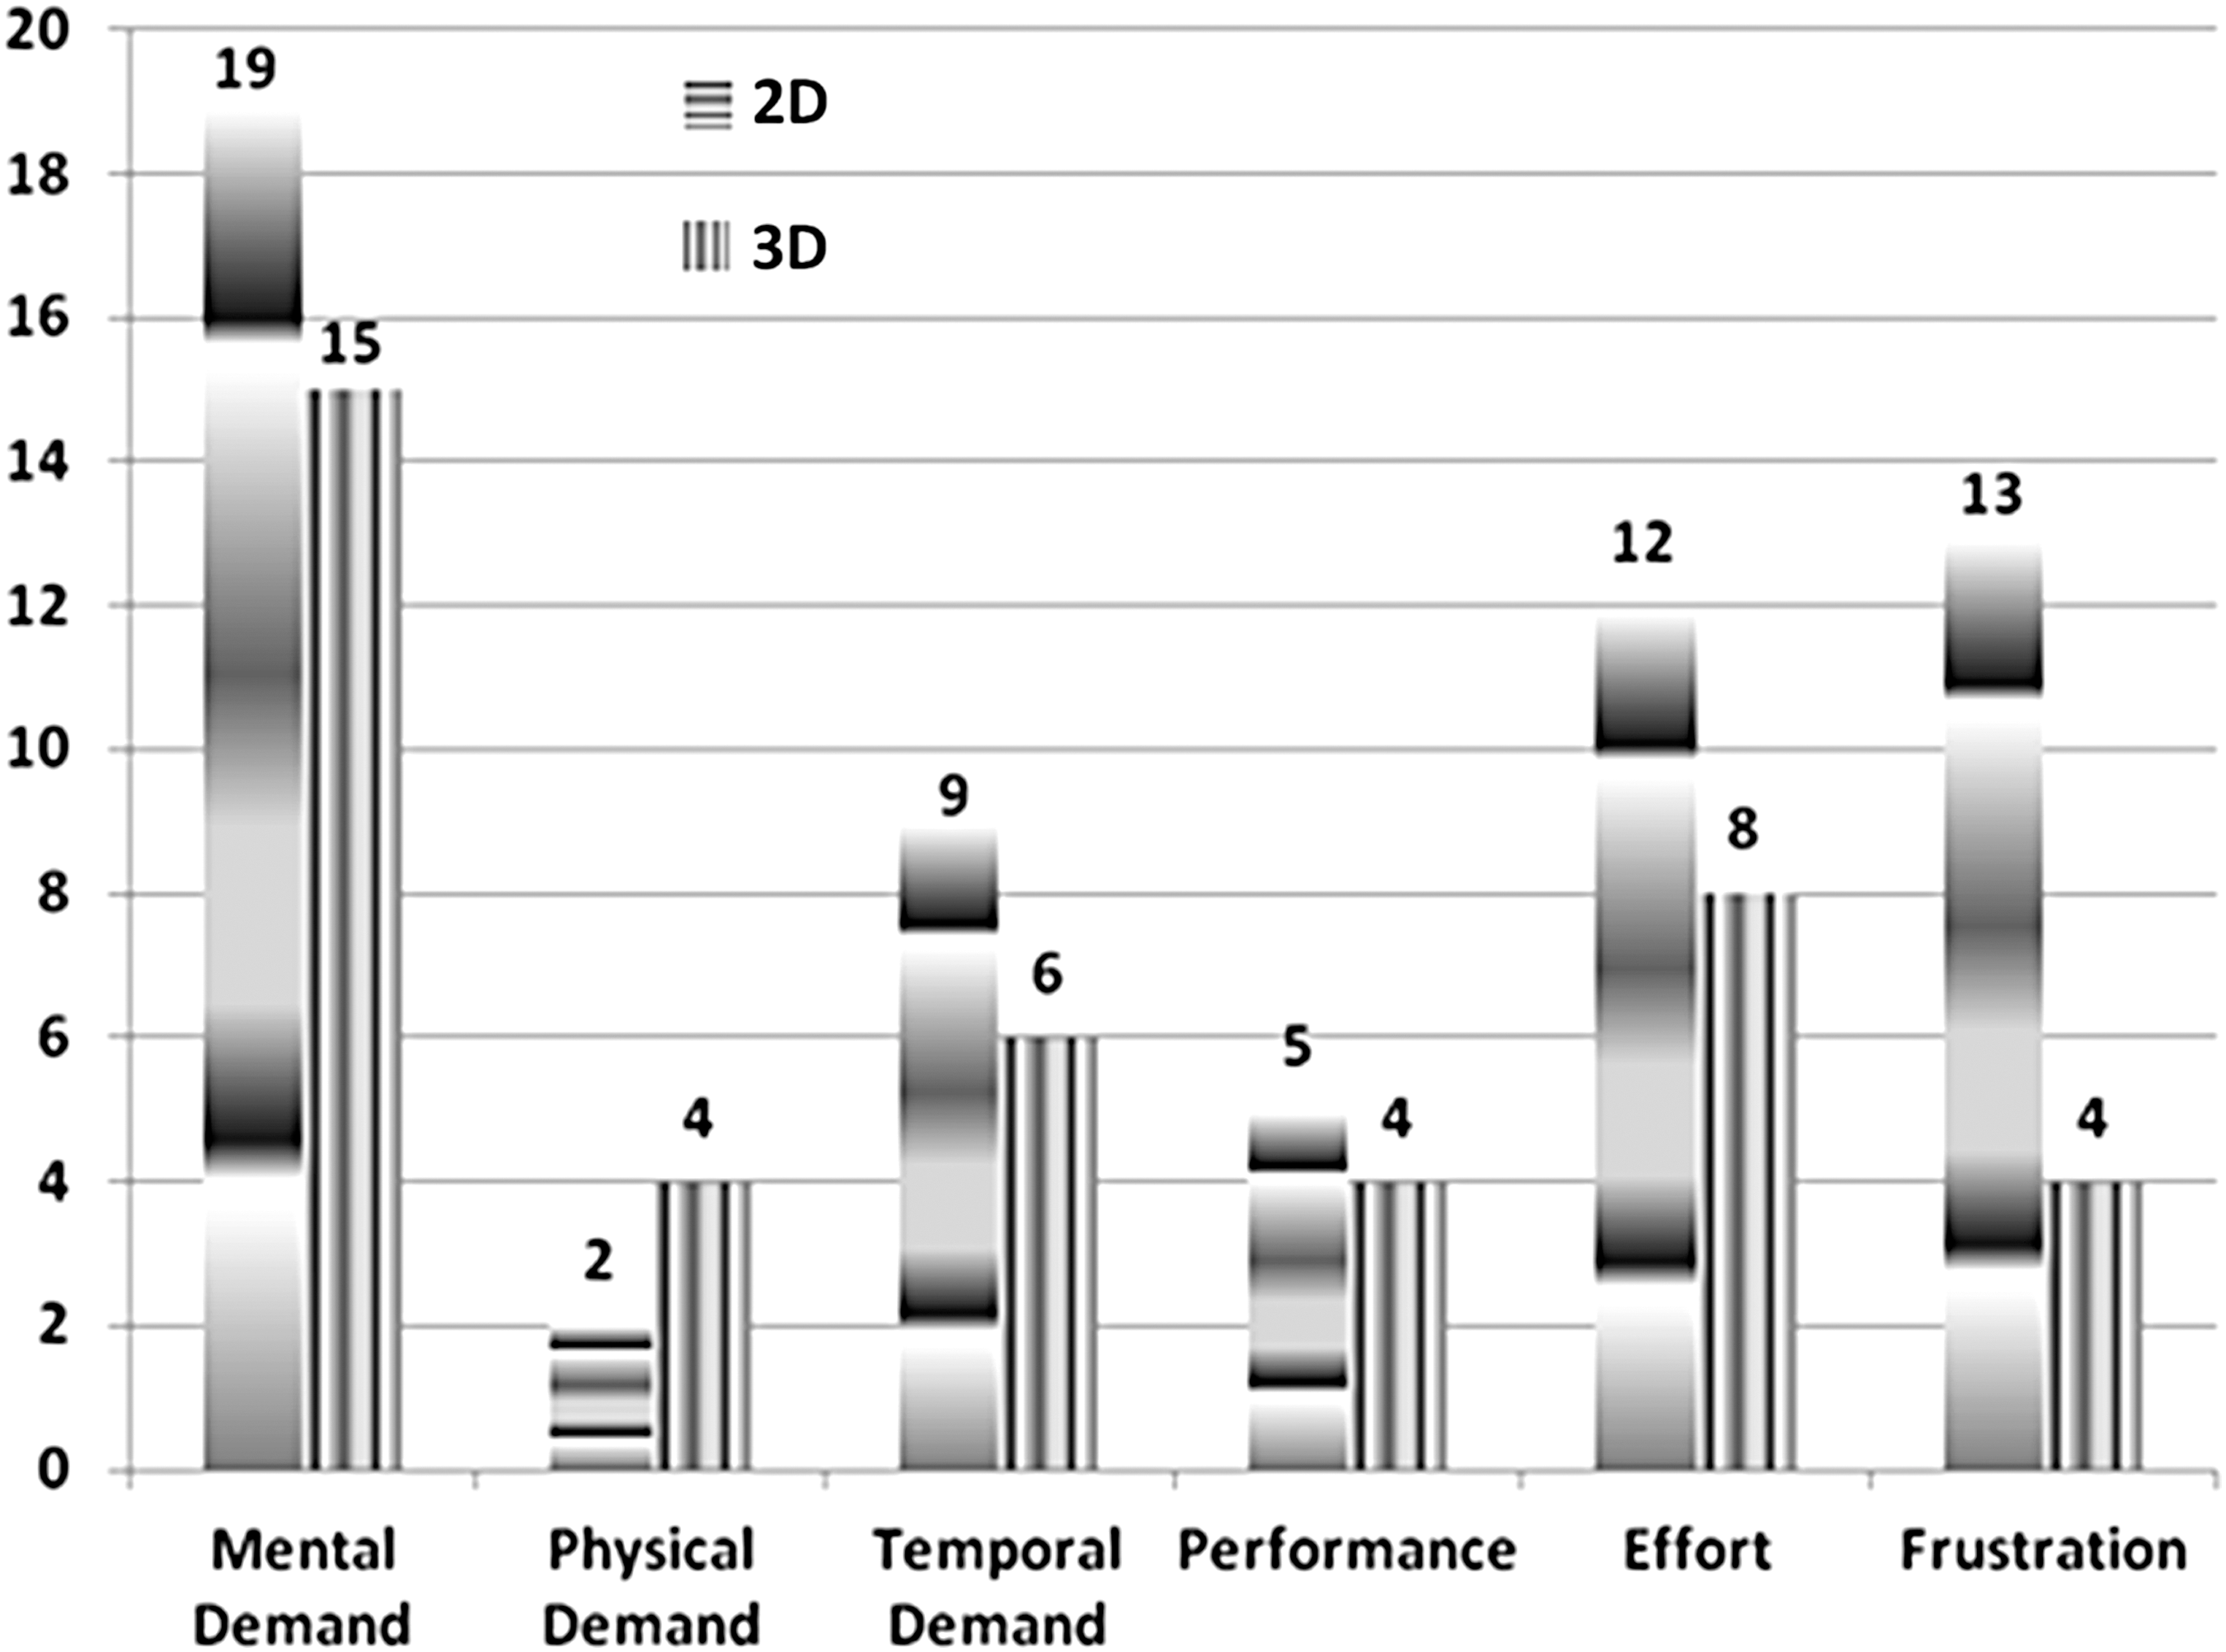
Mean of each subfactor.
Averages of all subfactors were different for the two techniques. The awarded weight to each subfactor means how important each subfactor is according to the participant's feeling. The smallest difference in average scores between the two techniques was observed in the subfactor performance (p = 0.3159, p > 0.05). The 2D technique required more performance (M = 5 δ = 3.47) from users than the 3D technique (M = 4, δ = 3.06). The biggest difference observed was the frustration factor with significant statistical differences (p = 1.722e-05 p < 0.05), which means that the participants had less level of frustration in 3D technique (M = 4, δ = 5.18) than in 2D technique (M = 13, δ = 9.65). Regarding the mental workload demand, the 3D technique had the lowest score (M = 15, δ = 7.67) compared with 2D (M = 18, δ = 8.35) with a significant difference (p = 0.047, p < 0.05) between them meaning that participants had more mental workload in carrying out the tasks in 2D technique than 3D.
The subfactor related to the physical demand was more required with 3D technique (M = 4, δ = 6.80) than 2D (M = 2, δ = 4.62) and had no significant difference between them (p = 0.1578, p > 0.05). This phenomenon was expected, because the 3D technique requires a greater physical ability to move, drag, rotate, and zoom the objects with the mouse than the 2D technique. Finally, the results of the stress factor showed that the 3D technique participants had less stress (M = 8, δ = 5.65) than in 2D technique (M = 12, δ = 7.32) and no significant difference between them (p = 0.0011, p < 0.05).
Effectiveness of Evaluation
Task effectiveness was calculated by dividing the total number of correct answers related to each task by the total number of participants (Fig. 3).
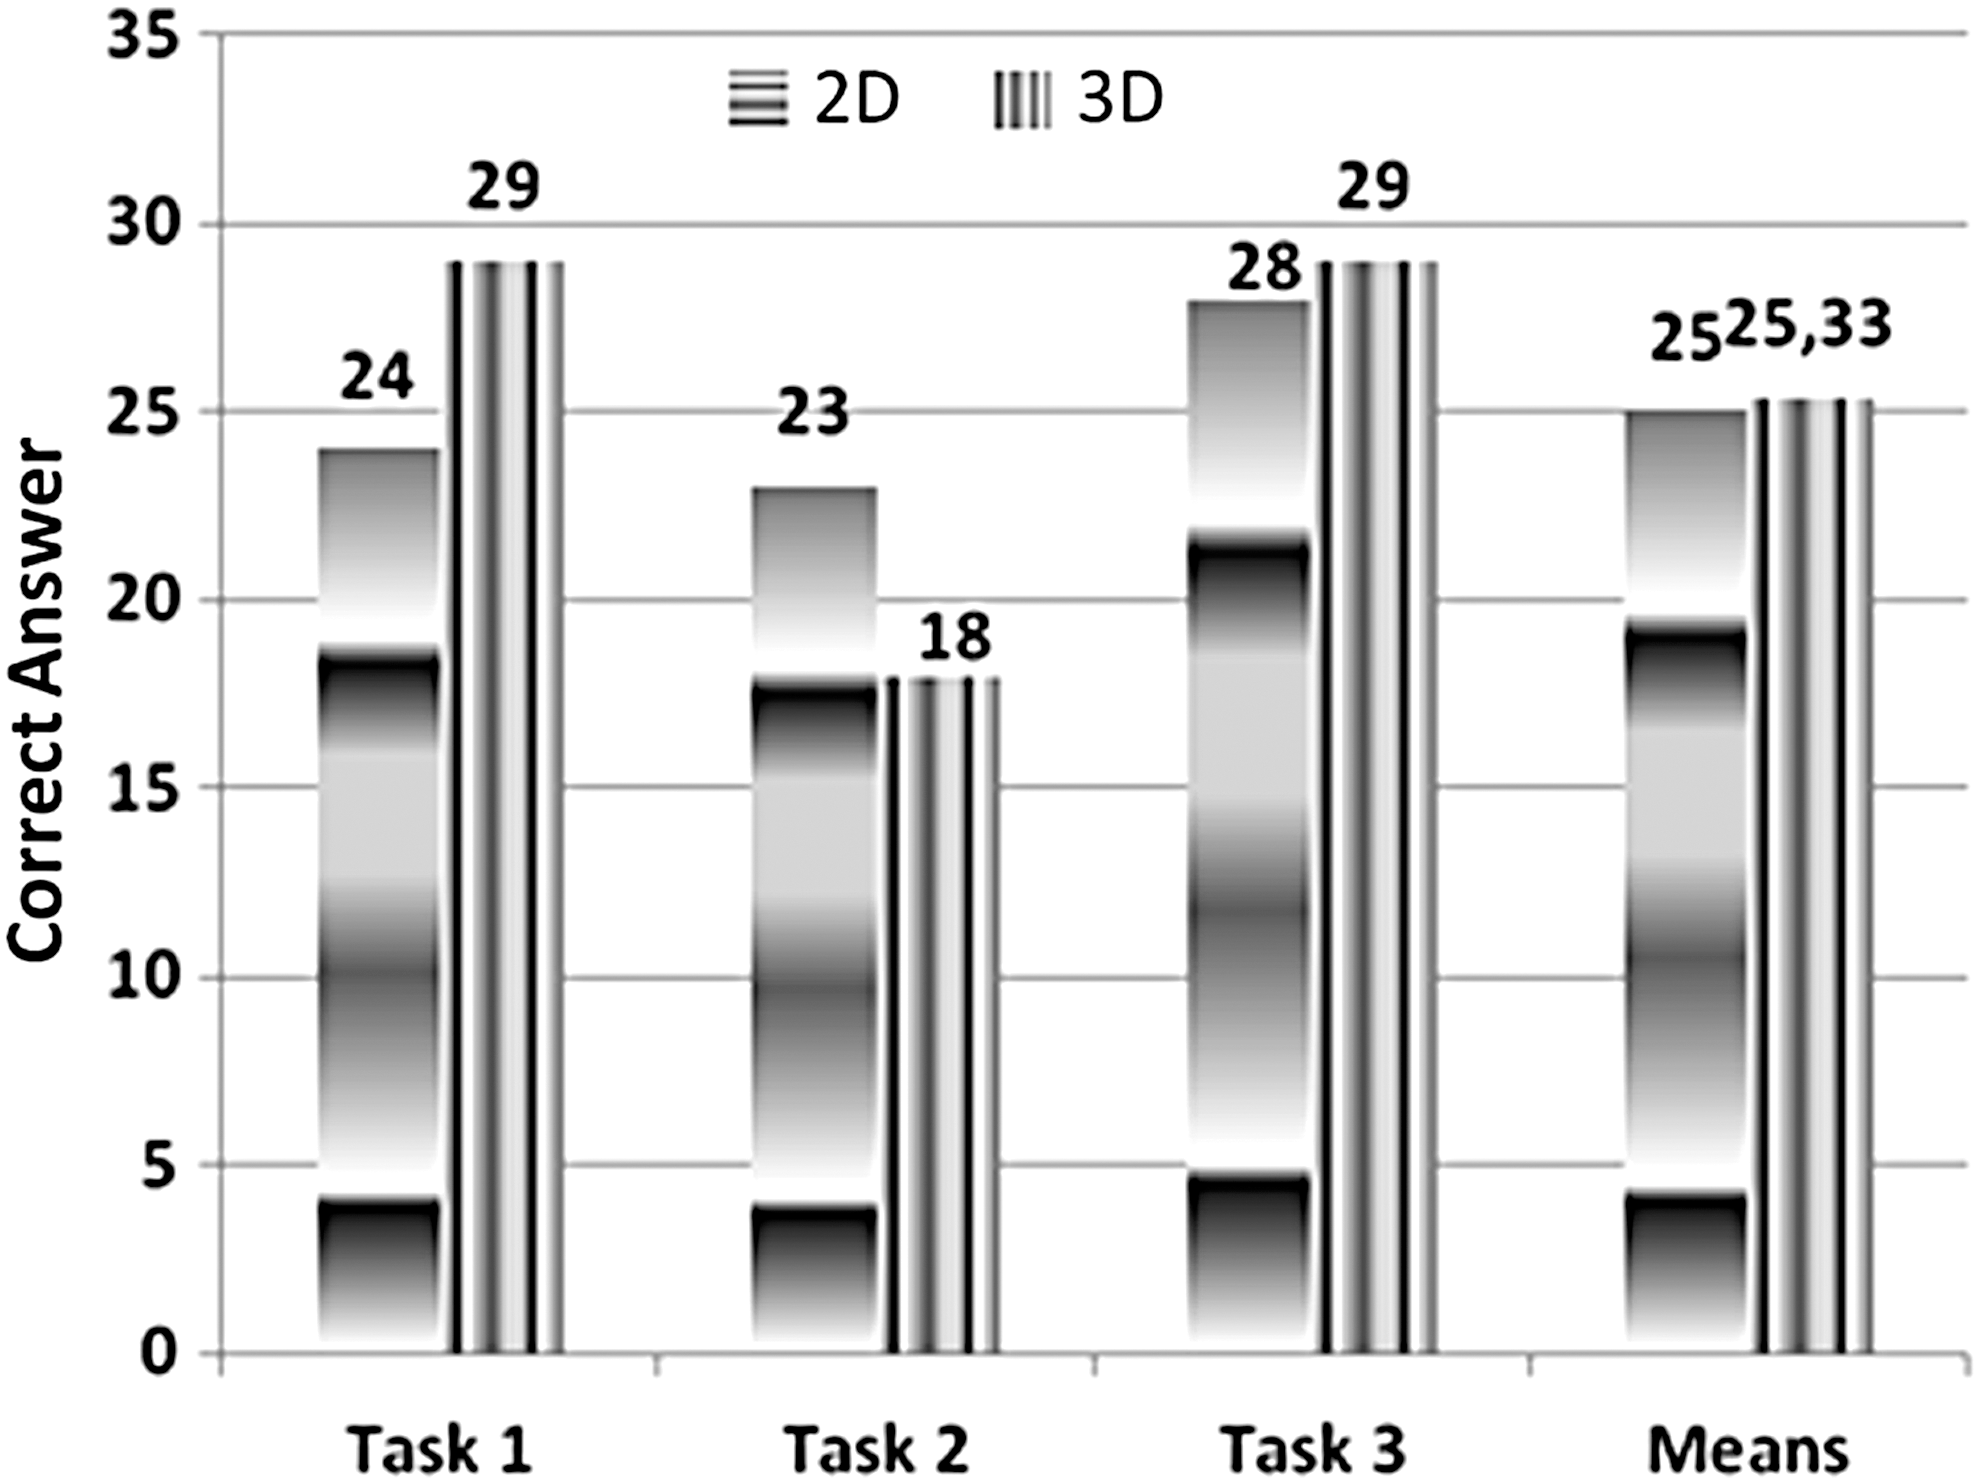
Accuracy rate.
The 2D technique was less effective than the 3D technique in the first and third tasks and was less effective in the second task. In general, the average number of correct answers in 2D technique (M = 25; δ = 2.65) was slightly lower compared with 3D technique (M = 25.33; δ = 6.35), but they were not significantly different (p = 0.9192, p > 0.05).
Time Evaluation for Performing the Task
The time for performing each task with 2D and 3D technique is shown in Figure 4.
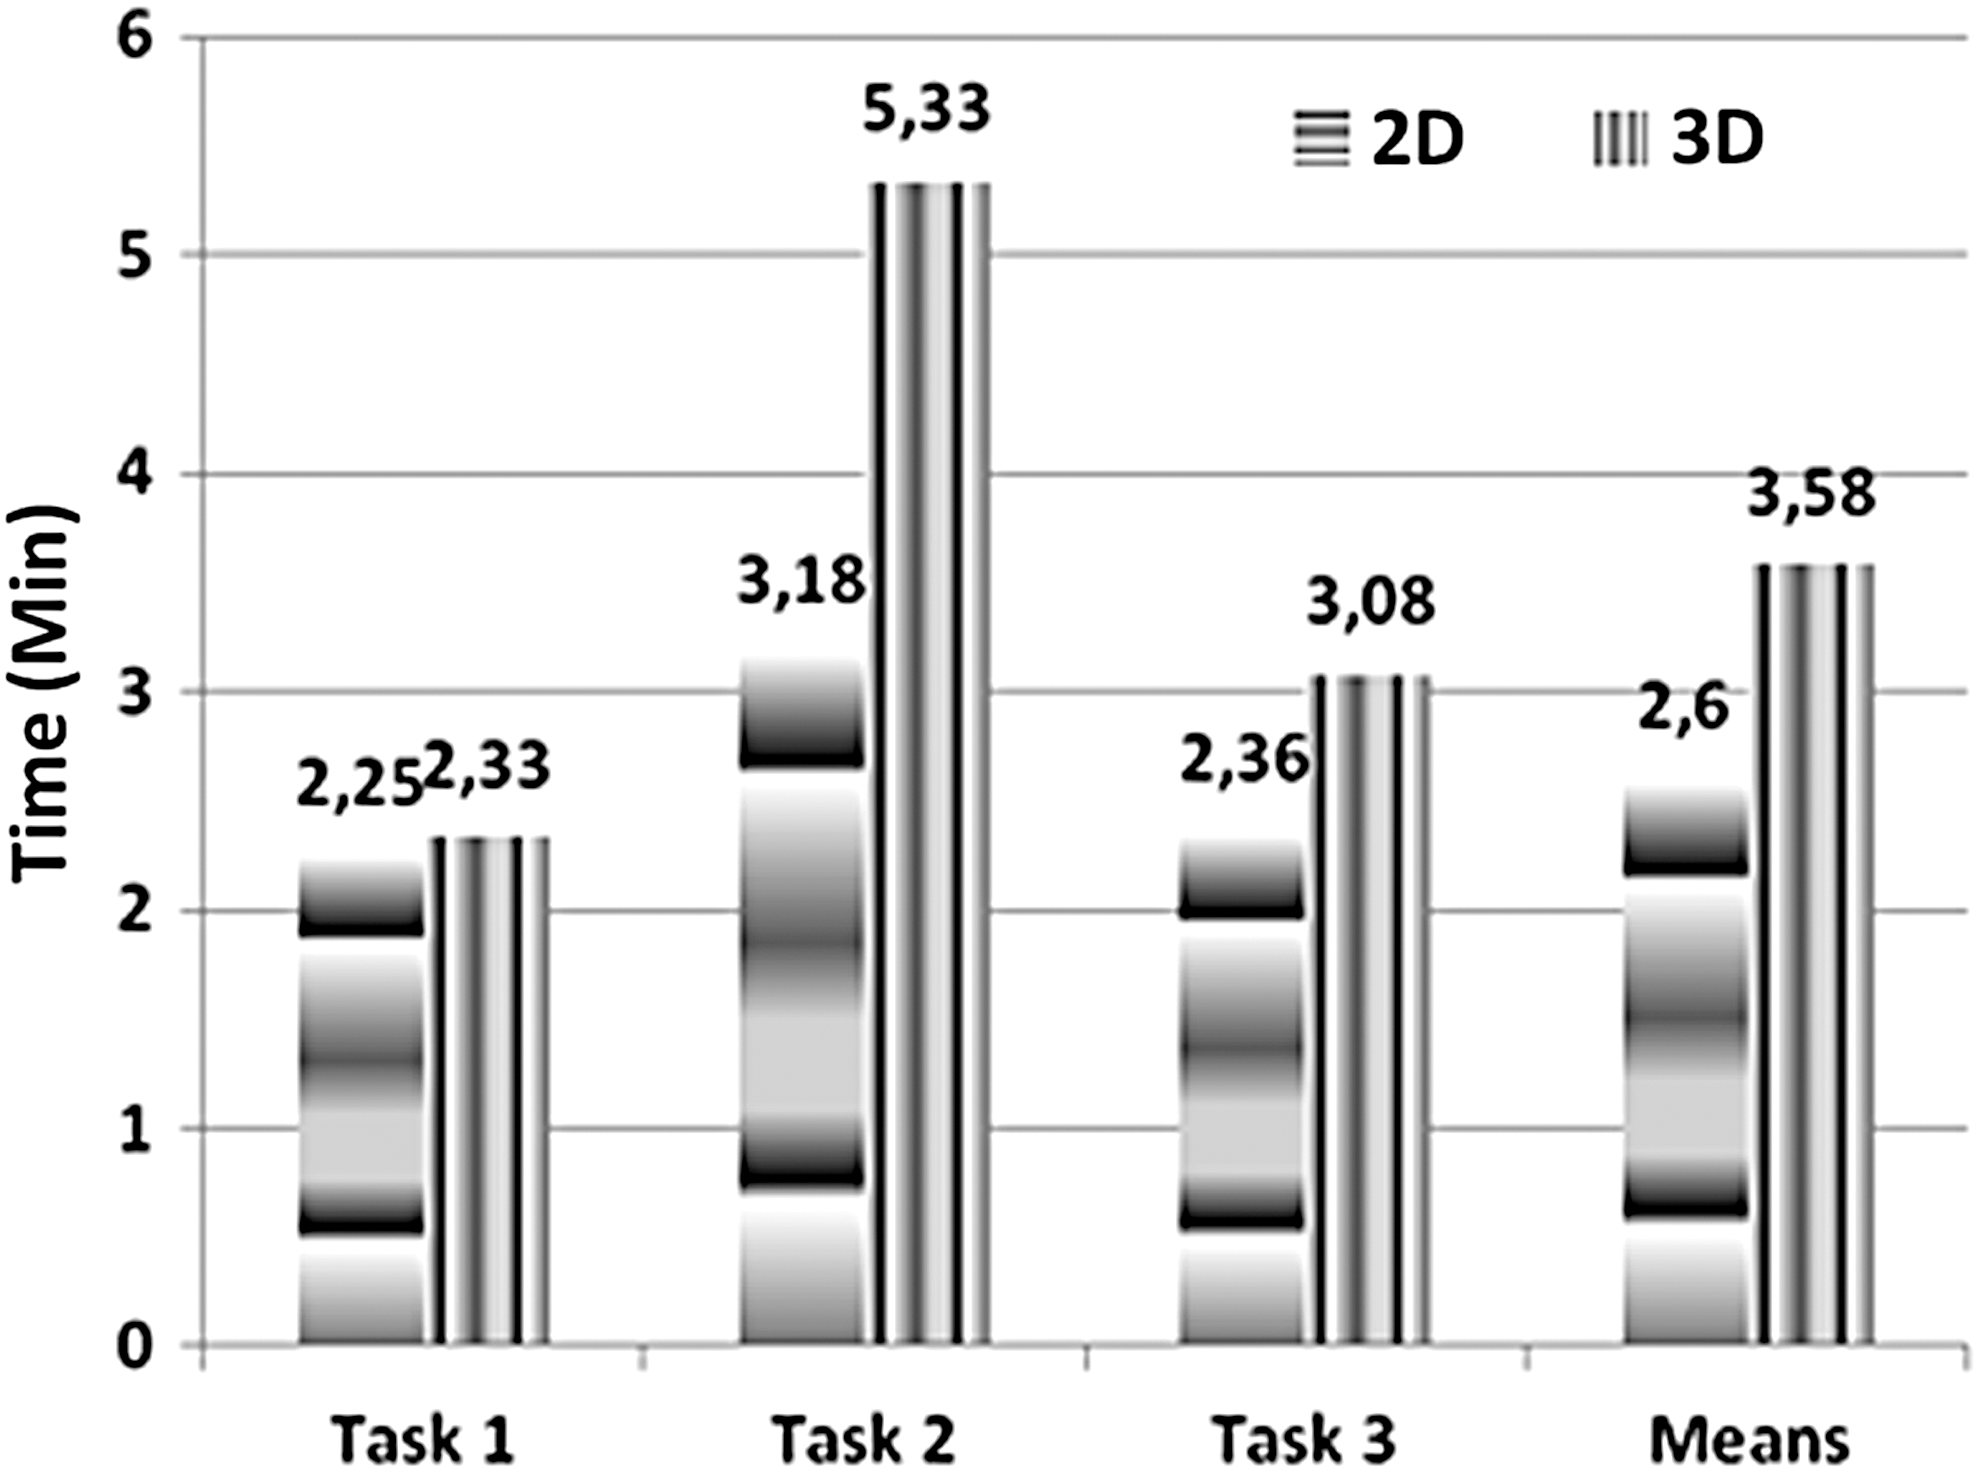
Time to perform the task.
Average time for performing all tasks was higher for 3D than the 2D. The overall average task execution time in minutes for all tasks was higher with the 3D technique (M = 3.58, δ = 0.872) than with 2D (M = 2.60, δ = 0.468) and was significantly different (p = 2.512e-05, p < 0.05).
The results of the statistical analysis demonstrated that the effectiveness in 2D and 3D techniques are different. According to participants' reports, this was due to the 3D technique being newer than the previous technology. They did not have enough time to get used to the 3D technique.
Evaluation of Efficiency
Efficiency was calculated as the percentage of correct answers in the task divided by performing time (Fig. 5).

Task efficiency.
Although the 3D technique had better efficiency in the first task, and when it is compared with 2D technique, the overall 2D technique (M = 0.33, δ = 0.087) had better efficiency compared with the 3D technique (M = 0.25, δ = 0.093) that was significantly different (p = 0.0043, p < 0.05).
Discussion
It was observed with this study that, although the time in accomplishing the task with the 3D technique was higher with the telehealth professional and, consequently the effectiveness of the 3D technique was less with this same group, the mental load used in performing the tasks with the 3D technique was lower than with 2D; telehealth professionals were more careful and precise in performing the tasks with the 3D technique, since they did not have as much knowledge with 3D technology as with the 2D technique. The task execution was equal to, or greater than, the proposed 3D prototype than in the 2D system due to a greater amount of resources (WIMP+zoom+rotate+filter+select+move, among others) that the 3D prototype contained, which caused a longer time in the completion of the task.
Furthermore, during the process of evaluating the usability of the 3D technique, some difficulties were encountered in the manipulation of the mouse and navigation in the 3D environment, mainly in relationship to the orientation of the objects along the X, Y, and Z axes of the graph. These difficulties can be solved with some suggestions and modifications on how users manipulate and interact with data in the 3D environment.
The solution may be the introduction of some technology of optical sensors that allow the manipulation of 3D objects through gesture recognition, as it would allow the user to manipulate the graph freely without the need to use the mouse, simulating better spatial interaction. Thus, guidance could be better understood and practiced.
This new technology aims to achieve interactions between man and computer dynamically without the need for physical contact with the base of the input device. 22
Conclusions
The 3D environment developed was the first interactive tool to visualize and monitor indicators of service in social network through the integration of principles and characteristics of 3D visualization technique, user centered design, and cognitive theory used in health service from which the subject sample was drawn. While the 3D system was less frustrating to use, for many tasks it was a little less efficient and less effective than 2D, likely due to participants being more familiar and experienced with the older technology.
Currently, the 3D environment is most effective when it is visualized with small amounts of data. Interpretation usually becomes more difficult as the data size grows. There are several other interactive visualization solutions to aid in this situation; for example, an appropriate dimensionality reduction technique could be used to handle large dimensional data. In future research, we will adjust the right mechanism to support a more complex dataset.
Although this study has several limitations in relation to performance and bugs that need to be considered when interpreting the results, the results of this study described above provide proof that the 3D environment prototype contributes to improve the identification of patterns, visual perception, and understanding in the search of specific information by reducing the search time and cognitive load. Analysis of usability also shows that the visualization interface could be simplified and improved, which may make the interface easier to use. Furthermore, the 3D environment supports the service manager to verify the quality of service toward the features provided by 3D environment, especially its capability to identify trends, clusters of interest, and perform indicator comparisons.
Footnotes
Acknowledgments
We acknowledge the expert support from the Informatics Center of Federal University of Pernambuco, Telehealth Center (NUTES), and The National Science and Technology Institute in Child and Adolescence Developmental Psychiatry (INPD). In addition, we acknowledge the CNPq (Edital INCT no15/2008) and FAPESP for providing the funding for this study.
Disclosure Statement
No competing financial interests exist.