
Abstract
Background:
Teledermatology is rapidly advancing in the United States. The last comprehensive survey of U.S. teledermatology programs was conducted in 2011.
Introduction:
This article provides an update regarding the state of teledermatology programs in the United States.
Materials and Methods:
Active programs were identified and surveyed from November 2014 to January 2017. Findings regarding practice settings, consult volumes, payment methods, and delivery modalities were compared to those from the 2011 survey. Findings from the Veterans Affairs (VA) were reported as an aggregate.
Results:
There were 40 active nongovernmental programs, amounting to a 48% increase and 30% discontinuation rate over five years. Academia remained the most common practice setting (50%). Median annual consultation volume was comparable with 263 consultations, but maximum annual consultation volume increased (range: 20–20,000). The most frequent payment method was self-pay (53%). Store-and-forward continued to be the most common delivery modality. In Fiscal Year 2016, the VA System consisted of 62 consultation sites and performed a total of 101,507 consultations.
Discussion:
The limitations of this study were that consult volume and payment methods were not available from all programs.
Conclusion:
U.S. teledermatology programs have increased in number and annual consultation volume. Academia is the most prevalent practice setting, and self-pay is the dominant accepted payment method. Innovative platforms and the provision of direct-to-patient care are changing the practice of teledermatology.
Introduction
Teledermatology in the United States has evolved significantly since the early 1990s. Dermatologists began practicing teledermatology as a mechanism to provide specialized skin care to remote populations. 1 In the 21st century, teledermatology has expanded to a variety of programs to meet the growing demand for dermatologic expertise. Skin disorders pose a substantial medical burden worldwide and constitute approximately one third of primary care visits in the United States. 1,2 However, there is a nonuniform supply of dermatologists. 3 The population density of dermatologists in the United States is estimated to be 3.4 per 100,000 individuals, which does not allow for overall adequate care of skin diseases. 4 Furthermore, there is an uneven geographical distribution of dermatologists with increased numbers in urban areas. 4 This contributes to skin-care disparities affecting millions of patients nationwide.
As dermatologic care is largely based on visual cues, teledermatology has emerged as a potential solution to improve access to care while maintaining clinical efficacy. Research over the past two decades has demonstrated how teledermatology provides greater accessibility to dermatologic services for both rural and urban populations. In a study conducted in 11 underserved primary care clinics in Philadelphia, teledermatology alone was sufficient to treat 77% of consults and at least 61% of referred patients would not have received dermatologic care otherwise. 5 Teledermatology also decreases waiting times and increases efficiency in certain practice settings. 6 –10 For example, in the emergency department, compared to care by emergency room (ER) physicians alone, teledermatologists improved the diagnostic workup in almost 70% of cases and enabled more patient discharges from the ER than hospital admissions. 6 In Los Angeles County, 21% of suspected skin malignancies and 29% of suspected melanomas referred from primary care physicians were triaged by teledermatology as nonmalignant and not requiring an in-person consultation. 7 Implementation of teledermatology may be essential to meet the heightened demand for dermatologic expertise.
Teledermatology is also reliable in regards to accurate diagnosis and management of skin disorders. Compared to in-person consultation, teledermatology consultation has shown comparable results in primary diagnosis, aggregated diagnoses, and clinical course outcomes up to 9 months postreferral. 11,12 Two systematic reviews have also shown high diagnostic and management concordance between the two for dermatologic disorders and malignancies. 13,14 Even with the use of mobile phone imaging, agreement was shown to be 82% for primary categorical diagnosis, 62% for aggregated diagnoses, and 81% for management decisions. 15 Teledermatology has demonstrated accuracy in all Fitzpatrick skin types and the pediatric population, although older age and atypical nevi have been reported to be associated with higher rates of discordant diagnoses. 15 –17 Despite increasing clinical volume, teledermatology preserves clinical accuracy.
The field of teledermatology is constantly being redefined. Specific challenges in teledermatology include operational inefficiency, lack of communication with referring providers, and inexperience among practicing dermatologists. 18 –20 Furthermore, novel platforms such as direct-to-patient virtual consultation programs and mobile self-care applications, while less costly and more convenient, may need proper safeguards to ensure delivery of high-quality care. 21 –23 Over the past decade, explicit efforts have been made to overcome these challenges. These efforts include improving diagnostic technologies, applying dermatologic imaging standards, establishing appropriate follow-up protocols, encouraging resident exposure, and increasing adherence to national and/or institutional guidelines for teledermatology. 24 –29 With such advances, teledermatology will continue to evolve in the future.
In 2016, as part of the American Telemedicine Association (ATA) initiative, we organized a nationwide survey in an effort to understand the current landscape of teledermatology in the United States in regards to a number of aspects, including practice setting, patient volume, and payment methods. This is an update on the state of teledermatology since our last survey from 2011. 30
Materials and Methods
We adapted a validated questionnaire used in 2011 to survey the different teledermatology programs. This questionnaire included practice setting, service areas, clinical volume, payment methods, and type of technological modality used in delivery. We identified active programs by the following three-step approach: (1) We had a list of existing programs from the 2011 survey and checked to confirm that they are still active; (2) To identify new programs, we conducted an extensive state-by-state Internet search; and (3) We asked members of the ATA Teledermatology Special Interest Group (SIG) if additional programs had not already been identified. This study was approved by the Institutional Review Board at University of California Davis.
We classified a program as inactive when the program responded that they were discontinued. We classified a program as neither active nor inactive when the program responded that it was never started or did not respond at all.
Between November 1, 2014 and January 1, 2017, 92 questionnaires were electronically distributed to potentially active programs. Programs unresponsive to the initial survey were contacted at least thrice by e-mail and at least twice by telephone. Survey responses were collected by the ATA, and descriptive statistics was subsequently performed for this study.
Of note, individual teledermatology programs within the Veterans Affairs (VA) were excluded from the total analysis due to VA restrictions regarding survey participation by individual facilities. Instead, data for the VA teledermatology programs were presented as an aggregate of national data.
Results
Overview of Teledermatology Programs (Nongovernmental): Practice Settings, Patient Volumes, Payment Methods, and Technological Modalities
Governmental programs refer to programs associated with the VA, active military services, and Indian health services. Nongovernmental programs include programs associated with academic institutions, private practice, medical groups, and other practice settings. In this section, we discuss nongovernmental programs.
The total number of active nongovernmental programs was 40, which is an increase from the total of 27 nongovernmental programs in 2011 ( Table 1 ). 30 This represents a 48% increase over 5 years. Since 2011, 8 of the 27 programs were discontinued and, thus, classified as inactive. This amounts to a 30% discontinuation rate over 5 years. This could represent an underestimate of the total number of discontinued programs because we did not classify the programs that did not respond (25.0%) as discontinued.
Comparison of Active Teledermatology Programs in 2011 and 2016 in Regards to Number of Programs, Median Annual Consult Volume, Practice Settings, Payment Methods, and Delivery Modalities
Descriptions in italics indicate the option with the greatest percentage.
From Armstrong et al., a primary investigation of the state of teledermatology programs in 2011, published in November 2012.
Data for nongovernmental programs only, except for number of programs.
HMO, health maintenance organizations; IPA, independent practice associations; LI, live-interactive; PPO, preferred provider organization.
Among the 40 active programs, half were established within academic institutions (50%), followed by private practice (30%), medical groups (10%), and other practice settings such as tribal facilities or virtual office platforms (10%) ( Figs. 1 and 2 ). Academia remained the most common practice setting for teledermatology ( Table 1 ). In 2011, 67% of the programs were based at academic institutions. 30 Independent virtual office platforms have emerged as a new practice setting of teledermatology in 2016.

Map of active teledermatology programs in the United States in 2016 who responded to the survey. Teledermatology programs are not mapped if they do not disclose which states they serve.

Practice settings of active nongovernmental teledermatology programs in 2016.
The median number of consultations seen per year was approximately the same between 2011 and 2016; specifically, the median was 263 consultations in 2016, compared to 309 consultations in 2011 ( Table 1 ). 30 However, the maximum number of consultations increased. Annual consultation volume ranged from 20 to 20,000 consultations. In comparison, the maximum number of consultations seen in 2011 was 6,500 consultations. Overall, teledermatology programs based in medical groups performed the highest median annual number of consultations with a median of 539 consultations per site (range: 40–12,500; mean: 3,405) ( Fig. 3 ). Second highest were programs in other practice settings, including tribal facilities and virtual office platforms, with a median of 330 consultations (range: 100–5,700; mean: 1,615), followed by academic programs with a median of 225 consultations (range: 40–2,400; mean: 460). Finally, teledermatologists in private practice settings performed a median of 120 consultations (range: 20–20,000; mean: 3,141). This ranking is different than in 2011, during which health maintenance organizations (HMO) had the highest median annual volume, followed by governmental, private practice, and academic teledermatology programs ( Table 1 ).
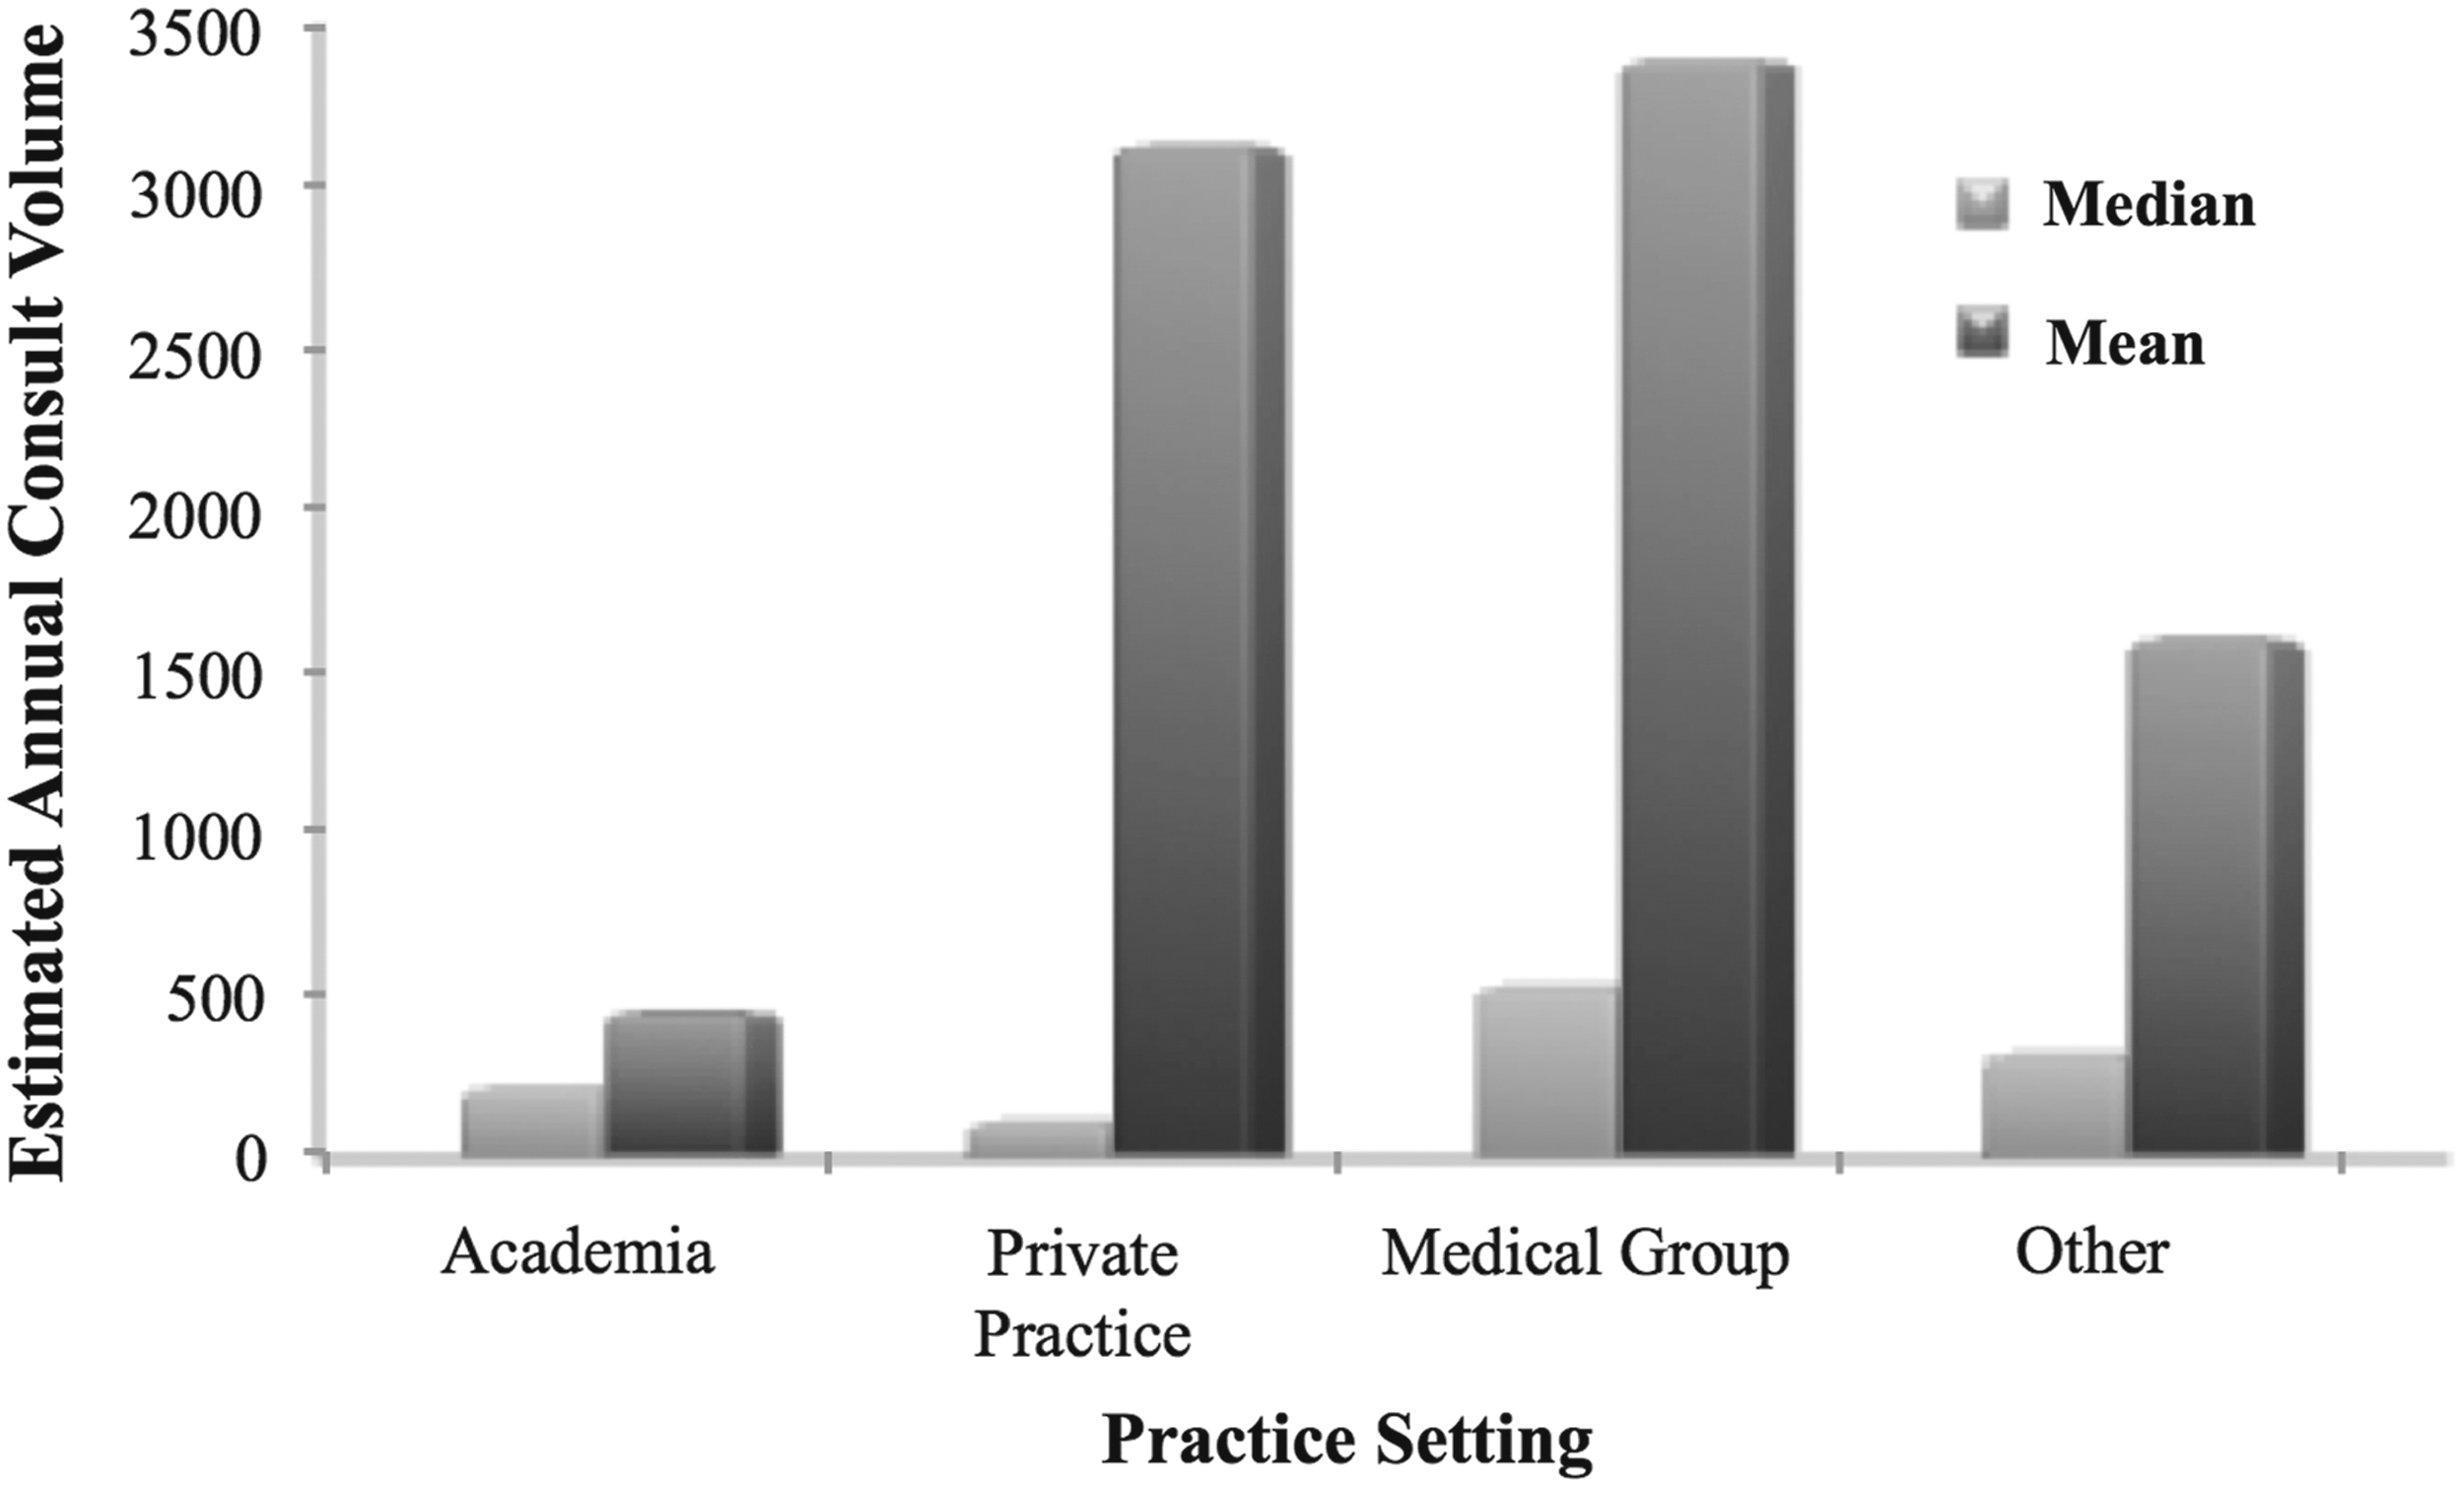
Teledermatology annual consult volume divided by practice setting in 2016.
Thirty-eight of the 40 active programs provided information about accepted payment methods for teledermatology services, and many of the programs accepted multiple methods. The most frequent reimbursement source was self-pay (53%), followed by preferred provider organization (PPO) (47%), HMO (39%), Medicaid (39%), Medicare (37%), other methods such as outside contracts (34%), and independent practice associations (18%) ( Fig. 4 ). Of the total programs, 32.5% also claimed that they perform volunteer services. One of the most significant changes in 2016 was that self-pay was the most common reimbursement source. In 2011, self-pay ranked second to PPO ( Table 1 ). 30
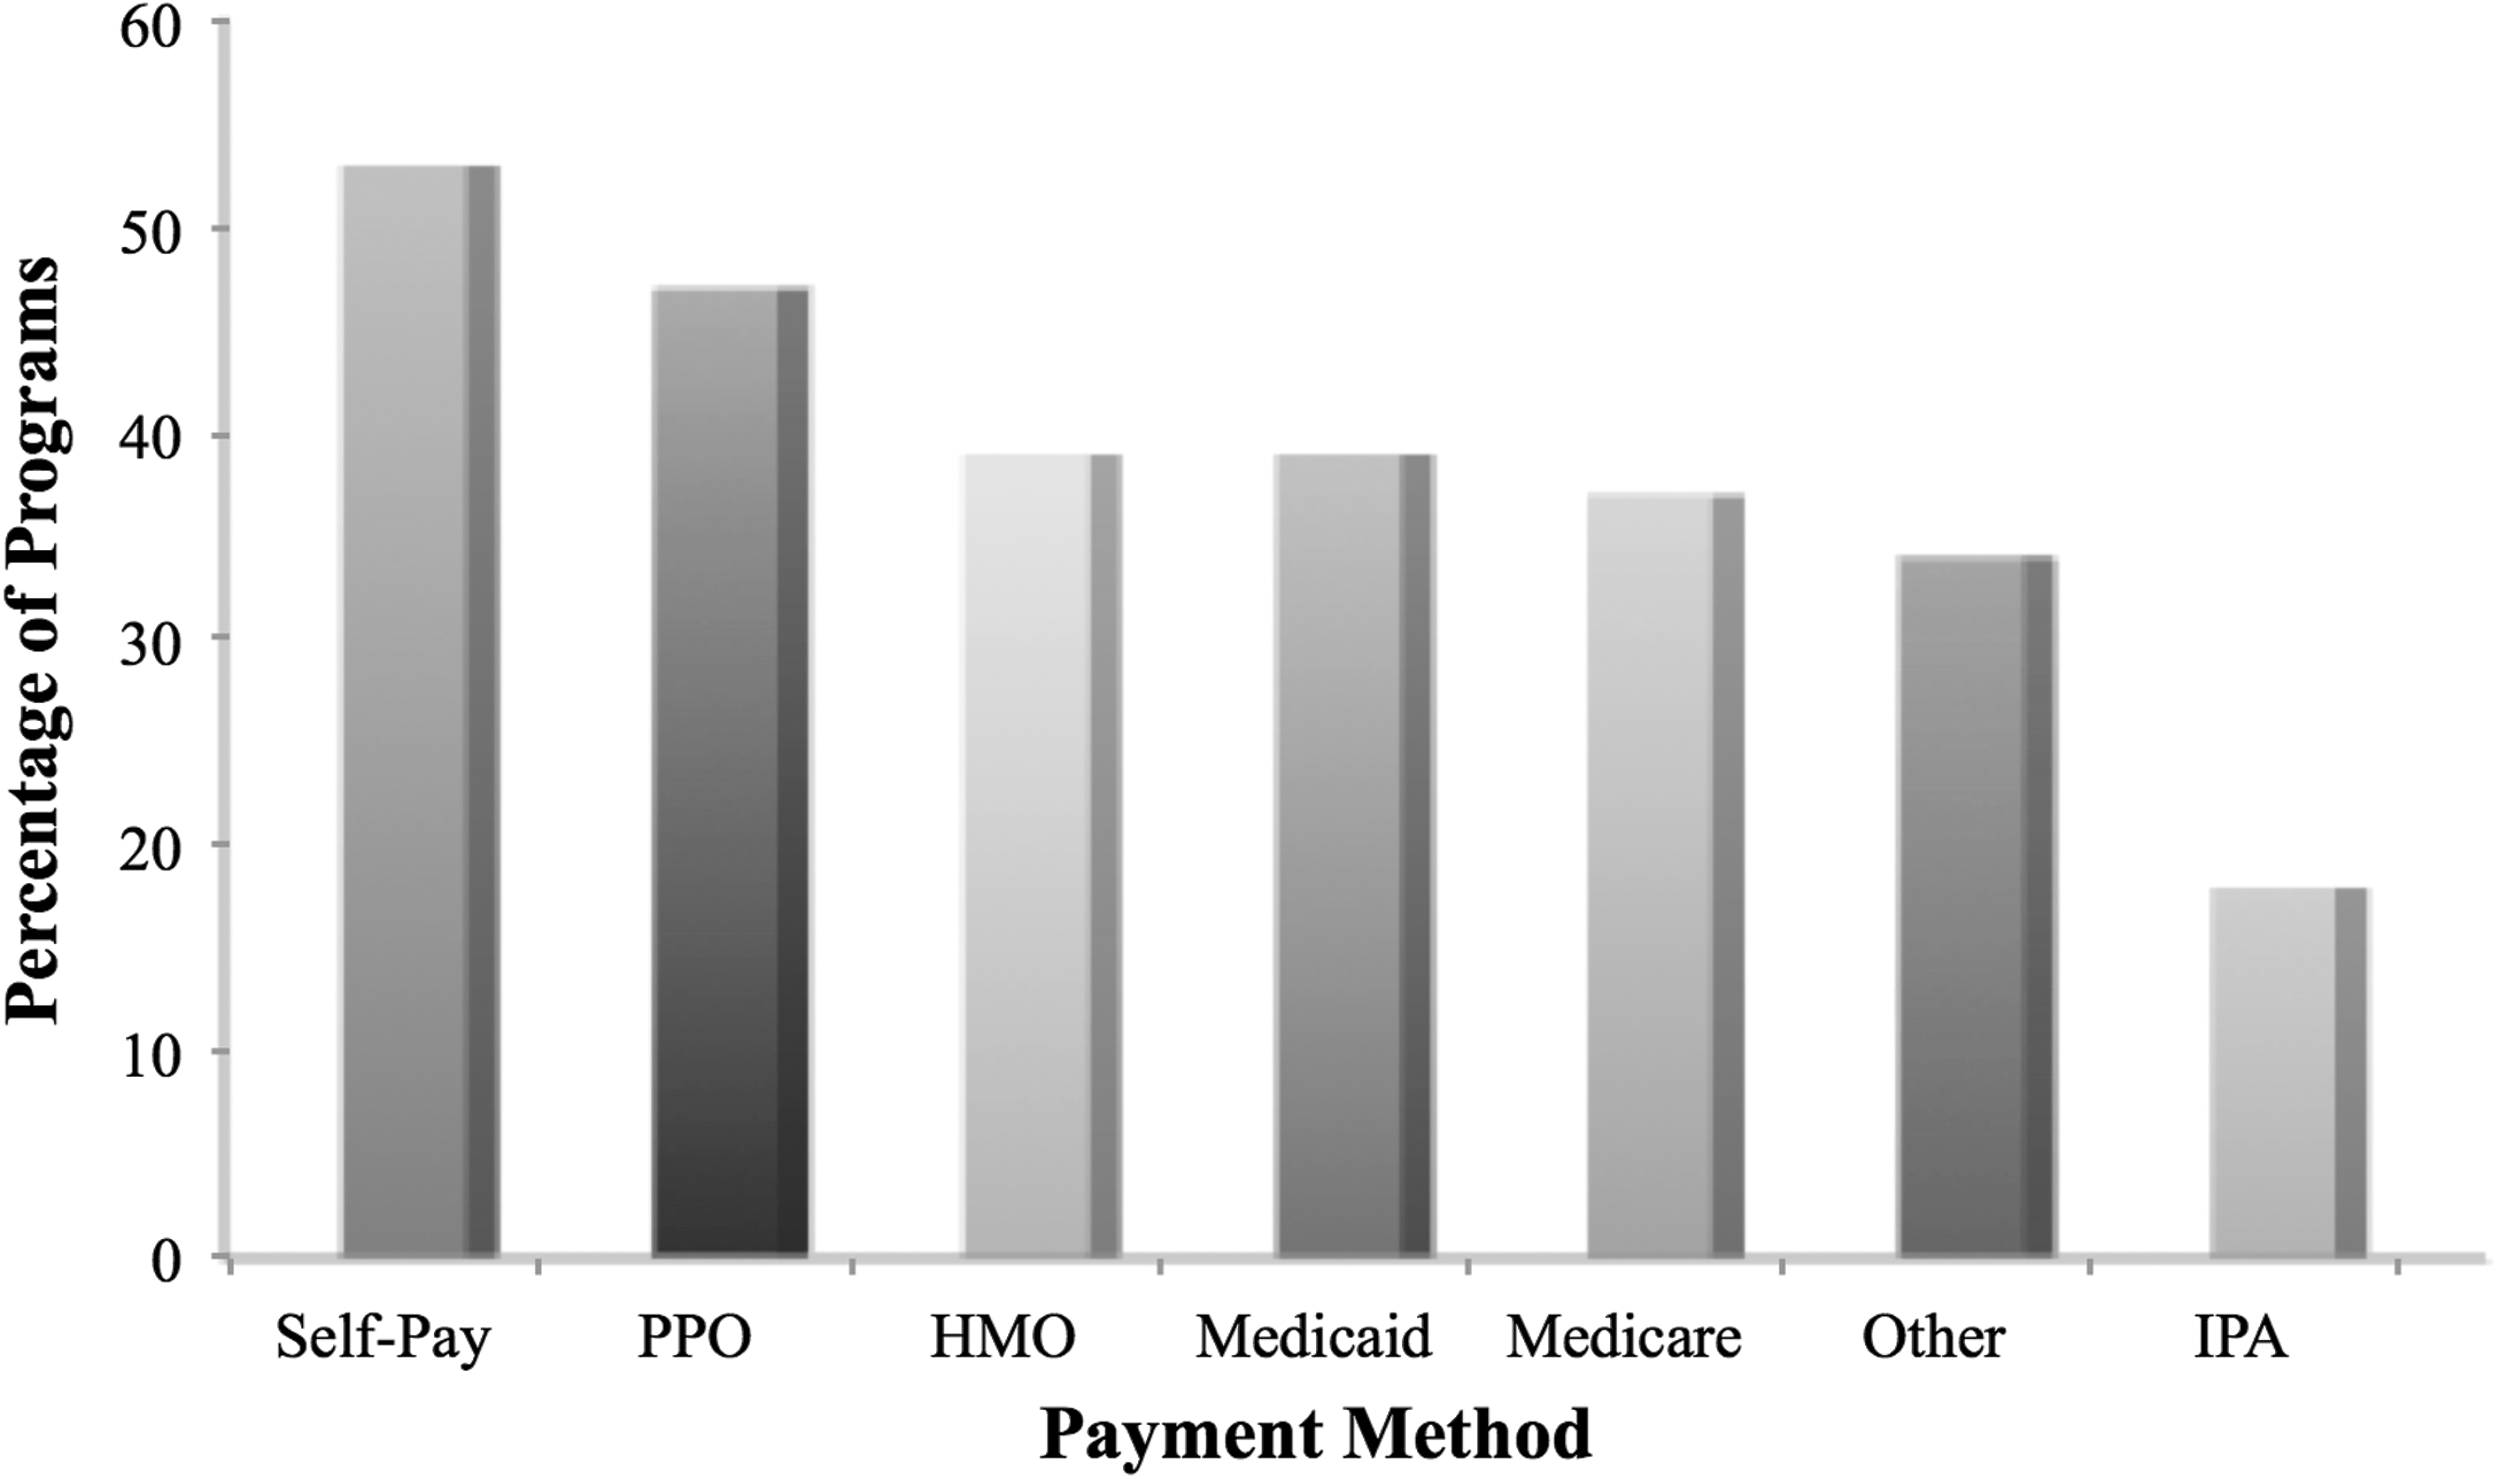
Accepted payment methods of active nongovernmental teledermatology programs in 2016.
In regard to provision of services, 28 of the 40 programs (70%) provided direct-to-patient care. Seventy-eight percent of programs only provided services within their home state, whereas 22% provided services to more than one state in the United States. Of the total programs, 12.5% provided dermatologic services internationally, and 62% of programs reported plans to connect with more referral sites in the future. Compared to 2011, the amount of programs providing in-state services increased and the amount of programs providing global services stayed the same. 30 While independent virtual office platforms had varied consult volumes, these programs generally had larger teledermatology service coverage across multiple states.
Finally, within a single patient encounter, 72% of programs utilized store-and-forward only, 45% utilized live-interactive only, and 35% utilized a hybrid of the two modalities Fig. 5 ). In other words, using only store-and-forward in a single patient encounter was the most popular approach, whereas using store-and-forward and live-interactive simultaneously in a single patient encounter was the least popular approach. Some programs utilized more than one of these three approaches in their practice of teledermatology for different patients. Compared to 2011, store-and-forward only remained the most commonly used teledermatology delivery modality ( Table 1 ). 30
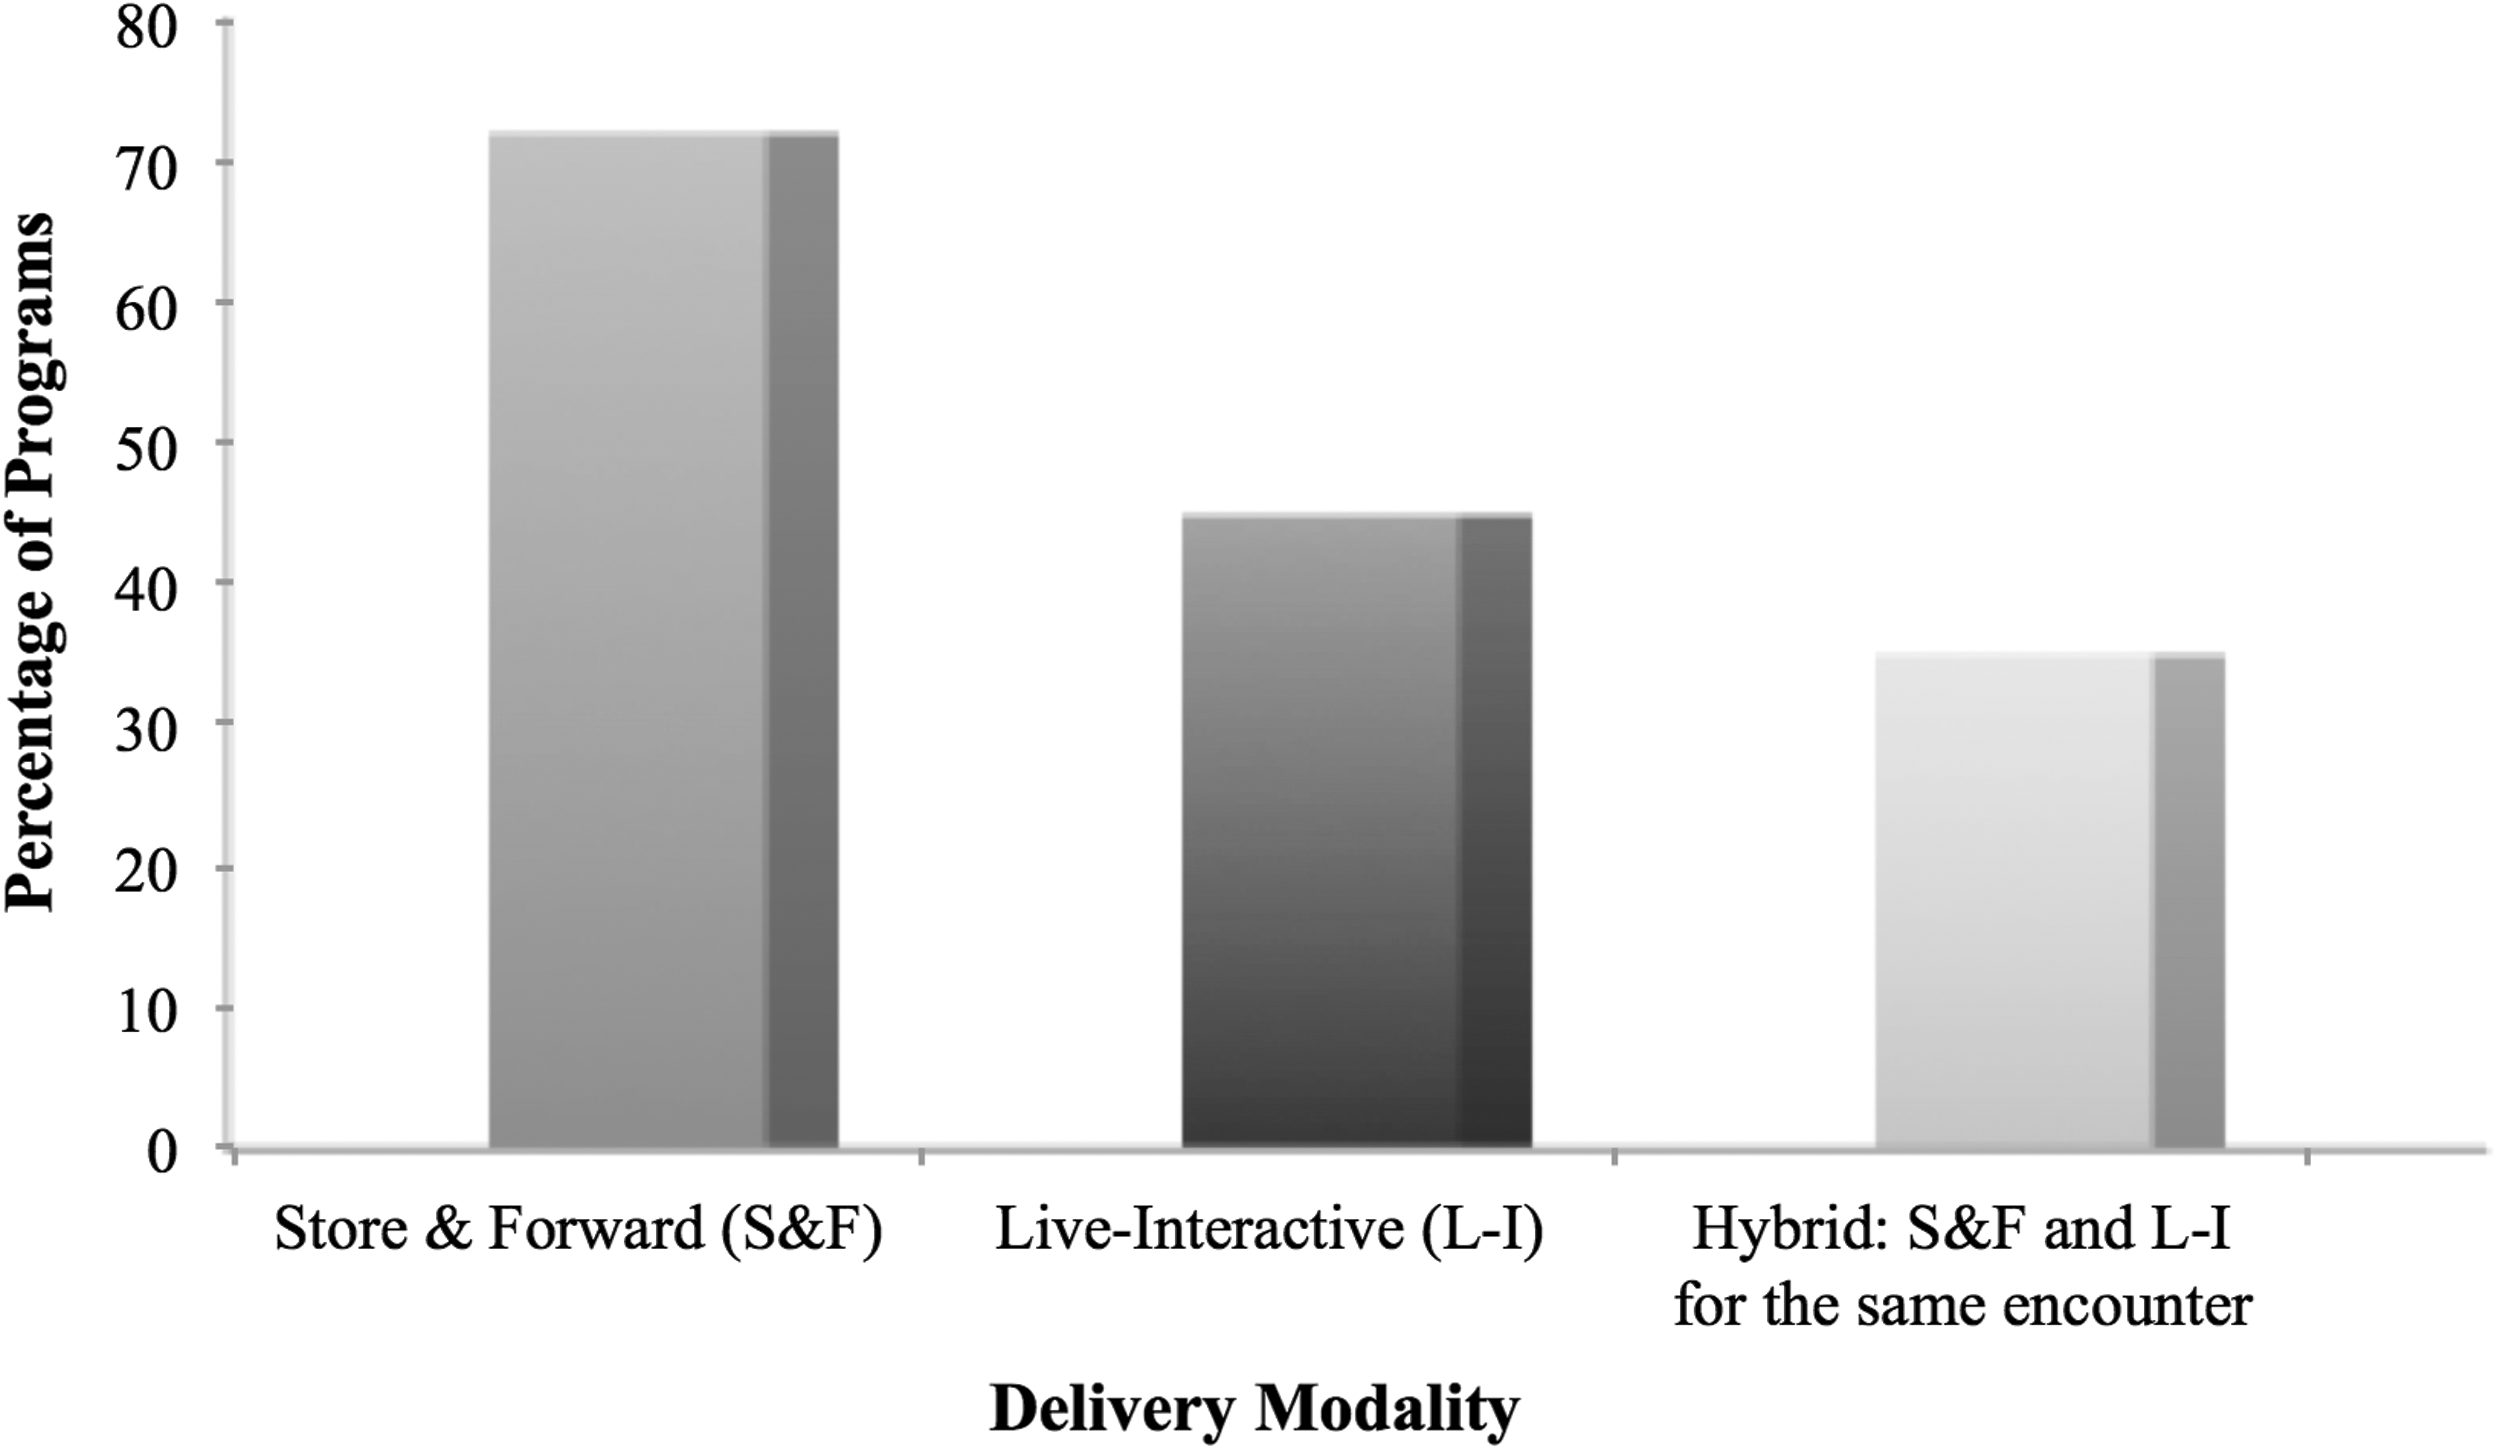
Delivery modalities of active nongovernmental teledermatology programs in 2016.
State of Teledermatology: Va System
In this study, the individual programs within the VA system were reported as an aggregate and excluded from the analysis. The VA teledermatology system is a unified national system composed of numerous individual facilities acting under the same set of business practices and quality management measures. The various sites operate as a network, interacting with each other and having the potential to share patient populations. This separates the VA teledermatology system from other U.S. teledermatology programs that operate autonomously.
At the end of Fiscal Year 2016 (September 30, 2016), there were 62 programs established within the VA system, exclusively in the United States. The VA performed 101,507 consultations in Fiscal Year 2016 and indicated future plans to connect with more referral sites. As a government-based system, the programs have been completely funded by the VA and did not perform volunteer services. The majority of programs delivered teledermatology using store-and-forward with a minority of programs utilizing live-interactive.
Discussion
This study represents a comprehensive update on the state of U.S. teledermatology programs in 2016. First, the findings show that both the number of active programs and the annual volume of consultations have increased. With 40 active, nongovernmental programs and at least 62 consultation sites within the VA system, the current landscape of teledermatology in the United States consists of 102 active nongovernmental and governmental programs. This is much larger than the total of 37 programs in 2011 ( Table 1 ). 30 Largely contributing to this is the growth of the VA teledermatology system, although the extent of this contribution could be an overestimate as the 2011 survey did not have access to national VA data and may have underreported the total number of VA programs. 31
Academia continues to be the most common practice setting for teledermatology ( Fig. 2 ). Given that academic institutions often have increased resources and serve large county populations, this may reflect a continuous effort to increase access to care to underserved populations. Furthermore, the incorporation of teledermatology into residency curriculums has gained significant interest over the past few years as not only a useful clinical skill but also as a unique educational tool to enhance medical knowledge. 28,32 Efforts to sustain academic teledermatology programs may be vital to the future of teledermatology. 30
The virtual office platform is a newly recognized practice setting in 2016. As patients and physicians have become more technologically adept and telecommunication technologies more advanced, purely virtual teledermatology has become easier to establish and operate in the 21st century. Although these programs do not consistently have the highest consult volumes, which may be due to the recent inception of certain platforms, they provide more widespread teledermatology services as a whole and thus increase access to dermatologic care. These programs also offer direct care to patients without the requirement of a primary care referral, contributing to the 70% of teledermatology programs that offer direct-to-patient care. The direct-to-patient care model has the potential to decrease waiting times, increase convenience, decrease operational costs, and meet instant care demands. However, some studies suggest that direct-to-patient teledermatology services result in less thorough histories, imprecise communication, and missed diagnoses. 21 –23 Thus, future investigation needs to focus on how to improve the functioning of these types of programs.
Although the median number of consultations per year is comparable to 2011, the maximum number of consultations has increased from 6,500 to 20,000 ( Table 1 ). 30 This suggests an increase in overall patient volume, likely due to improvements in workflow, more efficient technologies, and innovative teledermatology applications in the early 21st century. Across all practice settings, the mean number of consultations per year was substantially higher than the median number of consultations per year ( Fig. 3 ). This indicates that there are a select number of teledermatology programs that perform a considerably higher volume of consultations compared to the other teledermatology practices within their respective setting.
Notably, self-pay is the most frequently accepted payment method ( Fig. 4 ). This increased acceptance of self-pay for reimbursement may reflect the increased provision of direct-to-patient care and higher demands for teledermatology services in the modern era. As more patients desire convenient, efficient, and instant access to specialty care, the use of self-pay will likely continue to increase in the future, particularly if patient co-pays for office visits are significant.
Finally, store-and-forward is still the most commonly used modality to deliver teledermatology, likely due to increased convenience, lower costs, and higher quality of still images compared to live video ( Fig. 5 ). 30 As video communication technologies continue to advance in speed, quality, and accessibility, a hybrid approach of utilizing both store-and-forward and live-interactive may become more widely used.
In conclusion, the field of teledermatology is rapidly evolving in the 21st century. Teledermatology not only improves access to dermatologic care for remote underserved populations but also increases efficiency and convenience to meet the high demands of urban populations. Teledermatology achieves this while maintaining accurate diagnosis and management of skin disorders. In 2016, the number of active teledermatology programs and patients receiving teledermatology consultations in the United States increased, likely due to support from academic institutions, the development of innovative platforms, and the advancement of telecommunication technologies. Self-pay was the most frequently accepted payment method and a majority of programs offered direct-to-patient care. The modern era continues to be an exciting time for teledermatology. Future research will continue to redefine the ways in which it can best complement the current practices of dermatology as a whole.
Footnotes
Acknowledgments
The authors thank Mr. Charles Lappan for his assistance and participation in the survey. The authors also show their gratitude to the ATA for supporting this study.
Disclosure Statement
Ms. Yim declares that she has no conflicts of interest. Dr. Armstrong is a consultant for and has received honorariums from AbbVie, Amgen, Celgene, Janssen, Merck, Eli Lilly, Novartis, Pfizer, Modernizing Medicine, Regeneron & Sanofi, and Valeant. Dr. Armstrong has also participated on speakers' bureaus for AbbVie, Eli Lilly, and Janssen and has received grants from AbbVie, Amgen, Janssen, and Eli Lilly. Dr. Oh declares that he has no conflicts of interest. Dr. McKoy is an editor for and receives a salary from Merck Manuals. Dr. Florek declares that she has no conflicts of interest. This article has no funding source.