
Abstract
Background:
Age and race disparities in the use of new technologies—the digital divide—may be limiting the potential of patient-facing health information technology to improve health and health care.
Objective:
To investigate whether disparities exist in the use of patient portals designed specifically for the inpatient environment.
Methods:
Patients admitted to the six hospitals affiliated with a large, Midwestern academic medical center from July 2017 to July 2018 were provided with access to a tablet equipped with an inpatient portal and recruited to participate in the study (n = 842). Demographic characteristics of study enrollees were obtained from patients' electronic health records and surveys given to patients during their hospital stay. Log files from the inpatient portal were used to create a global measure of use and calculate use rates for specific portal features.
Results:
We found both age and race disparities in use of the inpatient portal. Patients aged 60–69 (45.3% difference, p < 0.001) and those over age 70 (36.7% difference, p = 0.04) used the inpatient portal less than patients aged 18–29. In addition, African American patients used the portal less than White patients (40.4% difference, p = 0.004).
Discussion:
These findings suggest that the availability of the technology alone may be insufficient to overcome barriers to use and that additional intervention may be needed to close the digital divide.
Conclusions:
We identified lower use of the inpatient portal among African American and older patients, relative to White and younger patients, respectively.
Introduction
The United States has invested heavily and made significant improvements in its telehealth infrastructure. 1 This infrastructure includes patient portals—an online access point for a patient to view their electronic health record (EHR) and communicate with their care team. Patient portals offer great potential to improve patient engagement and participation in their health care. 2 However, while use of portals has continued to rise in the aggregate, this growth has not been distributed evenly across Americans, with low-income, African American, rural, and older adults repeatedly showing lower rates of use of these technologies. 3 –8 These differences in portal use may contribute to the digital divide, the term used to describe the gap between adopters of new technologies and the nonusers who, due to social and geographic barriers, are unable to directly benefit from technological advances. 9,10
Researchers have suggested that portals available to patients in the hospital may help to close the digital divide in minority populations. 11 –13 Referred to as inpatient portals, this type of portal enables a hospitalized patient to connect to the EHR of the facility where they are admitted, providing access to their health information during their inpatient stay. 14 While similar to patient portals offered by ambulatory providers, inpatient portals differ in two critical ways as follows: access to an inpatient portal is commonly provided on devices supplied by the hospital, and this connection takes place on the hospital's internet network. As a result, inpatient portal use is independent of contextual barriers that have been noted in the literature as contributing to the digital divide, such as access to the internet. 4 Inpatient portals may thus serve as an entry point to the growing number of electronic and mobile resources available to patients to help them manage their health. 15
While the evidence base regarding the implementation, 16,17 usability, 18 experience, 19,20 and impact 21 –25 of inpatient portals is emerging, important questions remain about the demographic characteristics of these portal users, 26 and whether the disparities in use found in ambulatory patient portals persist in the inpatient environment. Current discussions in the literature suggest that these disparities are still observed when patients use an outpatient portal in the inpatient environment, 27 –29 but this evidence is based on use of ambulatory portals during inpatient stays, not use of an inpatient portal with information specific to the hospital stay. To date, existing research has been limited in its ability to assess inpatient portal usage beyond using data about portal account activation or surveys.
Our study addresses this gap in the literature through an analysis that quantifies inpatient portal usage from audit log files (server-based records of user actions) and examines the association of use with patient demographic characteristics. To the extent that inpatient portals overcome barriers of access to technology, they may serve as an important introduction for patients to the ways that technology can help them participate in their health care, potentially narrowing the digital divide.
Methods
Study Setting
This study was conducted at a large Midwestern academic medical center (AMC) that provides services across the continuum of care at six hospitals, including general tertiary care and specialty hospitals (i.e., brain and spine, cardiac, and rehabilitation), and 53 ambulatory care locations. The AMC performed a system-wide staged rollout of its inpatient portal, MyChart® Bedside (Epic Systems, Verona, WI), from July to October of 2016 in all six hospitals. MyChart Bedside is a password-protected application offered through an Android tablet provided to hospitalized patients. MyChart Bedside was designed by Epic Systems and provides patients with access to information from the EHR, grouped into 12 features (see Table 1 for a description of the features offered and their functions).
MyChart® Bedside Features and Their Functions
Study Design
This study is a part of a randomized controlled trial evaluating the impact of MyChart Bedside with or without an in-person training session. 30 Specifically, the parent study randomizes patients to one of four study arms upon their admission to the AMC based on their medical record number. The four intervention arms include the combination of high- (i.e., all MyChart Bedside features) or low-tech (i.e., limited MyChart Bedside features) and high- (i.e., in-person training) or low-touch (i.e., video training built into the MyChart Bedside application). The analytic sample for our present study included patients admitted from July 2017 through July 2018 randomized to the high-tech, low-touch study arm. We limited our analytic sample so as to focus our study analyses on use differences for all MyChart Bedside features based on patient demographics, as opposed to examining the effects of the training intervention which will be considered in future work.
At the AMC, nursing staff screen each admitted patient for eligibility to use a tablet computer based on the AMC protocol which excludes patients from receiving a tablet if they are under 18 years of age; legally blind; cannot speak and/or read English; involuntarily confined or detained; or of diminished decision-making capacity. Eligibility for this research protocol was further determined by the following criteria: admission in the last 24 h; patient available in their room and has received a tablet; and capable of providing informed consent. The consent process explained the purpose and details of the study. Upon consent into the study, participants were enrolled into a weekly raffle for a $100 gift card. During the hospital admission, patients were not prompted to use the patient portal by the study staff. Institutional review board approval was received for all study activities.
Patient Demographics
Patient demographic characteristics were obtained from two sources as follows: the EHR and an admission survey. For items reported in both the EHR and the admission survey (e.g., race), we tested our models using the data from both sources and found no differences, prompting us to use the source with lower rates of missing data. The EHR data were obtained from the AMC's information warehouse (IW). Age at the time of enrollment was grouped into deciles. Race was categorized as African American, White, or Other. The Other category included races with low frequencies in the AMC population (i.e., American Indian; African; Asian; Pacific Islander; or Other). A Charlson Comorbidity Index was calculated using a weighted score of 17 conditions derived from patient clinical data in the previous 12 months to control for the acuity of a patient's health condition. 31
Other patient demographics were obtained from a survey administered to study participants using a link to a Qualtrics-hosted questionnaire that the patient was directed to upon study enrollment; the survey could be completed in multiple sessions based on the patient's preferences. This study enrollment survey was developed by the research team by compiling validated instruments from publicly available surveys, including the American Community Survey, 32 and asked questions about language spoken, education, marital status, employment, income, insurance coverage, overall self-rating of physical and mental health, quality of life, and previous patient portal use. We also included a self-rated measure of health literacy, 33 which assesses the degree to which patients can obtain, process, and understand printed health information, as well as a self-rated measure of electronic health (e-health) skills. 34 e-Health skills specifically focus on an individual's ability to seek and understand health information from electronic sources.
For items reported on 5-point Likert scales, bivariate associations between the outcome variable of interest (MyChart Bedside use) and the item were compared between all five response levels and a dichotomized version of the item split around the mean value. If no difference in the association was observed, the dichotomous version of the variable was used in the analysis. For example, with both the self-reported measures of General Health and Physical Health, responses of “Excellent,” “Very Good,” and “Good” (i.e., At Least Good) were combined and compared to the combined “Fair” and “Poor” responses. For all variables, the number of missing responses to each question was reported. Patients whose data were completely missing were dropped from analyses.
MyChart BEDSIDE USE
Use of MyChart Bedside was assessed using audit log files obtained from the AMC's IW. These log files record every action taken by a user, including logging into the application, navigating the application, viewing application content, clicking on drop-down menus, requesting information, or sending/receiving messages, as well as all automatic functions, such as page loadings. Automatic actions that occurred as the MyChart Bedside application loads (e.g., connectivity confirmation and home page loading) were dropped from the analysis, leaving only active user tasks. These active user tasks were aggregated to the admission level. For users with multiple admissions, only MyChart Bedside data from the admission in which the user completed the survey were used in our analytical sample. The MyChart Bedside data were merged with the EHR data to calculate the total number of days a patient had the tablet by subtracting the date during an admission that a patient received their tablet from the discharge date.
To measure MyChart Bedside use, we used the total count of active tasks within an admission. This count is a sum of active tasks associated with the 11 different features that a user had access to plus active Administrative tasks such as logging into the application and viewing the home page. Because this variable was highly right skewed, the variable was linearized using a log transformation. We additionally decomposed the tasks within each activity to identify differences in the use of specific features. The percent of total actions spent on each feature was used to compare use of different features across demographic categories.
Data Analysis
The aim of our analysis was to identify relationships between patients' demographic characteristics and MyChart Bedside use. To begin, we conducted bivariate analyses comparing the mean total count of active tasks (untransformed) across the categories of each different patient demographic characteristic using either analysis of variance tests or estimation of correlation coefficients. All patient demographic characteristics were then regressed on the log transformed total count of active tasks using an ordinary least squares multivariate regression model. Post hoc analyses were run to compare differences between all categories of significant variables. For key demographic variables that emerged as significant in the multivariate model, we further examined differences in use of each of the 11 MyChart Bedside features using analysis of variance tests with Bonferroni correction to adjust for multiple group comparisons. Stata version 14 was used for all statistical analyses. 35
Sensitivity Analysis
Our initial inspection of the data revealed several potential outliers with respect to MyChart Bedside use in the sample. We applied a winsorizing approach that trimmed patients whose total active tasks exceeded two standard deviations from the mean from the analytic sample (n = 32). 36 We then reran our bivariate and multivariate analyses to examine differences in the model. While the means and standard deviations changed for some characteristics, the primary results of the multivariate model continued to hold true. As such, we present our results including the outliers. We also looked at two subsets of our full study sample (n = 842): (1) patients whose adjusted length of stay was less than 30 days (n = 830) and (2) patients whose adjusted length of stay was less than 15 days (n = 794); we found our model to be robust to these alternative specifications.
Results
Overall, the 842 patients in the high-tech, low-touch study arm who had completed the admission survey comprised our analytic sample. The sociodemographic characteristics of this study population are presented in Table 2. The 30–39 (21.7%) and 50–59 (21.7%) age groups were the largest proportions of the analytic sample, and there were more females (61.0%) than males (39.0%) and more Whites (79.5%) than African Americans (16.9%) or Others (3.7%). Of the survey questions, the questions about e-health skills (17.6%) and income (10.2%) had the highest proportions of missing responses.
MyChart Bedside User Demographic and Clinical Characteristics
Active tasks include navigating the application, viewing application content, clicking on drop-down menus, requesting information, or sending/receiving messages.
p < 0.05; ** p < 0.01; *** p < 0.001.
SD, standard deviation.
The results of the multivariate linear regression of the demographic characteristics on the log-transformed measure of total MyChart Bedside use with complete data are presented in Table 3. Given the log-transformation of the dependent variable, the magnitude of each independent variable is presented as percent change from either baseline or a 1-unit increase rather than in its native unexponentiated form. With respect to age, patients' use of MyChart Bedside in the two oldest age groups (i.e., 60–69 and ≥70) was found to differ significantly from patients' use in the youngest age group. However, the magnitude of this trend did not increase consistently. The 60–69 age group was found to use the inpatient portal 45.3% less than the 18–29 age group, but the 70 and over age group was found to use the inpatient portal 36.7% less than the 18–29 age group. Examining use by race category, White patients used the inpatient portal significantly more than African Americans; no differences were observed between Others and African Americans. For both age and race, post hoc tests revealed no differences between all categories in the adjusted model. Considering employment status, unemployed, retired, and patients on work disability were found to use the inpatient portal more than employed patients.
Adjusted Association of Patient Demographic and Clinical Characteristics with MyChart Bedside Use
Percent change is calculated by exponentiating the coefficient, subtracting 1, and then multiplying by 100.
p < 0.05; ** p < 0.01; *** p < 0.001.
Ref, reference.
Note: MyChart Bedside use is measured as the total number of active tasks, which includes navigating the application, viewing application content, clicking on drop-down menus, requesting information, or sending/receiving messages.
e-Health skills were also associated with inpatient portal use; those patients who agreed or strongly agreed that they had the skills to evaluate health resources found on the internet used MyChart Bedside significantly less than those who responded neutrally or disagreed that they had these skills. Finally, we found that an increase in the length of stay adjusted to reflect the number of days the patient had access to the portal significantly increased usage, indicating, perhaps not surprisingly, that the longer a patient had access to the portal, the more they used it.
Given significant associations between inpatient portal use and age and race, we further investigated differences in use of the various features available within MyChart Bedside based on these two demographic characteristics (Figs. 1 and 2). We excluded Administrative actions, which comprise roughly 23% of all use, from this analysis because this feature does not demonstrate how MyChart Bedside was being used. The four features used most frequently across age and race categories were, in descending order: Happening Soon, Dining on Demand, Tutorial, and My Health. Examining differences in the use of these four features by age category we found that use of Happening Soon and Tutorial differed between the younger and older age groups. Evaluating use of these four features by race we found that use of My Health significantly differed between African Americans and Whites, as did use of the Tutorial; no differences were found between Others and either African Americans or Whites for use of these features. Six additional features combined accounted for <10% of all use: I Would Like, To Learn, Notes, Taking Care of Me, Messages, and MyChart; no differences were observed between age or race categories for these features.
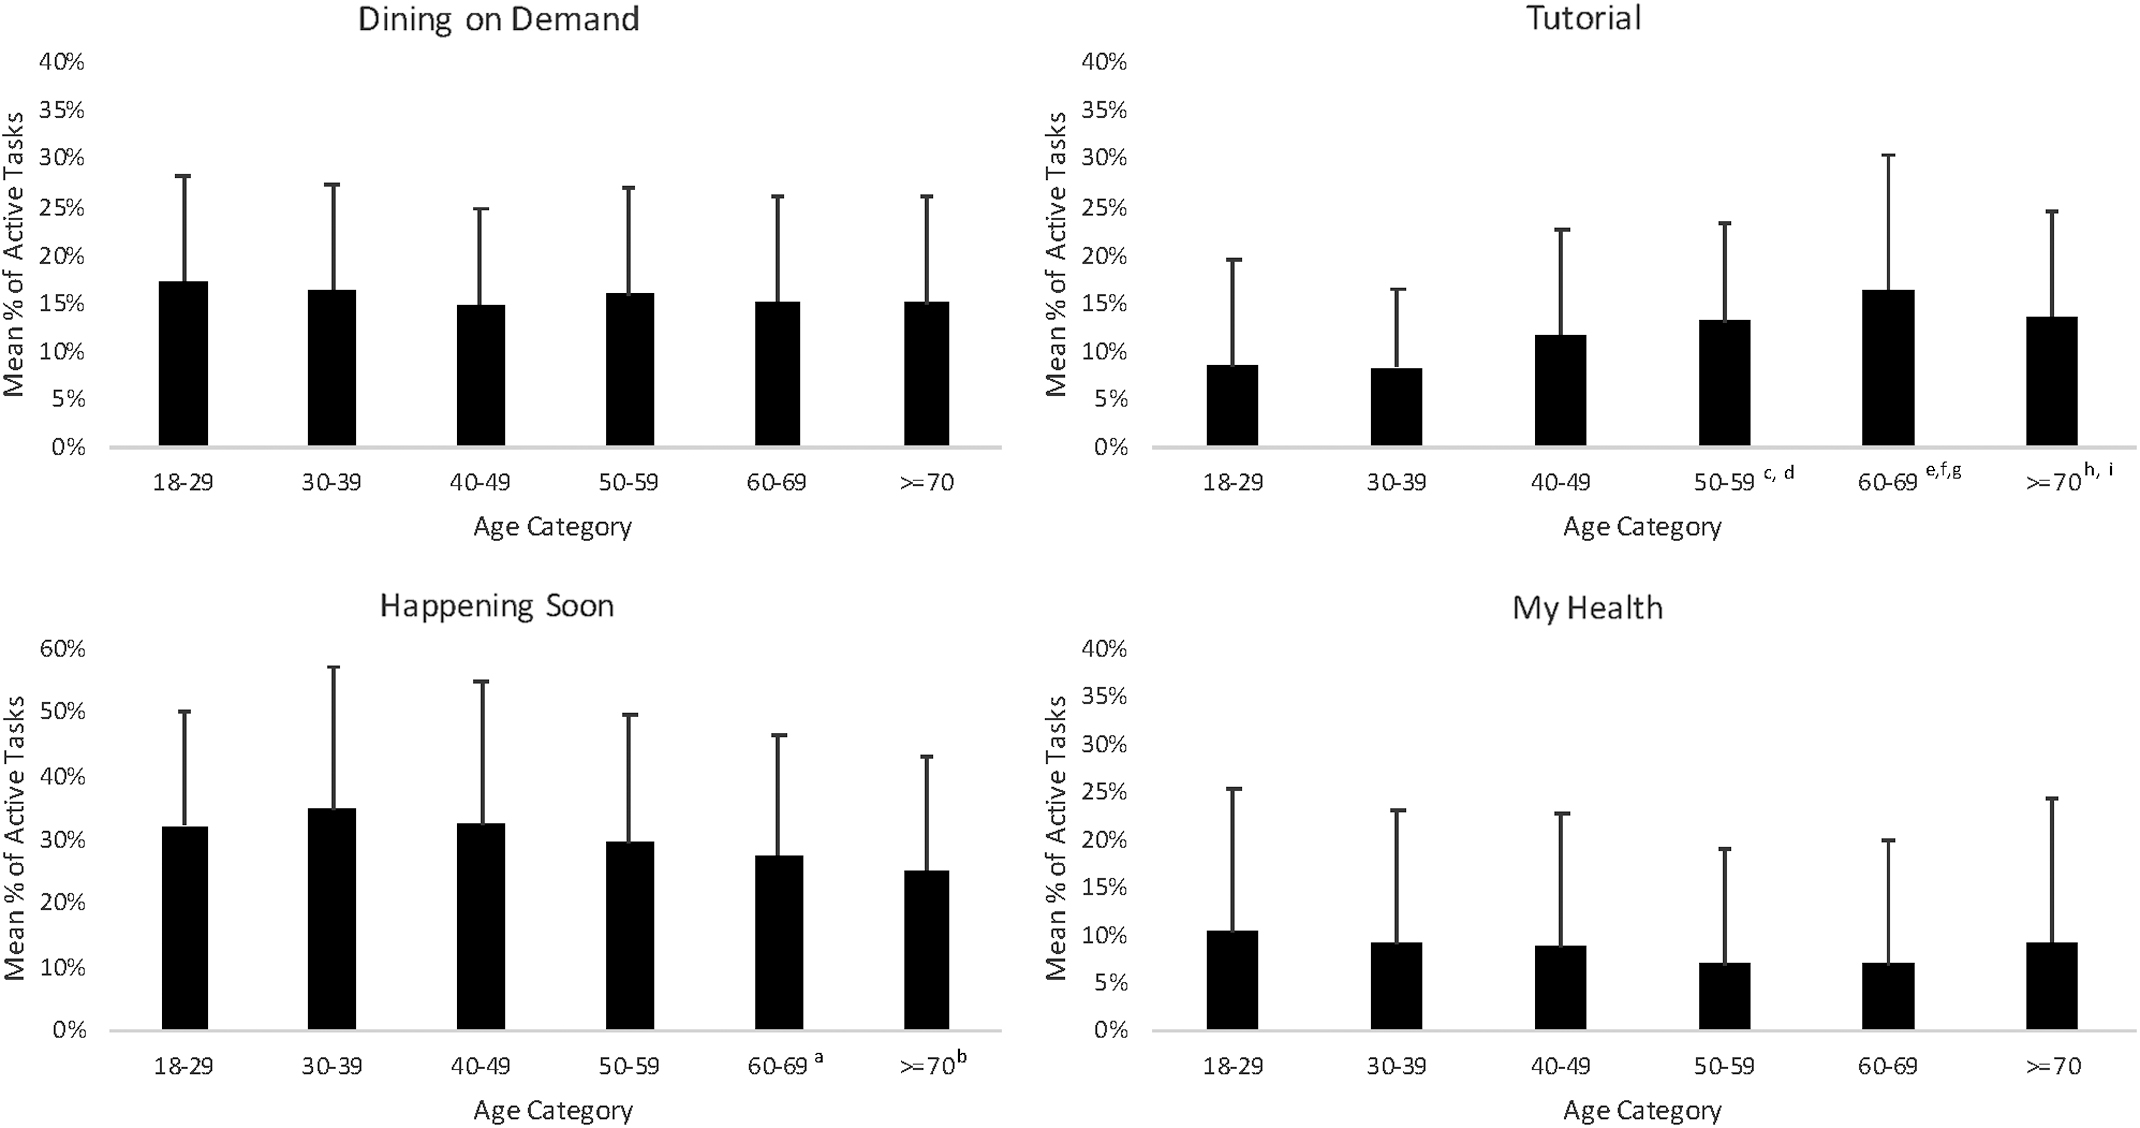
Use of four most frequently used MyChart® Bedside features, by age category. Significance determined from analysis of variance with Bonferroni correction. a60–69 versus 30–39, p = 0.02; b≥70 versus 30–39, p = 0.02; c50–59 versus 18–29, p = 0.004; d50–59 versus 30–39, p < 0.001; e60–69 versus 18–29, p < 0.001; f60–69 versus 30–39, p < 0.001; g≥60–69 versus 40–49, p = 0.005; h≥70 versus 18–29, p = 0.02; i>70 versus 30–39, p = 0.02.
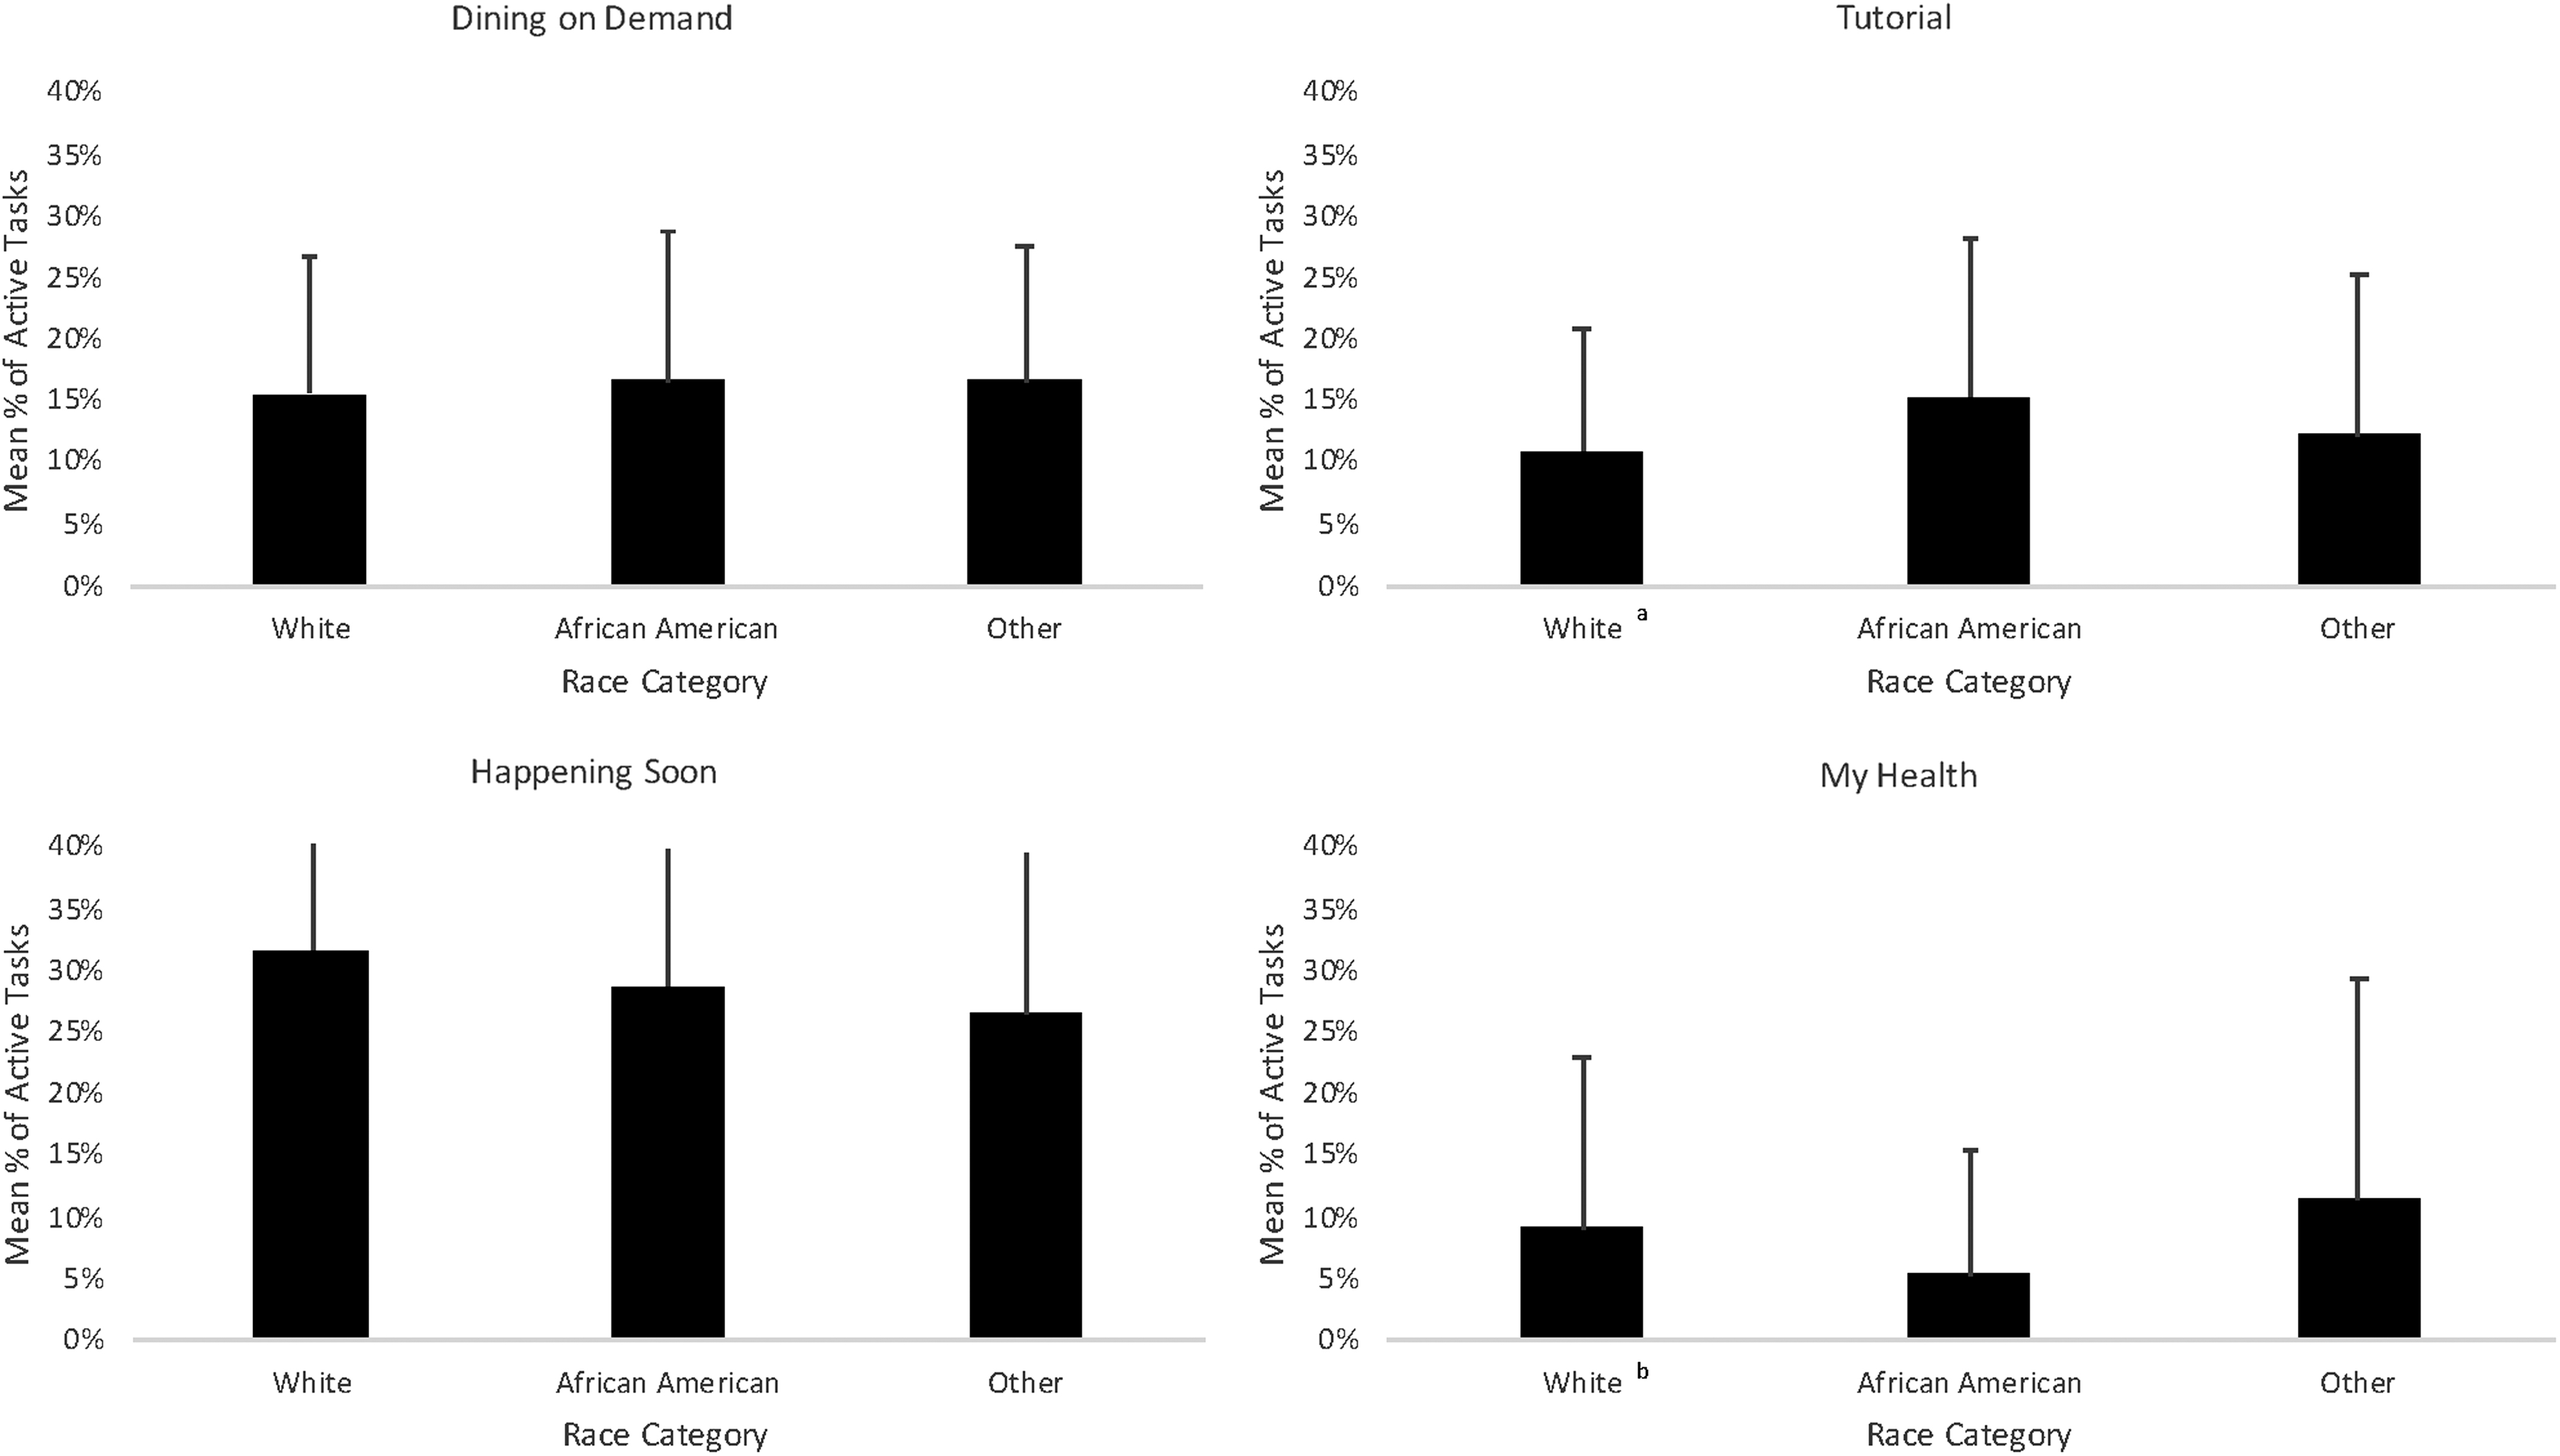
Use of the four most frequently used MyChart Bedside features, by race category. Significance determined from analysis of variance with Bonferroni correction. aWhites versus African Americans, p < 0.001; bWhites versus African Americans, p = 0.009.
Discussion
As inpatient portals are increasingly implemented, it is important to understand how and what types of patients use these tools. Our study examined the sociodemographic characteristics of users of an inpatient portal deployed across a six-hospital AMC and found notable disparities in use, some of which were counter-intuitive.
First, the age disparity we found is consistent with findings from previous studies of ambulatory portal use in both outpatient and inpatient settings. 3 –5,27 We found that older patients used the Tutorial feature more than younger patients, suggesting that these patients were trying to learn how to use the technology on their own. Older adults may take longer than younger adults to accept a new technology because of their need to gain awareness and understanding of a new technology, including learning how such technology can help them. 37 Nonetheless, the tutorial alone was insufficient to spur use on par with levels of the younger patients. Older patients may need more training resources beyond the tutorial to increase use.
The use disparity we identified between African Americans and Whites is also consistent with findings presented from prior studies, but our results suggest that explanations related to barriers to access to technology may be overstated, and the causes of this phenomenon may be potentially more nuanced. By providing patients with both a tablet and access to the internet, the study design diminished any divide related to access to technology. As a result, our findings cannot be attributed to differences in access to the tools, and yet we still found evidence of a disparity in use. Thus, providing the technology alone as a solution to reduce the digital divide appears to be insufficient.
Prior work has suggested that African Americans may have lower health literacy and electronic health literacy than Whites, 38 –41 suggesting that these variables may moderate the relationship between race and inpatient portal use. For instance, Davis et al. found evidence that suggests a positive relationship between health literacy and use of an ambulatory patient portal during hospitalization. 28 However, our study did not find a direct relationship between health literacy and inpatient portal use and, in fact, found a negative relationship between e-health skills and inpatient portal use. Intriguingly, African Americans checked their health status using the My Health feature—a feature that may require a relatively high health literacy—less often than Whites, suggesting that health literacy and/or e-health skills may influence the use of specific MyChart Bedside features for different groups. Alternatively, other presently unidentified factors may explain this disparity in inpatient portal use.
Future work may need to focus explicitly on examining subgroup dynamics related to the relationships between psychosocial factors and technology use. Related, the lack of findings in our adjusted model about a difference in use between the Other group and either African Americans or Whites suggests that there may be more complex issues influencing use patterns in the Other group. The Other group had a relatively small number of enrolled participants who showed large variation in use warranting further exploration of inpatient portal use patterns that may be associated with other race subgroups. In addition, there is a need to consider the role of interventions such as training or modifications to the technological interface that have the potential to mitigate the identified disparities.
Study Limitations
Our findings should be considered in light of two key limitations. First, our study may have limited generalizability as we examined the use of a single application (MyChart Bedside) in a single AMC. However, as MyChart Bedside is offered by Epic, which is the installed EHR in nearly 30% of U.S. hospitals, 42 our findings are likely widely relevant.
The second limitation concerns our relatively small study sample size. This study was meant to be descriptive in nature and was not designed to test causal hypotheses. Our study group may be systematically different from patients who were not MyChart Bedside users, those who did not consent to our study, or those who did not complete the survey items used in these analyses.
Conclusion
Our study found lower use of an inpatient portal among older and African American patients, compared with younger and White patients, respectively. These findings suggest that the digital divide persists with inpatient portals, despite that tablets and internet access were available to all patients in our study. In practice, access to technology may not be the only barrier that needs to be addressed to reduce the digital divide. While we have noted traditional age and race disparities in use, inpatient portals afford an opportunity to explore other potential barriers to health information technology use within the context of the relationship with a hospitalized patient. For instance, to promote inpatient portal use across patient groups, an educational intervention may be important. Moving forward, research efforts that seek to clarify environmental and personal upstream factors that could contribute to the disparity we observed can help to better target intervention development and support efforts to reduce differences in technology use.
Footnotes
Acknowledgments
The authors thank Alice Gaughan, Seth Scarborough, Zhana Smith, Lindsey Sova, Ayanna Scott, Jaclyn Volney, and Toby Weinert, all affiliated with the authors' organization, for their assistance with this project. They are also extremely grateful to the care team members and patients who participated in this study. This work was supported by the Agency for Healthcare Research and Quality (AHRQ) Grants R01HS024091, R21HS024767, P30HS024379. While this research was funded by AHRQ, the study sponsor had no involvement in the collection, analysis, or interpretation of data; in the writing of this article, or in the decision to submit the article for publication.
Disclosure Statement
No competing financial interests exist.