
Abstract
Background:
To validate our deep learning algorithm (DLA) to read diabetic retinopathy (DR) retinographies.
Introduction:
Currently DR detection is made by retinography; due to its increasing diabetes mellitus incidence we need to find systems that help us to screen DR.
Materials and Methods:
The DLA was built and trained using 88,702 images from EyePACS, 1,748 from Messidor-2, and 19,230 from our own population. For validation a total of 38,339 retinographies from 17,669 patients (obtained from our DR screening databases) were read by a DLA and compared by four senior retina ophthalmologists for detecting any-DR and referable-DR. We determined the values of Cohen's weighted Kappa (CWK) index, sensitivity (S), specificity (SP), positive predictive value (PPV) and negative predictive value (NPV), and errors type I and II.
Results:
The results of the DLA to detect any-DR were: CWK = 0.886 ± 0.004 (95% confidence interval [CI] 0.879–0.894), S = 0.967%, SP = 0.976%, PPV = 0.836%, and NPV = 0.996%. The error type I = 0.024, and the error type II = 0.004. Likewise, the referable-DR results were: CWK = 0.809 (95% CI 0.798–0.819), S = 0.998, SP = 0.968, PPV = 0.701, NPV = 0.928, error type I = 0.032, and error type II = 0.001.
Discussion:
Our DLA can be used as a high confidence diagnostic tool to help in DR screening, especially when it might be difficult for ophthalmologists or other professionals to identify. It can identify patients with any-DR and those that should be referred.
Conclusions:
The DLA can be valid to aid in screening of DR.
Introduction
It is estimated that 415 million people worldwide were suffering with diabetes in 20151 and that number is predicted to rise to around 640 million by 2040. 2 Diabetes mellitus (DM) is one of the main causes of morbidity and mortality in the developed world. It affects major vessels, called macroangiopathy, which induces stroke and myocardial infarction, and microvessels, called microangiopathy, which induces retinopathy, nephropathy, and neuropathy. 3,4 Diabetic retinopathy (DR) is the leading cause of blindness in the middle-aged population. 5 Its progress is related to duration of DM and other risk factors such as glycemic control or arterial hypertension; therefore, its prompt detection is essential. 6
Currently DR can be detected by fundus examination, by biomicroscopy, or as mostly recommended, by retinography, which is the basis of current DR screening. Screening is recommended by all diabetes and ophthalmology associations, who recommend an annual retinography for all DM patients from first diagnosis, except for type 1 DM who should be examined at diagnosis and at 5 years with annual examination since this moment. 3,6 –8 Despite that, it is difficult to screen annually for all DM patients, as we demonstrated in our 2015 study. 9
To achieve a greater control of the fundus, the following systems have been proposed, some of which have already been implemented: Telemedicine, using nonmydriatic fundus cameras and involving various professionals (family doctors, endocrinologists, and ophthalmologists). We have used this since 2007 with the aid of family doctors and endocrinologists.
10
Despite having four nonmydriatic cameras available in our Health Care Area (one per 65,000 inhabitants) we have only been able to achieve a 32.65–41.16% completion rate for our population each year (Table 1). Development of diagnostic aid systems like Clinical Decision Support System (CDSS). This personalizes screening according to risk factors. We developed a CDSS based on our population's risk factors that we included in our electronic medical histories in primary care.
11,12
Automatic assessment of fundus retinographies. Artificial intelligence (AI) began in 1956 and showed promising results in computer learning strategies. Later, the introduction of machine learning algorithms (MLAs) has made predictions based on the data introduced in a training phase. These MLAs have been widely accepted in computer vision and predictive analysis. With the improvement in processing power, a new group of MLAs has been developed. One of these was deep learning algorithm (DLA), which uses multiple processing layers to learn the data with multiple levels of abstraction, allowing image recognition from a previously determined trained image point. The incorporation of DLA reading systems has been shown to speed up the reading of images.
Results of Our Screening Program
Characteristics of our DM patients classified according to year of evaluation; percentages are from a total of our 17,792 DM patient population.
DM, diabetes mellitus; DR, diabetic retinopathy.
The model of a DLA is constructed with artificial neurons that are organized into layers in a hierarchical way. Every connection has a parameter that corresponds to the weight of the connection, and the function of every neuron is to transform the input into a calculated output value. The aggregate of all inputs passes through an activation function that calculates the neuron output. These hierarchical models are able to learn multiple levels of representation that correspond to different levels of abstraction, thus enabling the representation of complex concepts in a compressed way. In DLA, the term convolutional neural network (CNN) was coined. This is a subfield of DLA that has proven to be very effective for image classification, detection, and segmentation. The first successful CNN was presented by Lecun et al. 13 and was designed for hand-written digit recognition. The breakthrough in DLA took place with the publication of Krizhevsky et al., 14 when DLA was established as the subfield that should be used in automating learning images.
The aim of present study is to validate in a nonselected representative population the efficacy of our previously developed DLA, 15 using a sample of retinographies from our archive of diabetes patients who were part of the screening program.
Materials and Methods
Setting
The reference population in our area is 247,174. The total number of DM patients registered with our health care area (University Hospital Sant Joan, Tarragona, Spain) is 17,792 (7.1% of our population). Our DR screening program has been ongoing since 2007 and includes an annual retinography for all DM patients. The complete screening program is described elsewhere 9 (Table 1).
Design
Retinographies were chosen from our archive. To validate the results, we compared the results of retinographies read by the DLA with those read by four masked senior retina ophthalmologists.
Inclusion Criteria
Randomized retinographies of our archive of screened DM patients.
Exclusion Criteria
No exclusion criteria were set before the analysis.
Ethics and Consent
The study was carried out with the approval of the local ethics committee (approval no. 13-01-31/proj6) and in accordance with revised guidelines of the Declaration of Helsinki. Patients gave signed consent after being informed about the objective of the study. Subjects were recruited according to the screening program protocol, which uses a systematic recruitment technique.
Model Construction
In our previously published work, 15 we reported how we created our DLA for predicting the presence of DR. Briefly, our baseline model used a 3 × 640 × 640 input image obtained from a minimal preprocessing step, in which only the external background borders were trimmed and later resized to the required input size. It is a convolutional network of 391,325 parameters, divided into 17 layers. Layers are further divided into two groups: the feature extractor and the classifier. Each layer is a stack of a 3 × 3 convolution with stride 1 × 1 and padding 1 × 1 followed by batch normalization and a ReLU activation function.
Three datasets have been used for build test and training using the model: EyePACS, 16 Messidor-2, 17 and a sample of 19,230 tagged retinographies from our DM population (different from the validation series).
The EyePACS dataset 16 has the images of 44,346 different patients. For each one of them, left and right eye images are available, making a total of 88,692 retina fundus images. The dataset is highly imbalanced having 65,343 images of class 0 (no DR), 6,195 of class 1 (mild DR), 13,153 of class 2 (moderate DR), 2,087 of class 3 (severe DR), and 1,914 of class 4 (proliferative DR). The Messidor-2 dataset comprises a total of 1,748 retina fundus images, which is also highly imbalanced, having 1,017 images of class 0, 270 of class 1, 347 of class 2, 75 of class 3, and 35 of class 4. Our sample retinographies have 15,123 images of class 0, 2,576 of class 1, 944 of class 2, and 587 of class 3, but did not have any class 4 retinographies.
As the incidence of proliferative diabetic retinopathy (PDR) is very low (Table 1) in our population (only 37 patients developed PDR between 2007 and 2018), we decided to combine levels 3 and 4. Therefore, our DLA levels are: Level 0 = no DR, level 1 = mild DR, level 2 = moderate DR, and level 3 = severe or higher DR (Fig. 1).
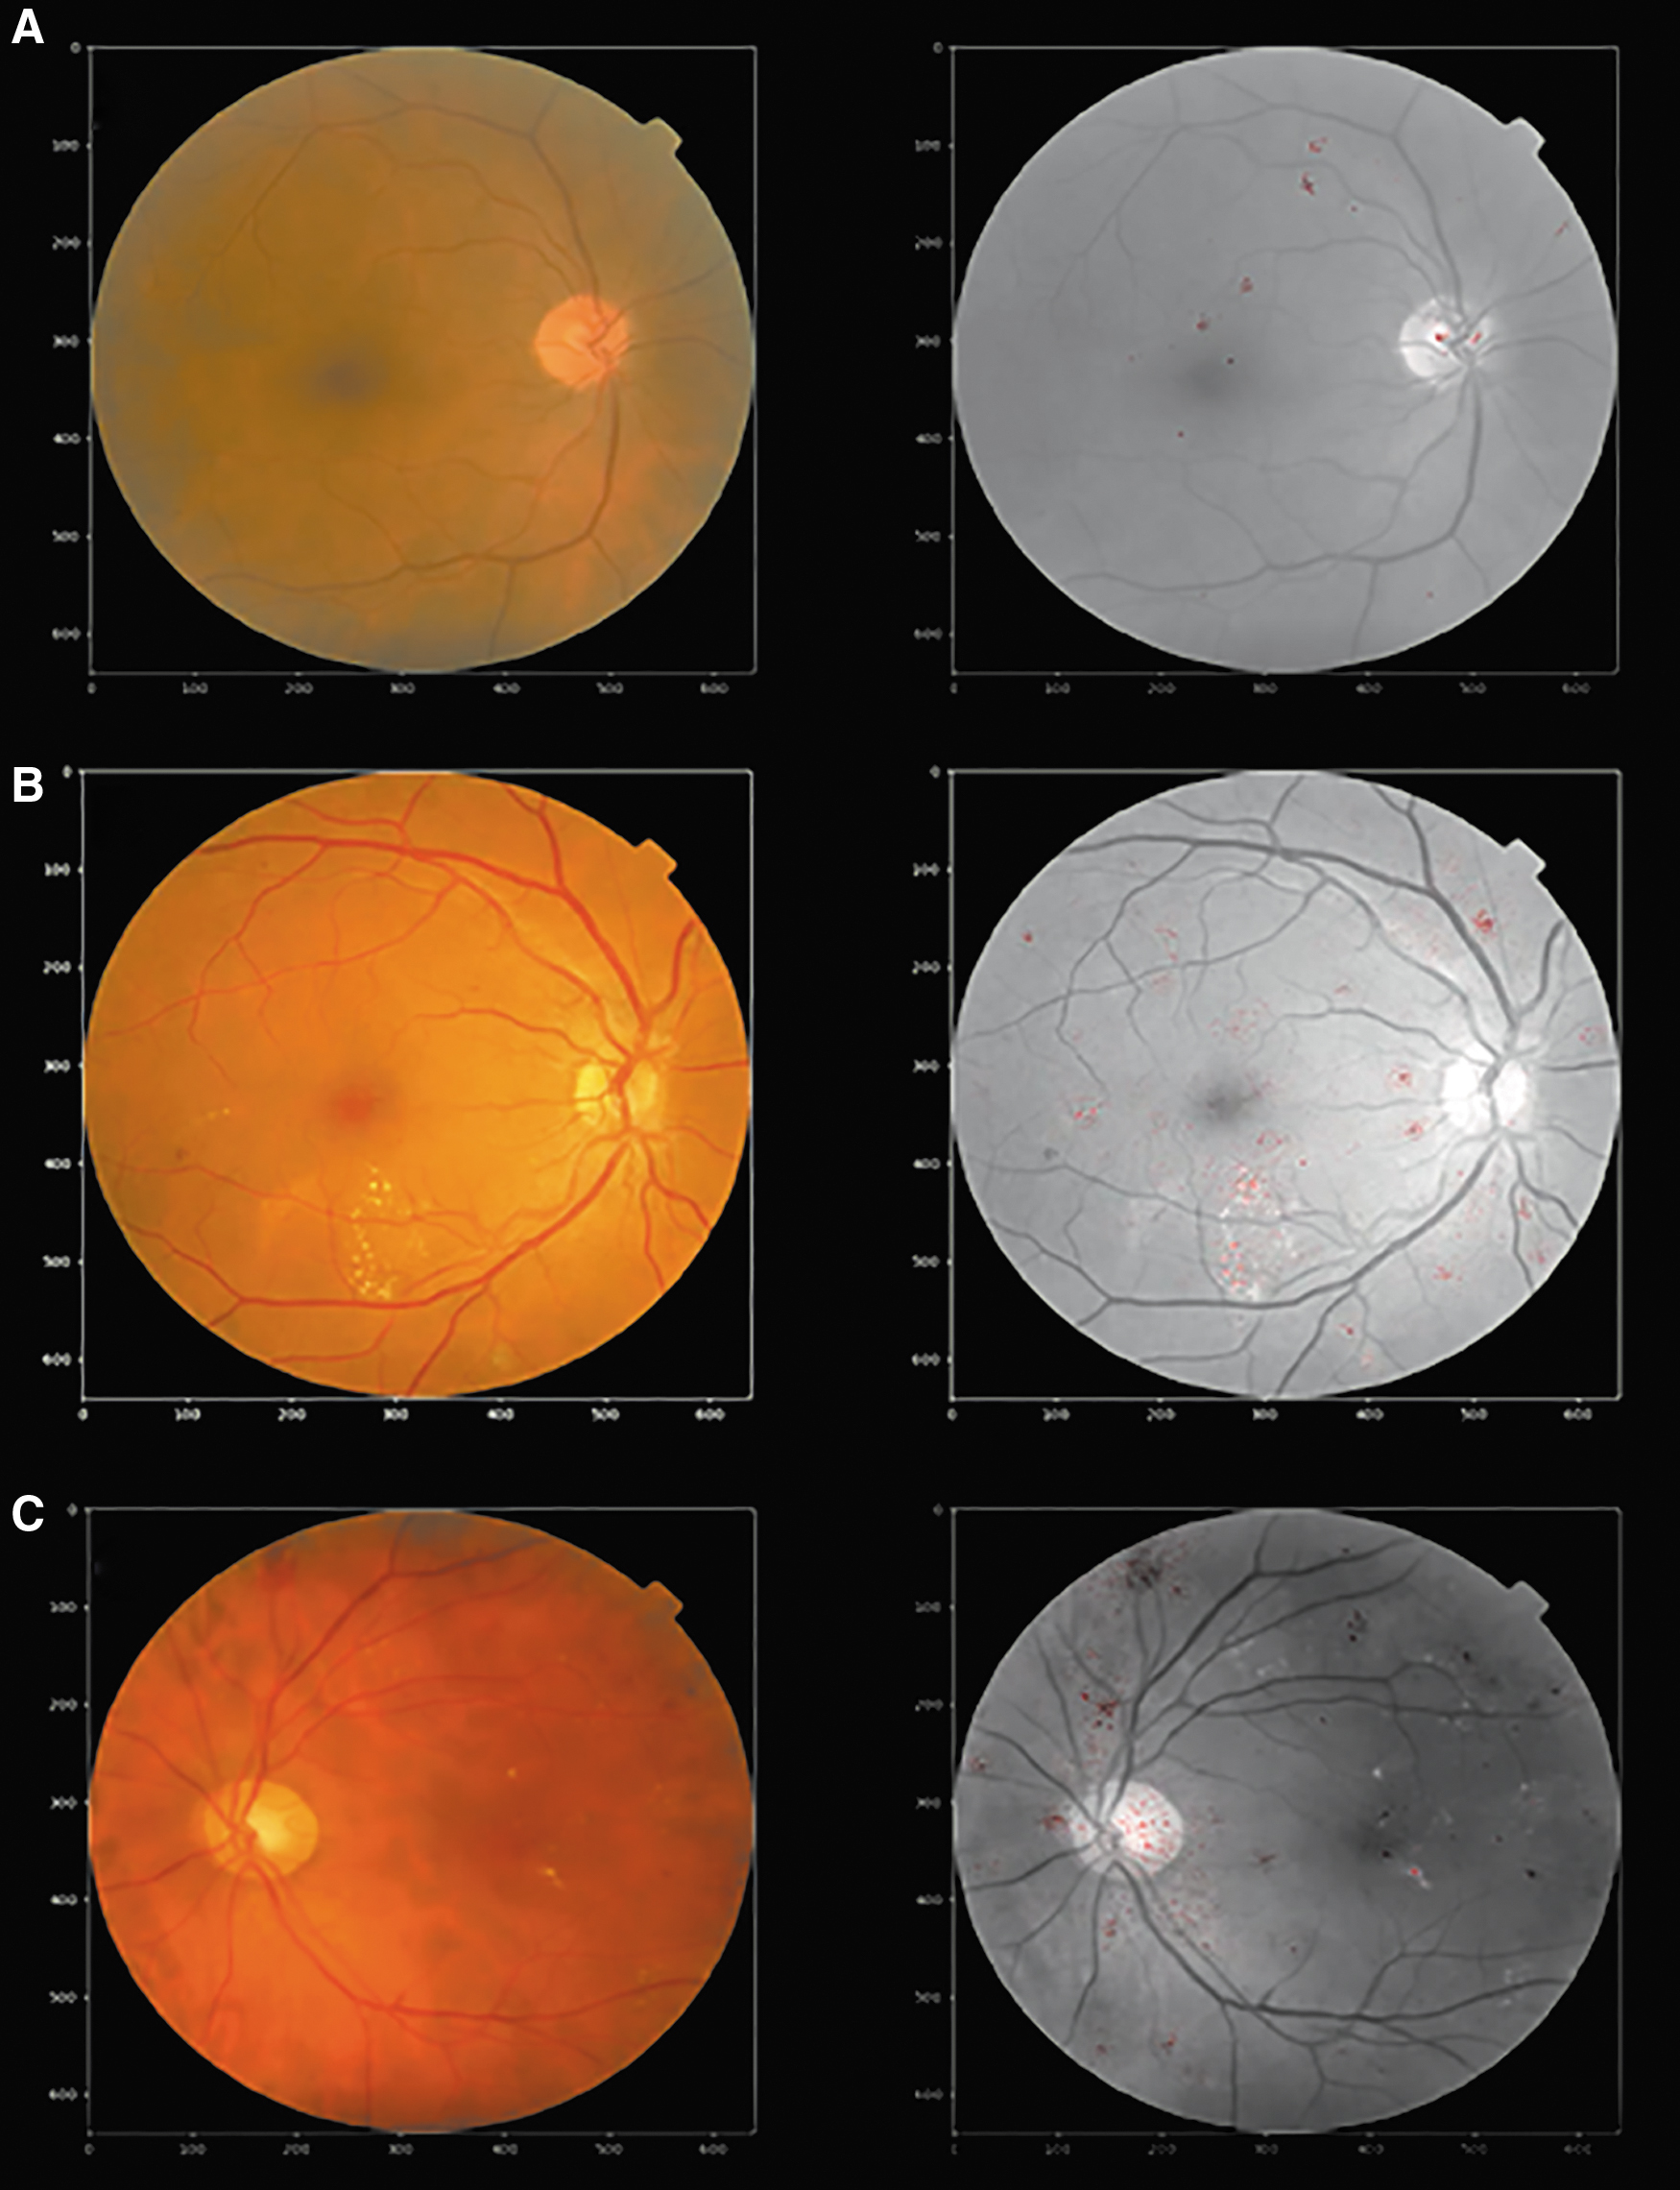
Examples of levels of DR in DLA
The DLA was constructed in the following steps: A training set of 35,126 images and a test set of 53,576 in EyePACS, followed by testing on 1,748 images in Messidor-2, correcting any errors. Next, we tested the new DLA on 19,230 retinographies in our population (different from those we have used for validation in the present study) that allowed us to make the final version of our DLA device. This new device contains images of a real population, which we think is very important to avoid possible errors induced by public datasets. In fact, we encountered errors in the classification and in the gradeability of these public datasets that we eliminated before building our device.
Procedure for Validation
A total of 38,694 retinographies (different from those used in the construction of the DLA) were randomly taken from our 17,792 patients between January 1, 2007 and December 31, 2017. Screening included one 45° field retinography taken by a nonmydriatic fundus (TOPCON® TRC-NW6S) centered on the macula. First, the reading was made by the DLA, and then a second reading was made by four masked senior retina ophthalmologists. DR was diagnosed when at least four microaneurysms were present in the fundus photograph, with or without hard or soft exudates, in the absence of other known causes of the changes.
In the present study, DR severity levels are based on EyePACS that uses the International Council of Ophthalmology guidelines 18 and modified according to Messidor-2 DR gradation. Then the retinographies were placed into four levels: (1) Level 0 = no DR, (2) Level 1 = mild DR (only microaneurysms), (3) Level 2 = moderate DR (microaneurysms with a minimum of 5 and a maximum of 15 and/or retina hemorrhages inferior to 5), and (4) Level 3 = severe DR or proliferative DR (microaneurysms more than 15 and hemorrhages more than 5 or presence of new vessels elsewhere).
Then we used a two-step validation: Step 1—any-DR was defined as the presence of levels 1, 2, or 3 of our classification and Step 2—referable-DR was defined as moderate nonproliferative DR or above (levels 2 and 3 of our classification).
Statistical Methods
Data evaluation and analysis were carried out using the SPSS 22.2 statistical software package, and statistical significance was set at p < 0.05.
If more than one-third of the retinography was obscured, it was considered ungradable.
An objective measure of the classification capabilities of a human or machine system requires the derivation of index measures that enable an exact measure of its performance. Even the easiest classification task, that is, binary classification, requires the usage of many different indices to find a good approximation of classification performance. For binary classification, instances of a set are classified as belonging or not to a class. Four possible outcomes can occur:
a positive class being correctly classified (true positive [TP]),
a positive class being incorrectly classified (false positive [FP]),
a negative class being correctly classified (true negative [TN]), and
a negative class being incorrectly classified (false negative [FN]).
For statistical analyses, we constructed a confusion matrix and determined the following indices:
Sensitivity (S), also known as recall, hit rate, or TP rate, which measures the proportion of actual positives that are correctly identified as such,
specificity (SP), also known as selectivity or TN rate, which measures the proportion of actual negatives that are correctly identified as such,
the positive predictive value (PPV), also known as precision, which measures the proportion of correctly classified positives over the total number of predicted positives,
the negative predictive value (NPV), which measures the same in negative cases,
the FP rate, also known as type I error, which is the proportion of all negatives that still yield positive test outcomes, and
the FN rate, also known as type II error, which is the proportion of positives that yield negative test outcomes with the test.
For measuring the effectiveness of the classification model, we used Cohen's weighted Kappa (CWK) index 19 defined for the case of ordered categories. The interpretation of agreement of the CWK assessed by Landis and Koch 20 is as follows:
<0.00—no agreement
>0.00–0.20—insignificant or slight agreement
0.21–0.40—discreet or fair agreement
0.41–0.60—moderate agreement
0.61–0.80—substantial or good agreement
0.81–1—almost perfect agreement
The results of the CWK were described with a 95% confidence interval (CI). We calculated the overall agreement of the DLA in detecting any-DR and referable-DR.
Results
Demographic Variables of Sample Size
From 2006 to 2017, we screened a total of 17,792 DM patients. We randomly selected 38,694 retinographies for teaching our developed DLA. Results of our screening program are described in Table 1, and the demographic characteristics of our 17,792 patients are described in Table 2.
Frequency and Descriptive Data of Diabetes Patients in Our Population
Mean ± SD (minimum—maximum), data are referred to whole 17,792 patients of our databases at the end of 2018.
SD, standard deviation.
Results of the Deep Learning Study
A total of 38,694 retinographies from our screened DM patients were learned by our DLA, which determined that 268 (0.69%) were not valuable due to its bad visualization. A total of 38,424 retinographies were reviewed by an ophthalmologist, who considered that 85 were not valuable due to poor visualization, which represents a DLA error rate of 0.22%.
The other 38,339 retinographies were separated by the DLA into two classifications: (1) the presence of any-DR and (2) the presence or not of referable-DR. Finally, we related a study of interobserver variability and a study of efficacy of DLA in DR grading in moderate or severe DR.
Statistical Study According to the Presence of any-DR
Table 3 shows the result comparison of the DLA results with the masked ophthalmologists with an agreement almost perfect with a CWK = 0.886 ± 0.004 (95% CI 0.879–0.894).
Agreement Between Observers and Deep Learning Algorithm Measured by Cohen's Weighted Kappa in the Three Studies: Presence of Any-Diabetic Retinopathy and Referable-Diabetic Retinopathy and Presence of Severe Diabetic Retinopathy in Front Moderate Diabetic Retinopathy
CI, confidence interval; CWK, Cohen's weighted Kappa.
The other statistical results of the any-DR were: S = 0.967, SP = 0.976, PPV = 0.836, NPV = 0.996, FP rate or error type I = 0.024, and FN rate or error type II = 0.004.
Statistical Study According to the Presence of Referable-DR
The comparison of the DLA results with the masked ophthalmologists’ and DLA results in a good agreement but not almost perfect with a CWK = 0.809 ± 0.005 (95% CI 0.798–0.819). The other statistic results of the referable-DR were: S = 0.998, SP = 0.968, PPV = 0.701, NPV = 0.928, FP rate or error type I = 0.032, and FN rate or error type II = 0.001 (Table 3).
Differences Between Observers
After excluding the 353 that were not valuable, the number of retinographies read was separated for each senior retina ophthalmologist. O1: read 9,589, O2: read 9,600, O3: read 9,579, and O4: read 9,571. Table 4 describes the results according to S, SP, and CWK agreement between the four readers, and the differences were not significant.
Statistical Results of No-DR Versus Any-DR and No-DR or Mild-DR Versus Referable-DR
Differences of Classification of DR between DLA and Readers
Results of the study of the diagnosis of moderate-DR and severe-DR demonstrate that the system does not accurately differentiate both forms. Table 3 shows the distribution of the retinographies according to the diagnosis of the observer and the diagnosis of the DLA. The percentage of FPs regarding the presence of moderate DR is 22.11% (249 cases) and in the case of severe DR of 36.13% (658 cases).
Results for severe-DR against moderate-DR shows moderate agreement with a CWK = 0.525 ± 0.014 (95% CI 0.495–0.555). The other statistics were as follows: S = 0.982, SP = 0.572, PPV = 0.639, NPV = 0.977, FP rate or error type I = 0.013, and FN rate or error type II = 0.55.
In the Table 3, we observe 20 cases classified as severe-DR by algorithm but as moderate-DR by observers; all cases correspond to venous retinal branch occlusion in a context of moderate DR.
In conclusion, we can see that the agreement between ophthalmologist and DLA to distinguish severe to moderate DR is lower than in any-DR and referable-DR, being a good agreement but not almost perfect since the CWK is below 0.80, also although there is good S and SP, the PPV is only 0.638 and the FP rate 0.019; both data are inferior to values obtained in cases of any-DR and referable-DR. The results also show that the DLA tends to classify the DR in a more severe degree.
Discussion
DM has become a pandemic in the 21st century, and screening services are inadequate for patients’ needs, 21 as we have previously reported, 9 despite the collaboration of other professionals, such as family doctors or endocrinologists. 22
The introduction of AI systems in this field seems to be able to help the management of patients by indicating when they should be screened, by personalizing screening based on patients’ risk factors, 23 and automatic systems have been evaluated for reading images. The early systems were not perfect, although they had good SP values of between 0.87 and 0.95 but they had low S of between 0.49 and 0.68. 24 –26 Newer techniques, such as the convolutional neural netwok (CNN) system in a DLA, has improved the SP of the systems. Currently, the IDx-DR X2.127–29 reading system is authorized by the Food and Drug Administration to detect cases of severe DR.
Ting et al. 30 recommend that when developing any automatic image reading system, two components are needed to build the DLA: a ‘brain’ made up of CCNs and the datasets.
In the present study, we developed a reading system based on three databases: the EyePACS, the Messidor 2, and a sample of 19,230 retinographies from our population. The robustness of the databases we have used and the different phases of training we have followed have allowed us to construct a DLA that yields high CWK levels when identifying any-DR in retinographies (CWK = 0.886 ± 0.004, 95% CI 0.879–0.894). We have also had excellent results for both S (96.7%) and SP (97.6%). The present study yielded a PPV of 0.836% and a NPV of 0.996%. The FP rate, or error type I, was 0.024, and the FN rate, or error type II, was 0.004. Similarly, the referable-DR results are very good, with a CWK = 0.809 (95% CI 0.798–0.819), S = 0.998, SP = 0.968, PPV = 0.701, NPV = 0.928, FP rate or error type I = 0.032, and FN rate or error type II = 0.001.
There are many publications on the uses of DLA in DR learning, 24 –31 and most of them use publicly available databases to validate DLAs. Of the publicly validated DLA systems, we should mention both the IDx-DR X2.1 system 29 and Gulshan et al. 27 from Google Al Healthcare that were constructed with robust methodologies. The former yielded a CWK value of 0.980 higher than the 0.886 in our present study for any-DR, with a good S of 0.968 similar to our 0.967, but with less S than our DLA (0.87% in front of our 0.976). The latter study validated 10,000 retinographies extracted from EyePACS and Messidor-2 and yielded a CWK of 0.991 with a S of 0.991 and a SP of 0.99, all three values being higher than our results. However, we should take into account that validations of IDx and Google developed DLAs were made in public databases rather than in a real population, as it happens in our system.
Another interesting study, by Ting et al., 31 validated its DLA in multiethnic study databases. They used eight multiethnic datasets that underwent two-field retinographies (one centered on the optic disc and the other on the macula) but they had been graded previously by board-certified ophthalmologists. Their results for any-DR achieved a CWK = 0.863 and for referable-DR a CWK = 0.963, both values higher than our results. However, differences in DR grading (two retinographies rather than one in our study) make it difficult to compare the results. Summarizing the results of published studies, we can conclude that when the DLA systems were applied to controlled retinographies of high quality, the results were good.
However, it is important to apply the DLA to a real population, which is what the current study has done. We think that the real population has different characteristics than public datasets, which can induce errors in the interpretation of the results. In public datasets, the images are of different sizes and different photographic quality (in fact, in EyePACS we encountered about 20% of images with poor gradation, which cannot be read by our ophthalmologists), in addition the centering of many of them is not correct (this is specially frequent in EyePACS dataset); if we proceed to build a DLA exclusively based on these two datasets and also validate the DLA on them, we will possibly commit errors in the diagnosis of the lesions that we observed in the retina. The strength of our DLA is to have included 19,230 retinographies of our own population, with good gradeability and correctly labeled according to the type of retinopathy. In addition, at the same time we submit a rigorous control to the images that we incorporate from the public databases (EyePACS and Messidor-2).
One difficulty with current DLAs and that has affected our DLA, too, is the inability to correctly classify DR at different levels of severity. In the present study, grading as moderate or severe DR by our DLA demonstrated that it classifies DR more severely than ophthalmologists (Table 3). We might need a new system of grading the severity of DR for DLA equipment. Takahashi et al. 32 proposed a novel way of grading DR, based on modifying NCD Risk Factor Collaboration, 33 which has three stages: (1) simple diabetic retinopathy, (2) preproliferative diabetic retinopathy, and (3) PDR. The correct classification of DR is a common defect to the different DLAs that currently exist, and therefore, they are limited to detecting either any-DR or referable-DR.
Possibly one of the causes is the lack of sufficient images correctly classified as moderate-DR or severe-DR, a clear example is our study where the presence of moderate-DR affects only 875 patients (2.28%) and the severe-DR to 1,153 (3.00%), of a total of 38,339 retinographies used in the validation of the device, this is the real incidence of DR in a screening program and it is the type of retinographies that the DLA system will have to read and not, for example, the retinographies of the Messidor-2 that have been chosen for their image quality and with a quantity of images of moderate or severe DR greater than the percentage expected in a real population.
We therefore believe that a better classification of DR centered on the ways of reading the images that artificial reading systems have would be very useful. In addition, its construction should not be an insurmountable problem, since, for example, the 20 cases misclassified as severe-DR by the DLA and that are moderate forms of DR but with the presence of occlusions of the venous branch of the central vein of the retina can be used to retrain the system based on the distribution of bleeding along the affected vessels. It is therefore important to achieve a new classification of DR that allows us to ensure its correct reading by automatic systems and thus reduce the number of FPs and especially FNs.
Another important point for the future of DLA development is that the DLA can be helpful to family doctors or to ophthalmologists in identifying lesions that are sometimes difficult to see in a retinography. Thus, Sayres et al. 34 demonstrated that a DLA increases the accuracy for retina specialists when diagnosing DR. The strengths of the present study are that it has used a real population to build a DLA system that takes into account the fact that the data have been collected in a local population with no prior selection of patients or their retinographies. We believe that our system can be applied to our DR screening program for identifying patients with DR and, in the case of patients with referable-DR, we believe that it will be useful.
One limitation of our study is that we built our DLA from retinographies taken by only one type of nonmydriatic fundus camera, so there needs further study into whether other models might change the results. Another is that the clarity of retinographies is crucial. The DLA eliminated 268 retinographies (0.69% of total) because of its poor image. Furthermore, the possibility of grading as moderate or severe DR is difficult, so our DLA was adjusted to classify retinopathy at a higher level.
Conclusion
Our DLA can be used as a reliable diagnostic tool that can help in DR screening, especially when it might be difficult for ophthalmologists, endocrinologists, or family doctors to identify it. It can better identify patients with any-DR and those that should be referred. Reducing the time taken to read images and at the same time the cost of screening will increase the number of patients who can be screened annually for DR.
Footnotes
Acknowledgments
The authors thank all general practitioners and endocrinologists in our area who have helped us to implement the new screening system using the nonmydriatic fundus camera and our camera technicians for their work and interest in the diabetes screening. The authors thank Kaggle and EyePACS for providing the data used in this article. The results were partially presented at the meeting of Euretina 2019, Paris 5–8 September 2019 in an oral communication as free paper session 22 Sunday, September 8 at 13.12. Title: N. Relano Barambio, P. Romero Aroca, J. de la Torre, A. Valls, D. Puig. Spain validation of a deep learning algorithm for diabetic retinopathy lecture in a population of diabetes mellitus patients.
Disclaimer
The authors alone are responsible for the content and writing of the article.
Authors' Contributions
P.R.-A. contributed to study conception and design, made the validation of deep learning algorithm (DLA) as masked ophthalmologist, reviewed the statistical analysis, wrote the discussion, and edited the article, contributing to the final approval of the version sent for publication. J.d.l.T. built deep learning algorithm (DLA), contributed to study conception and design, wrote the discussion, and made a critical review, contributing to the final approval of the version sent for publication. R.V.-P. contributed to study conception and design, made the validation of DLA as masked ophthalmologist, reviewed the statistical analysis, wrote the discussion, and edited the article, contributing to the final approval of the version sent for publication. A.V. contributed to study design and the statistical analysis, interpreted the research data, made a critical review, and reviewed the translation, contributing to the final approval of the version sent for publication. N.R.-B. contributed to study conception and design, made the validation of DLA as masked ophthalmologist, and made a critical review, contributing to the final approval of the version sent for publication. D.P. contributed to study design and the statistical analysis, interpreted research data, and contributed to the interpretation of the study findings, contributing to the final approval of the version sent for publication. M.B.-B. contributed to ophthalmological data collection and made the validation of DLA as masked ophthalmologist, contributing to the final approval of the version sent for publication.
Disclosure Statement
No competing financial interests exist.
Funding Information
The study was approved and supported by grant research projects: 2017 PFR-URV-B2–60 (University Rovira and Virgili grant), PI12/01535 June 2013, PI15/01150 July 2015, PI18/00169 July 2018 (Instituto de Salud Carlos III of Spain), and European Regional Development funds.