
Abstract
Background:
Atrial fibrillation (AF), the most common cardiac arrhythmia, can be detected by smartphones and smartwatches.
Introduction:
Single-lead ECGs (iECGs) and photoplethysmography (PPG) sensors provide the opportunity for a broad, simple, and easily repeatable cardiac rhythm analysis. To reduce unnecessary medical follow-up testing due to false positive results, our aim was to find a screening approach applicable on smart devices with a focus on high specificity.
Methods:
We used PPG measurements from smartphones and smartwatches and iECG data from two previous validation trials. Two AF detection algorithms (A and B) were applied on the iECG dataset and compared directly. Further, we used 1-min PPG measurements as a first-pass filter for arrhythmia detection and simulated a sequential testing: Once an arrhythmia was detected in the PPG, the iECG counterpart of the patient was analyzed by algorithm A, B, or A + B combined although algorithm B was primarily designed for PPG analysis.
Results:
The iECGs from 1,288 participants were analyzed. Algorithm A did not show a diagnosis in 16.1%. In the remaining, sensitivity and specificity were 99.6%, and 97.4% respectively. Accuracy was 98.5%, and correct classification rate (CCR) was 82.7%. Algorithm B always differentiated between normal and arrhythmic and reached an overall sensitivity of 95.4%, a specificity of 91.6%, and an accuracy and CCR of 93.3%. Sequential testing by combining both algorithms into a three-phase test (Test positive PPG, then iECG analysis by A and B combined) resulted in a 100% specificity.
Conclusion:
Algorithm B performed strongly in PPG analysis as well as iECG analysis. PPG signals and consecutive iECG combined when an arrhythmia was detected by PPG resulted in a specificity that was higher than 99%.
Discussion:
The analysis allows a direct comparison of iECG algorithms without possible dilution by different measurement procedures or recording-devices. We improved specificity in AF-screening approaches with wearables by simulating a novel approach. Results rely on signal quality.
Introduction
Atrial fibrillation (AF) is the most frequent human arrhythmia showing an increasing prevalence with age. 1 With an expected 120,000–215,000 patients being diagnosed with AF every year and an overall anticipated 14–17 million patients in the European Union by 2030, it will remain a medical condition of importance. 2 –4 There is an increased risk of heart failure and stroke 5 –7 associated with AF, which leads to a 2-fold increased risk of mortality in women and a 1.5-fold increased risk in men. 6,8,9 Diagnosis of AF is frequently missed due to its paroxysmal nature in partly asymptomatic patients (silent AF) as well as its weak temporal correlation with stroke occurrence. 10 –12
Since 2012, the number of people using smartwatches and fitness trackers has been rapidly increasing. By the year 2022, unit sales could increase to 219.4 million devices. 13 Most smartwatches and other wearables are suitable for heart rate analysis by using their built-in photoplethysmography (PPG) sensor for automated pulse-wave recordings. Automated smart algorithms allow distinguishing between absolute arrhythmia and a normal heartbeat based on the PPG data. If an absolute arrhythmia is detected, then AF is highly likely. 14 It has to be pointed out though that the diagnosis of AF depends on a regular ECG with at least two leads.
Along with the rise of PPG devices, mobile fingertip single-lead ECGs (iECGs) entered the health care and consumer market. The iECGs record a single-lead (Einthoven I) electrocardiogram using two fingertips from each hand. Recent approaches extend the use to additional leads by placing the device on one's leg (Einthoven II and III). 15 Fingertip iECGs have the advantage that an ECG-based AF detection algorithm can use (1) irregular R-R intervals, (2) absence of P-waves, and (3) irregular atrial activity as criteria for the analysis. 16 The disadvantage, though, is that it needs active intervention of the individual and an additional device next to a smartphone. An increasing number of smartwatches with PPG sensors also features an iECG component. These new devices are promising with regard to a cost-effective, convenient, and easy applicable AF-screening device. 17 Trials using automated iECGs or PPG-signal analysis in smartphones or smartwatches showed high detection rates with a sensitivity and specificity higher than 90%. 14,18 –21 The FDA-approved iECGs for screening of AF and the European Heart Rhythm association added PPG applications (apps) to their screening recommendations. 22
Particularly because measurements can be carried out easily and are highly repeatable, tests should not only be designed with a high sensitivity but should also focus on a very high specificity to prevent a drain of healthcare resources due to unnecessary follow-up tests caused by false-positive test results. Trials proving cost efficiency of these screening tools are still ongoing. 23
Our study compared two AF detection algorithms on the same iECG signal and further combined them as a sequential test.
For testing, we used an algorithm that was designed for PPG signals on iECG-signals. This study investigated how the two dominant sensor technologies, iECG and PPG, could be linked into a new, practical, and highly specific sequential test, which could then be implemented in modern wearables.
Materials and Methods
Data Origin
This prospective, blinded analysis used data from the previously published WATCH AF and DETECT AF pro trials. 21,22 Both trials were conducted in Switzerland and Germany at two University Hospitals along subjects with a high prevalence of AF. The PPG files were recorded with either a smartphone camera (iPhone 4S; Apple®, Cupertino, CA) or a smartwatch (Gear Fit 2; Samsung®, Seoul, South Korea). The iECG files were recorded with Kardia mobile iECG devices (AliveCor®, Mountain View, CA). The iECG signal and the diagnosis produced by the Kardia algorithm was stored in PDF format. Two board-certified cardiologists analyzed all iECG files in a blinded fashion. In case of uncertainties a third cardiologist was consulted. All cardiologists were blinded for the diagnosis of the other cardiologists.
To achieve optimal signal quality, all measurements were performed in a quiet surrounding in a hospital setting and patients were instructed to remain in a comfortable sitting position during measurements to reduce artefacts caused by movements.
Procedures
Comparison of iECG detection algorithms
Two automated AF detection algorithms were tested along the iECG recordings and compared with the cardiologist-based analysis.
Algorithm A is the Kardia mobile electrocardiogram (ECG) algorithm from the AliveCor app (version 4.2.0.1487). Algorithm A performs an automated signal quality check. Afterward, it displays the classification results “possible atrial fibrillation,” “normal,” “unclassified,” or none of them. Algorithm A works by detecting the presence of p-waves and the regularity of beats.
Algorithm B is the Heartbeats algorithm (Preventicus®, Jena, Germany). It has been developed for PPG analysis and detects beat-to-beat variations via a nonlinear rhythm analysis. It does not perform an automated signal quality check for ECGs. Therefore, Algorithm B has to classify every given iECG.
Since the Kardia mobile ECG is a closed platform, a third-party algorithm-like Algorithm B could not access the original digital iECG signal. To enable a comparison of both algorithms, Algorithm B had to process a re-digitalized version of the PDF-File containing the iECG-trace. Digitalization took place with the help of a software tool (ECG-trace Extractor, V.4/5; Preventicus).
Simulation of sequential screening with PPG and iECG
A sequential test based on a combination of PPG and iECG technology was simulated with all classifiable 1-min-PPG measurements. The Heartbeat algorithm (Preventicus) performed PPG analysis and the result was compared with the cardiologist-based diagnosis of the iECGs. If an arrhythmia was detected based on the initial PPG data analysis, the matching iECG counterpart of the same patient either overruled or confirmed the decision of the PPG. The iECG counterpart analysis was performed by (1) the Heartbeats algorithm (Preventicus), (2) the Kardia mobile ECG algorithm from the AliveCor app (version 4.2.0.1487), and (3) both algorithms combined (conformation of AF by both algorithms required). This approach simulated a wearable user who records an iECG once the PPG signal detected an arrhythmia and recommended the individual to record an iECG (Fig. 1).
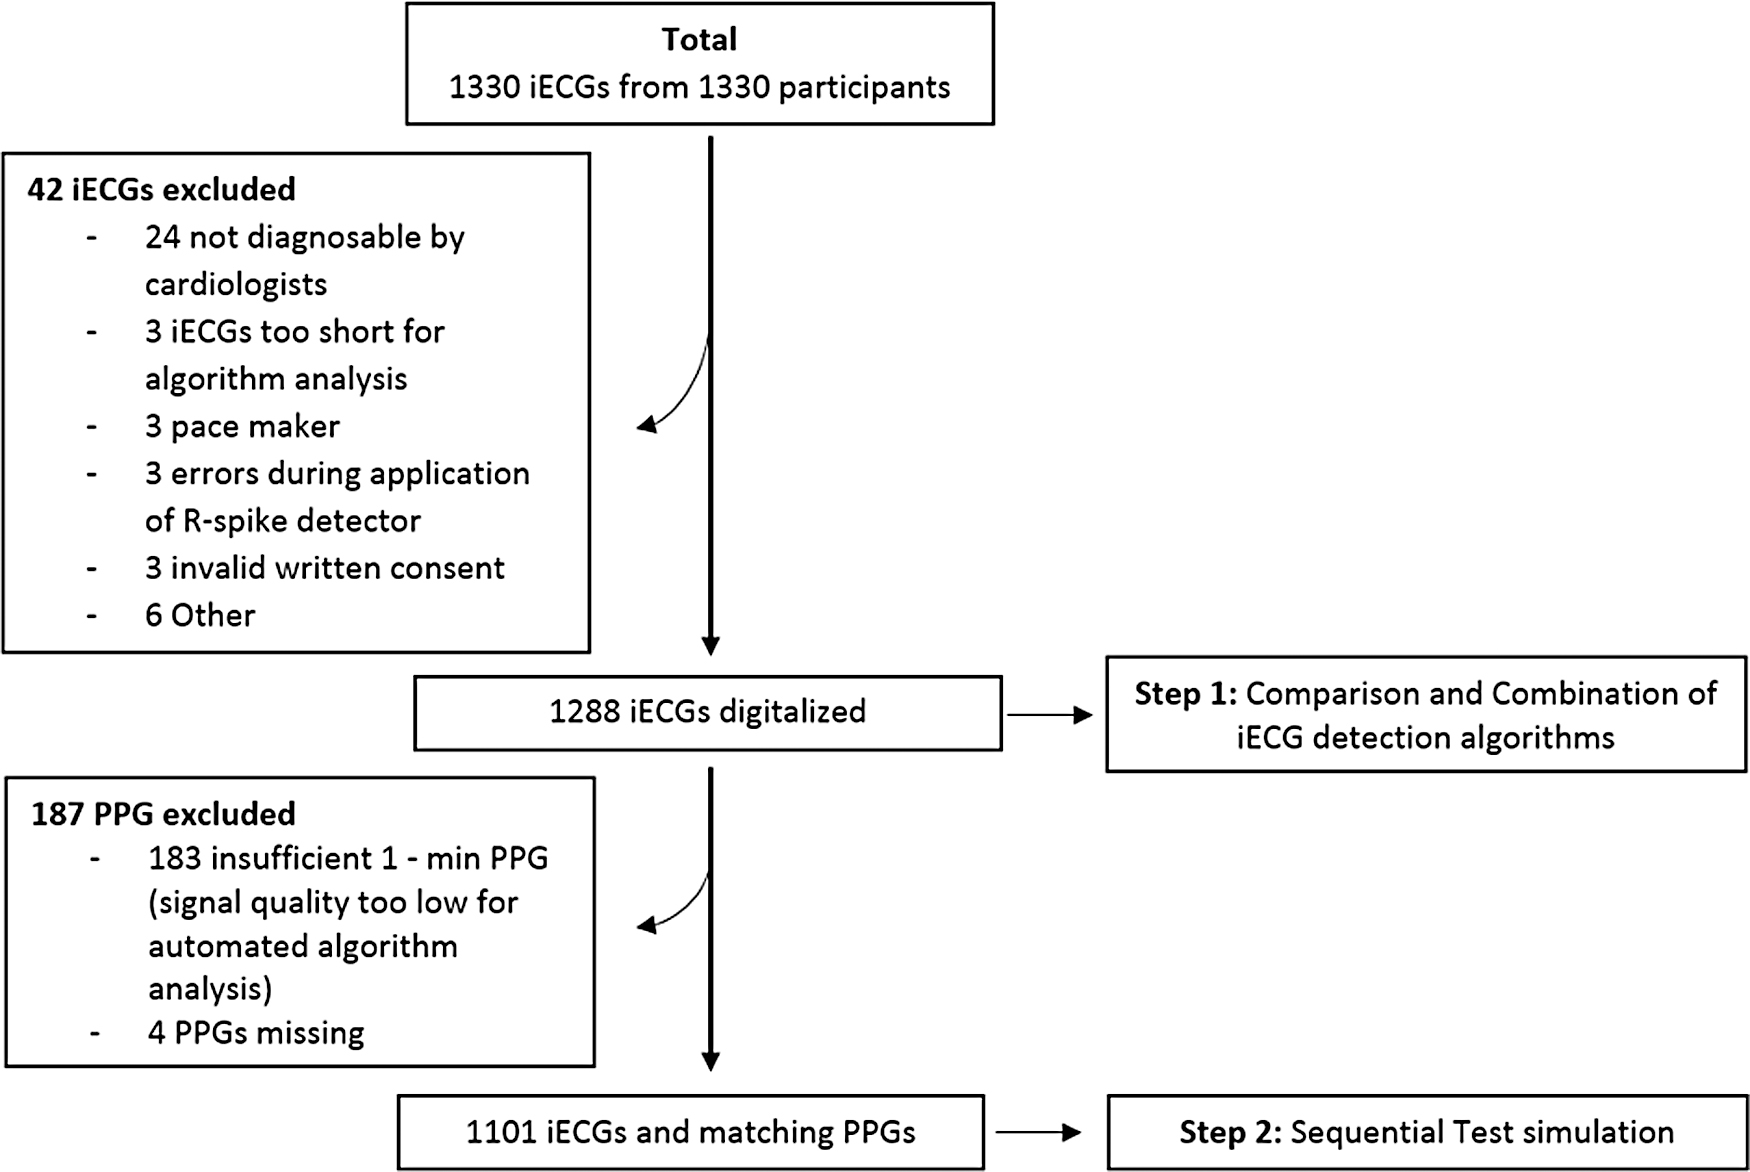
Screening for eligibility.
Digitalization Process
To make the iECG recordings accessible for third-party algorithms, they had to be re-digitized from the initial PDF format in which they were stored by the AliveCor smartphone app (AliveCor app, version 4.2.0.1487). This process took place by a customized automated program via reassembly of the iECG trace into digital coordinates. The extracted coordinates were plotted back into the original image. Visual inspection showed no deviances between original and reprocessed iECG trace (Fig. 2). A tachograph was applied on the iECGs for r-spike detection. Detected r-spikes are marked with a circle. Algorithm B analyzed beat-to-beat variability of detected r-spikes (Fig. 3).

Digitalization process. Above: iECG-trace from the PDF-File. Below: Extracted coordinates display as red dots when replotted into the original iECG trace. Color images are available online.
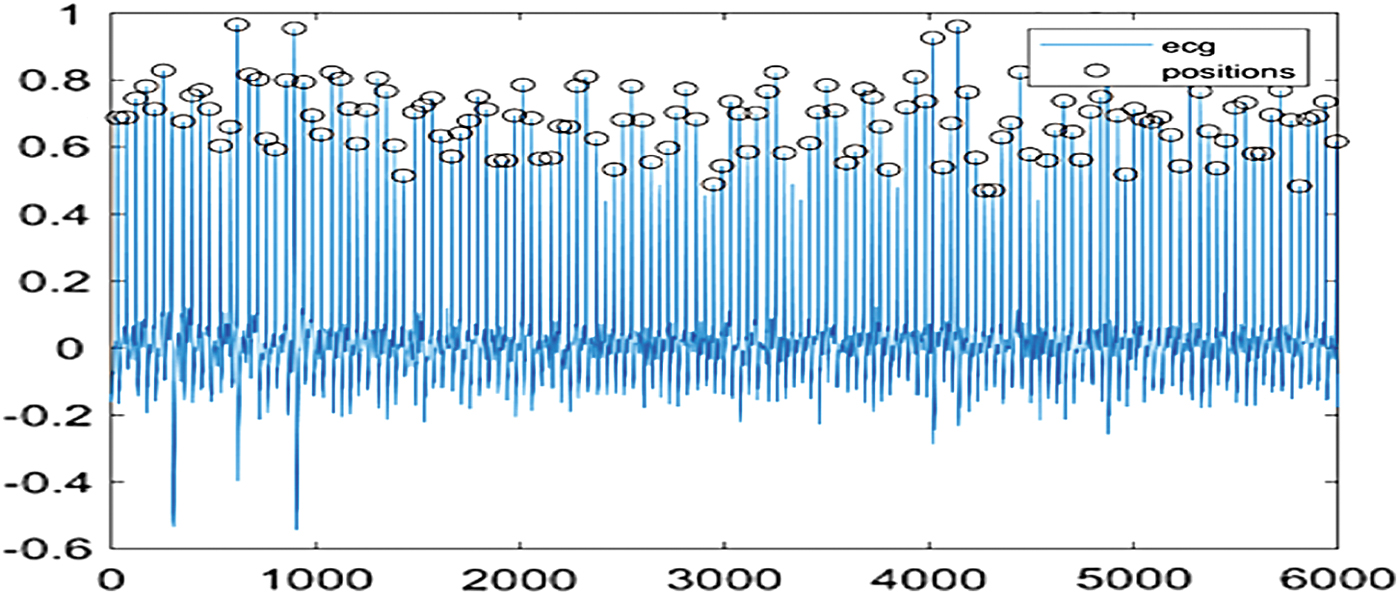
Applied tachograph on iECGs for r-spike detection. Color images are available online.
Results
Analysis 1: Comparison and Combination of iECG Detection Algorithms
The iECGs from 1,288 patients were transformed and used to validate Algorithm A and B versus the diagnosis of cardiologists. The overall prevalence of AF was 46.74%.
Algorithm A did not show a diagnosis in 204 iECGs (16.1%). In the remaining, the sensitivity and specificity of Algorithm A were 99.6% (95% confidence interval [CI]: 98.7–100%) and 97.4% (95% CI: 95.7–98.6%), respectively. Accuracy was 98.5%, and correct classification rate (CCR) was 82.7%.
Algorithm B applied on all 1,288 iECGs reached a sensitivity of 95.4% (95% CI: 93.4–96.9%), a specificity of 91.6% (95% CI: 89.2–93.5%), and an accuracy and CCR of 93.3%.
By excluding the 207 iECGs that were not classifiable by algorithm A from this analysis, Algorithm B reached a sensitivity of 97.2% (95% CI: 95.5–98.4%), a specificity of 96.5% (95% CI: 94.6–97.9%), and a CCR and accuracy of 96.9%. When applied on the 207 iECGs that could not be classified by Algorithm A, Algorithm B reached a sensitivity of 82.3% (95% CI: 70.5–90.8%), a specificity of 73.3% (95% CI: 65.9–80.7%), and an accuracy and CCR of 76.3% (Table 1).
Results of Analysis 1: Comparison and Combination of Two Single-Lead ECG Atrial Fibrillation Detection Algorithms
CCR, correct classification rate; CI, confidence interval; iECG, single-lead ECG.
Analysis 2: Simulation of a Sequential Screening Test with PPG and iECG
For the simulation of the sequential test, 1-min PPG recordings and iECG recordings from 1,101 participants were included. The overall prevalence of AF by cardiologist diagnosis was 44.19%. The PPG analysis with Algorithm B alone reached a sensitivity of 91.6% (95% CI: 88.8–93.9%), a specificity of 98.2% (95% CI: 96.8–99.1%), and a CCR of 95.4%. In case an arrhythmia was detected by PPG analysis of Algorithm B, the corresponding iECG of the same patient was used to verify or reject the result.
Using Algorithm A for the iECG analysis, the overall sensitivity decreased to 90.7% (95% CI: 87.7–93.2%), specificity increased to 99.8% (95% CI: 99.1–100%), accuracy was 96%, and CCR was 93%.
Using Algorithm B for the PPG analysis as well as for the iECG analysis, the overall sensitivity decreased to 89.9% (95% CI: 86.9–92.5%), specificity increased to 99.7% (95% CI: 98.83–99.96%), and CCR was 95.4%.
By combining both algorithms into a triple check (PPG analysis by Algorithm B and iECG analysis by Algorithms A and B sequentially), the overall sensitivity decreased to 90.8% (95% CI: 87.7–93.3%), specificity increased to 100% (95% CI: 99.4–100), CCR was 92.3%, and accuracy was 96.1% (Table 2).
Results of Analysis 2: Single-Lead ECG Confirmation Triggered by Arrhythmic Pulse Waves from Photoplethysmography Signals
The result of the tested algorithm A, B or B and A combined was able to overrule the arrhythmia warning of the PPG algorithm.
PPG, photoplethysmography.
Discussion
Guideline recommendations for AF screening have changed dramatically in the past years. At present, mobile devices such as smartphones and smartwatches, as well as dedicated iECG devices are recommended for screening purposes. Next to iECG signals, PPG signals derived from pulse waves have been successfully validated and approved for screening purposes. Although the difference in technology is evident and determines different use cases based on the availability of devices, a potential difference between algorithms designed for PPG analysis versus iECG analysis has been unclear so far.
We, therefore, decided to challenge an algorithm designed for PPG signals with iECG signals and combined the two algorithms in a second step. The results suggest that the performance of these novel tools for AF detection depends less on the source of the signals but more on the quality of the underlying algorithms. Further, we were able to provide an example where the combination of two different algorithms improved the overall performance, demonstrating that even though performance is already very high, it still can be improved.
To the best of our knowledge, this analysis is the first that compares two algorithms with different functionality on the same signal track of iECGs in a large population. This allows a direct comparison of sensitivity and specificity without interference between different measurement procedures and devices.
Algorithm B can be used for the analysis of PPG data as well as for the analysis of iECG data, with very good performance. To the best of our knowledge, this is the first algorithm applied to iECGs that is solely working by analyzing nonlinear beat variations from detected r-spikes. It does not need to detect other ECG-specific characteristics such as p-waves. If combined with another algorithm that includes p-wave detection, automated signal quality check, and beat-to-beat analysis, a synergic effect in terms of sensitivity and specificity was shown.
In terms of software, the use of a single algorithm such as Algorithm B for both signal entities (PPG and iECG) in wearables can be easier to install. A financial benefit seems likely but was not investigated.
Further, we applied Algorithm B for PPG and consecutive iECG analysis with 99.7% specificity and CCR as well as an accuracy of 95.4%. When both Algorithms were applied on the consecutive iECG, a specificity of 100% was reached. This novel approach provides a highly promising pathway for the detection of AF. High specificity will enable to prevent unnecessary costs and overtreatment due to false positive results. Nevertheless, it has to be considered that the performance of the described tests depends on good signal quality. This can be shown by the high exclusion rate due to low signal quality by Algorithm A's signal analysis and the weak performance of Algorithm B in those ECGs. These findings underline the importance of a good signal quality and the advantage of well-designed automated signal quality checks. As PPG and iECG signal analysis is highly dependent on an optimal signal-to-noise ratio, interconnecting accelerometer data by detecting device movements from implemented accelerometer sensors might enable to give feedback on the appearance of noise during data recordings.
The simulation pictured a user with a wearable, which performs an automated PPG screening for AF. Once AF has been detected by PPG without active intervention of the user, the user will be notified to record an iECG by using the same wearable. This would allow to subsequently record an iECG and provide an instant result. An instant notification of a potentially irregular heartbeat is of outmost importance due to AF's paroxysmal nature. By further implementing accelerometer sensors, an automatically induced AF screening using PPG sensors is possible if the device is at rest. This could allow saving power and optimizing the signal-to-noise ratio and, therefore, is a promising novel approach to optimize screening for AF.
Limitations
Algorithm B could not be tested with the original iECG signal, but with a re-digitized version of the original iECG trace. However, the automatized process minimized possible interferences in the digitalization process. Visual inspection of all files (Fig. 2) showed no differences between original and processed iECG trace. Considering the 184 insufficient 1-min PPG measurements (Fig. 1), signal quality, in general, remains the decisive factor for a high detection rate in screening with wearables. For this analysis, it must also be considered that the PPG signals were recorded by using different devices (Apple iPhone4s and Samsung Gear Fit 2). Since Algorithm B can be installed on any PPG-enabled device, this circumstance was neglected in the analysis.
The simulation gives a promising outlook, but the real implementation in a suitable device remains a challenge. A suitable device must not only be able to continuously monitor the PPG signal but also analysis has to take place in real time. This requires access to the raw signal data of the device on the one hand and a strong battery life on the other. In addition, the algorithm provider must install its core technology on the device as real-time evaluation through permanent data traffic via the internet is currently not practical. The PPG signal analysis with a smartwatch or smartphone allows extended continuous AF screening without intervention of the individual, but AF diagnosis remains ECG dependent. The consecutive testing of PPG and iECG during AF screening is a promising approach to optimize AF screening. Once the technical issues have been overcome, this consecutive testing has the potential to impact AF screening and detection to a great extent.
Ethics Statement
This analysis has been conducted with anonymous data from two registered and approved previous validation trials (Detect AF pro/Watch AF), according to good clinical practice standards and under consideration of the ethical framework for responsible data processing in personalized health research of the Swiss Personal Health Network.
Footnotes
Acknowledgments
The authors would like to thank A. Winterhalder and U. Schmitt for their support. Preventicus provided the programs for the digitalization of the iECGs, performed a blinded analysis of the PPG data based on the Heartbeats algorithm, and conducted a blinded analysis of the iECG data based on the Heartbeats algorithm.
Disclosure Statement
J.E. and M.D. hold 0.5% virtual shares of Preventicus. J.E. received a travel grant from Preventicus. None of the remaining authors has a conflict of interest to disclose regarding this work.
Funding Information
This work was funded by a research grant from the University Hospital Basel.