
Abstract
Background:
We investigated the ability of a novel stand-alone, smartphone-based system, the cvrPhone, in estimating the minute ventilation (MV) from body surface electrocardiographic (ECG) signals.
Methods:
Twelve lead ECG signals were collected from anesthetized and mechanically ventilated swine (n = 9) using standard surface electrodes and the cvrPhone. The tidal volume delivered to the animals was varied between 0, 250, 500, and 750 mL at respiration rates of 6 and 14 breaths/min. MV estimates were determined by the cvrPhone and were compared with the delivered ones.
Results:
The median relative estimation errors were 17%, −4%, 35%, −3%, −9%, and 1%, for true MVs of 1,500, 3,000, 3,500, 4,500, 7,000, and 10,500 breaths*mL/min, respectively. The MV estimates at each of the settings were significantly different from each other (p < 0.05).
Conclusions:
We have demonstrated that accurate MV estimations can be derived from standard body surface ECG signals, using a smartphone.
Introduction
Minute ventilation (MV) plays an important role in the assessment of a patient's ventilatory status and activity. For patients receiving mechanical ventilation, this ventilatory function is usually assessed by spirometric measurement of MV while the patient is temporarily receiving solely pressure support or physically disconnected from the ventilator and breathing into the measurement device. 1 A decrease in respiration rate (RR) can diminish MV and thereby lead to hypercapnia. In turn, this CO2 retention in the bloodstream can activate the central chemoreceptors located in the brain stem, causing an increase in the respiratory drive. 2,3 To maintain the decreased RR without disturbing the respiratory homeostasis, the tidal volume (TV) is increased. It has been previously shown that a drop in RR to 6 breaths/min in humans reduces the chemoreflex response to hypercapnia and hypoxia compared with the spontaneous RR or controlled RR of 15 breaths/min. 4,5 Hence, monitoring and maintaining a balanced MV, by matching a decrease in RR by a proportional increase in the TV is an important clinical challenge.
While the RR is more easily measured, the TV cannot be measured by simple physical examination, 6 making the assessment of MV quite challenging. Advances in mobile technology and signal processing algorithms have led to the proliferation of wearable devices for respiratory monitoring. 7 –12 Multiple accelerometer-based devices aim to measure ventilatory activity based on chest wall motion or incorporate miniaturized gyroscopes to track physical activity, 11,13,14 yet continuous noninvasive measurement of clinical-grade MV remains elusive. In addition, assessment of the TV requires a spirometer or pneumotachometer connected to the mouthpiece and nose clip of the patient. These equipment are not comfortable and can produce a sensation of smothering in patients. 15 In a clinical setting, TV is measured using different techniques such as a pitot tube, 7 a spirometer, 16 or an ultrasonic airflow meter, 17 which directly measure the airflow into and out of the lungs, while computed tomography, 18 respiratory inductance plethysmography, 19 electrical impedance tomography, 20,21 and differential pressure pneumatachograph 22 are indirect methods of measuring TV. These techniques require the use of specialized hardware for monitoring the TV. The hardware dependency is often not practical and inconvenient for ambulatory patient monitoring. Furthermore, the techniques using face mask and pneumotachograph, induce error because of increased dead space and resistive loading. 23,24 Thus, these are not well suited for nonsedated patients as they induce arousal especially for light sleepers and is also impractical for awake infants. These techniques also have limited ability to acquire data dynamically during respiratory events such as apneas, hypopneas, and sighs. 25
Since MV is a dependent variable, studies have used the heart rate (HR) or other physiological parameters as the independent variable to indirectly estimate the MV. Even in a clinical setting, MV is estimated by first measuring the HR (influenced by oxygen consumption) and then correlating the oxygen consumption with MV. 26,27 While many of these approaches have been field tested, most are cumbersome and have limited clinical utility. 28,29 In addition, these models suffer from poor generalizability and a wide range of error since the quantitative relationship between the HR and MV is highly subject to interpatient variability. 30
Recently, we have demonstrated the use of a novel smartphone-based system, cvrPhone, for the real-time estimation of RR and TV using body surface electrocardiographic (ECG) signals, 12 and of continuous oxygen saturation. 31 Here, we aim to extend our findings to the estimation of MV, an important stepping stone for the development of telemetric instrumentation for noninvasive monitoring of respiratory function in an ambulatory setting. We tested the hypothesis that MV can be reliably estimated using medical-grade, 12-lead, body surface ECG signals and the computing power of a smartphone using a mechanically ventilated animal model.
Methods
The raw data that support the findings of this study are available from the corresponding author upon request.
Animal Experiments and Data Collection
All animal studies were performed in accordance with the guidelines set by the Subcommittee on Research Animal Care at the Massachusetts General Hospital. Studies were performed similar to our previously established protocol for in vivo swine experimentation. 6,32
Briefly, male Yorkshire swine (n = 9) were instrumented and anesthetized in the Animal Electrophysiology Laboratory at Massachusetts General Hospital, 6,32 and anesthesia was induced with Telazol (4.4 mg/kg) intra-muscularly. Each animal was intubated and placed on a volume-controlled, time-cycled, mechanical ventilator (Ohmeda 7800; GE, Madison, WI). A capnograph (SurgiVet V9004; Smiths Medical, Dublin, OH) with 1 breath/min resolution accuracy was used to confirm the RR and TV delivered by the ventilator throughout the respiratory interventions. Body surface ECG signals were acquired using electrodes placed at the standard 12-lead ECG placement locations.
Studies were performed with the animal in the supine position. RR was set at 6 or 14 breaths/min during two sets of experiments: while the TV was changed every 2 min from 250 to 0, then to 750 to 0 to 500 to 0 to 750 mL, at each RR level. During the apnea period, the ventilator was suspended for 30 s; this period of time was chosen to replicate the duration of a typical apneic event. MV estimates were calculated for six true settings using combinations of the abovementioned RR and TV settings: 1,500, 3,000, 3,500, 4,500, 7,000, and 10,500 breaths*mL/min. ECG signals were recorded using the cvrPhone and digitized at 500 Hz and 16-bit resolution (∼0.38 μV). 12,33,34
Estimation of RR
Our ECG processing algorithm has been previously described extensively. 6,12,32 –34 Briefly, we first used a QRS detection algorithm to identify R-wave annotations (R-peaks) based on a lead predetermined by the user. These preliminary R-peaks were then further refined using a template matching QRS alignment algorithm 35 –37 (for more details, please see the Supplementary Data).
RR and TV were estimated from the ECG signals similar to our previously reported algorithm. 6,32 Briefly, respiration-induced periodic modulation of the ECG signals was estimated on a beat-by-beat basis from the root mean square (RMS) value of the ECG signal in a 100 ms window centered at the peak of the QRS complex. 6,12,32 The respirophasic signal for different lead pairs was calculated on a beat-by-beat basis for a moving window of 32 beats using the ratio of the RMS signals for each lead. Each lead pair used to generate the RMS signal ratios consisted of a reference lead (denominator) and a test lead (numerator). 32 Next, the power spectrum of the RMS signal ratio was generated using the Fourier transform (n = 512), and the dominant power spectral peak between 0.03 and 0.3 cycles/beat was identified. The signal-to-noise ratio (SNR) was then calculated as the spectral peak power divided by the mean of the power spectrum from 0 to 0.5 cycles/beat, expressed in decibels and given as:

The pair of leads with the highest SNR was selected for RR estimation. To calculate the RR, the selected peak frequency in cycles/beat was converted to breaths per minute by scaling the frequency by the average HR across the 32-beat window. If the abnormal beats in the 32-beat window were more than 10%, the corresponding RR was linearly interpolated. 32
Estimation of Minute TV and MV
The TV was estimated using the peak-to-peak amplitude of the respiratory RMS signal, as detailed previously. 6 The peak-to-peak amplitude was normalized by the mean value to obtain the percent modulation (PM) given as follows:
PM: 100 × (max envelope − min envelope)/(max envelope + min envelope)/2
The median PM across all leads in a running 10-s window was calculated and a regression equation (TV = 45.65 × PM −51.15) was applied on the median PM to estimate the corresponding TV. If the estimated TV was negative, the TV was set to zero. Then, the TV was estimated for intervals of 60 s (1 min) to generate the minute TV, which was then used to estimate the MV. MV was defined as the product of the minute TV and the RR, as follows:
Minute Ventilation (MV) = Minute Tidal Volume * RR
Statistical Analysis
Data are presented as median (horizontal solid line), 75–25% percentiles (box), and 90–10% percentiles (error bars). Statistical comparisons between different MV settings were performed using the Wilcoxon signed-rank test. Values of p < 0.05 were considered statistically significant, and statistical analysis was performed using MATLAB (MathWorks Inc., Natick, MA).
Results
We sought to estimate the RR and TV and derive MV by the analysis of the respiratory modulation of body surface ECG signals. Estimates calculated using our novel smartphone-based system were compared with the capnograph readings accepted as the gold standard, and error in estimation at different MV rates was evaluated to gauge the efficacy of the system.
Estimation of RR and TV Using Body Surface ECG
Figure 1A depicts a representative plot of RR estimation, while the true RR was alternated between 6 and 0 breaths/min. Red bars indicate the true RR setting, while the circles denote the estimated RR. As has been previously demonstrated, 6,32 we observe a close correlation between true and estimated RR.
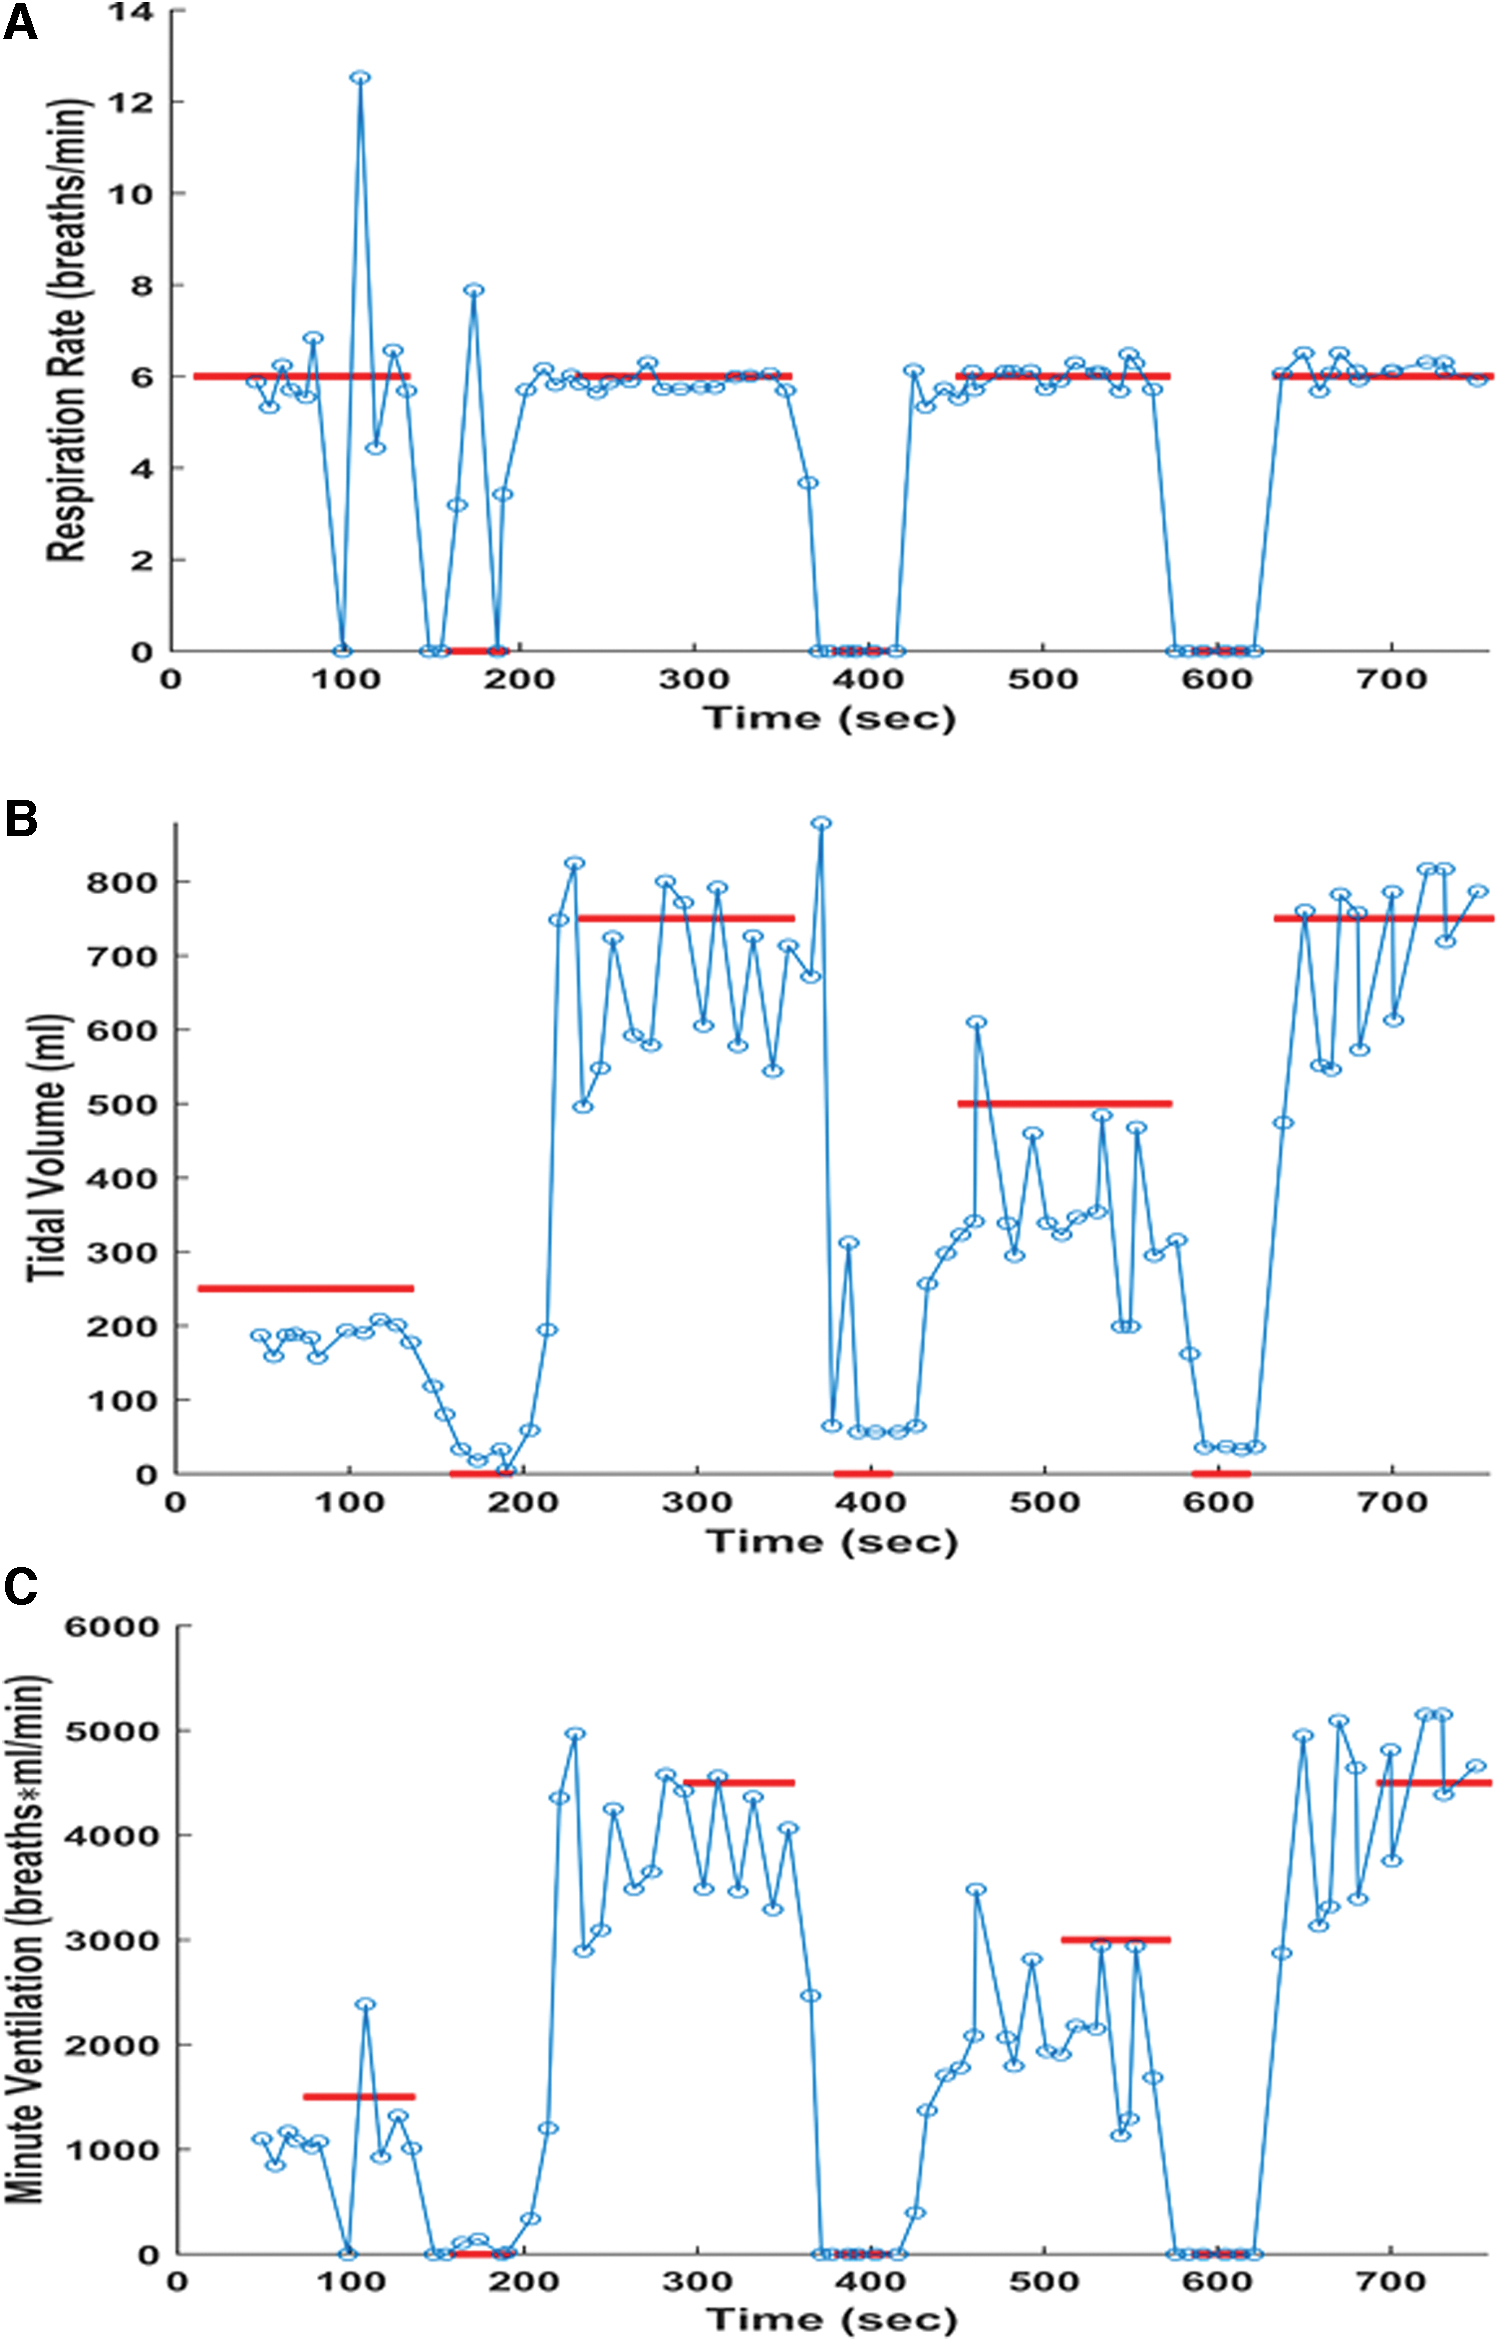
Figure 1B depicts a representative plot of TV estimation, while the swine was ventilated at a rate of 6 breaths/min and the true TV was varied from 250 to 0 to 750 to 0 to 500 to 0 to 750 mL, as indicated. Red bars indicate the true TV setting, while the circles denote the estimated TV. Similar to our previous study, 6,32 we observed a close correlation between true and estimated TV.
Estimation of MV Using Body Surface ECG Signals
Figure 1C depicts a representative plot of MV estimation, while the true MV values are varied from 1,500 to 0 to 4,500 to 0 to 3,000 to 0 to 4,500 breaths*mL/min. Red bars indicate the true MV setting, while the circles denote the estimated MV. The RR is alternated between 6 and 0 breaths/min throughout the experiment as demonstrated in Figure 1A, while the TV is varied from 250 to 0 to 750 to 0 to 500 to 0 to 750 mL. We observed a close correlation between true and estimated MV.
Figure 2 shows summary results for estimation of MV across all swine experiments (n = 9). True MV values were varied from 1,500 to 3,000 to 3,500 to 4,500 to 7,000 to 10,500 breaths*mL/min. The RR was set at 6 breaths/min and 14 breaths/min, while the TV was varied among 250, 750, 500, and 750 mL. The median values for the 6 MV settings were 1,752, 2,893, 4,712, 4,359, 6,384, and 10,592 breaths*mL/min, respectively. All pairs of MV estimates except 3,500 and 4,500 breaths*mL/min were statistically different with 1,500 versus 3,000 breaths*mL/min (p < 0.001), 3,000 versus 3,500 breaths*mL/min (p < 0.001), 4,500 versus 7,000 breaths*mL/min (p < 0.001), and 7,000 versus 10,500 breaths*mL/min (p < 0.001), demonstrating the ability of the system to accurately measure and distinguish between different MV settings.
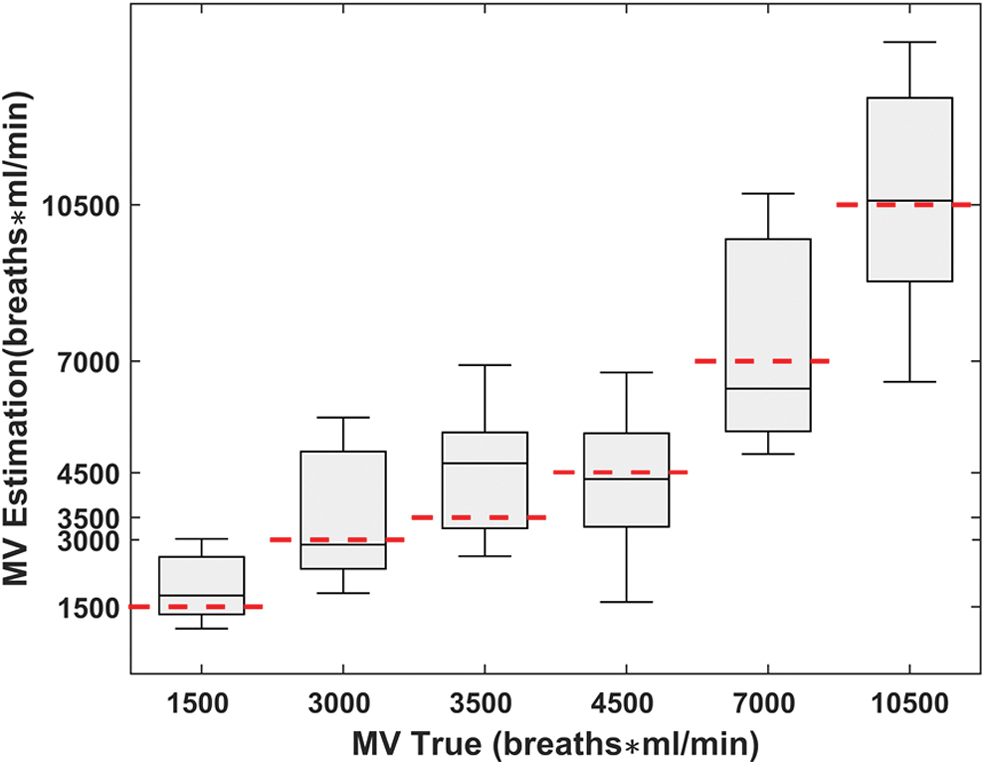
Summary results for estimation of MV presented in increasing order of TV settings. True TV was varied from 250 to 0 to 750 to 0 to 500 to 0 to 750 mL, while the RR was held constant at either 6 breaths/min (n = 9) or 14 breaths/min (n = 8) for the entire duration of the recording. Expected true MV values (denoted by red dashed lines) were 1,500, 3,000, 3,500, 4,500, 7,000, and 10,500 breath*mL/min. MV estimates are presented as median (horizontal solid line), 75–25% percentiles (box), and 90–10% percentiles (error bars). MV, minute ventilation; TV, tidal volume. Color images are available online.
Figure 3 demonstrates the MV estimation error for each true MV setting (1,500, 3,000, 3,500, 4,500, 7,000, and 10,500 breaths*mL/min.). The median values of the MV errors were 252, −107, 1,212, −141, −616, and 92. We observe a wider distribution of estimation error for larger MV values.

Summary results for MV estimation errors presented in increasing order of MV setting. True TV was varied from 250 to 0 to 750 to 0 to 500 to 0 to 750 mL, while the RR was held constant at either 6 breaths/min (n = 9) or 14 breaths/min (n = 8) for the entire duration of the recording. Expected true MV values were 1,500, 3,000, 3,500, 4,500, 7,000, and 10,500 breath*mL/min. MV estimate errors are presented as median (horizontal solid line), 75–25% percentiles (box), and 90–10% percentiles (error bars). Red dashed line represents 0 MV estimation error. MV, minute ventilation; RR, respiration rate; TV, tidal volume. Color images are available online.
Figure 4 demonstrates the normalized MV estimation error calculated as (relative estimation error)% = (MV Estimation Error)/(True MV), for each true MV setting (1,500, 3,000, 3,500, 4,500, 7,000, and 10,500 breaths*mL/min.). The median values of the relative estimation errors were 17%, −4%, 35%, −3%, −9%, and 1%.
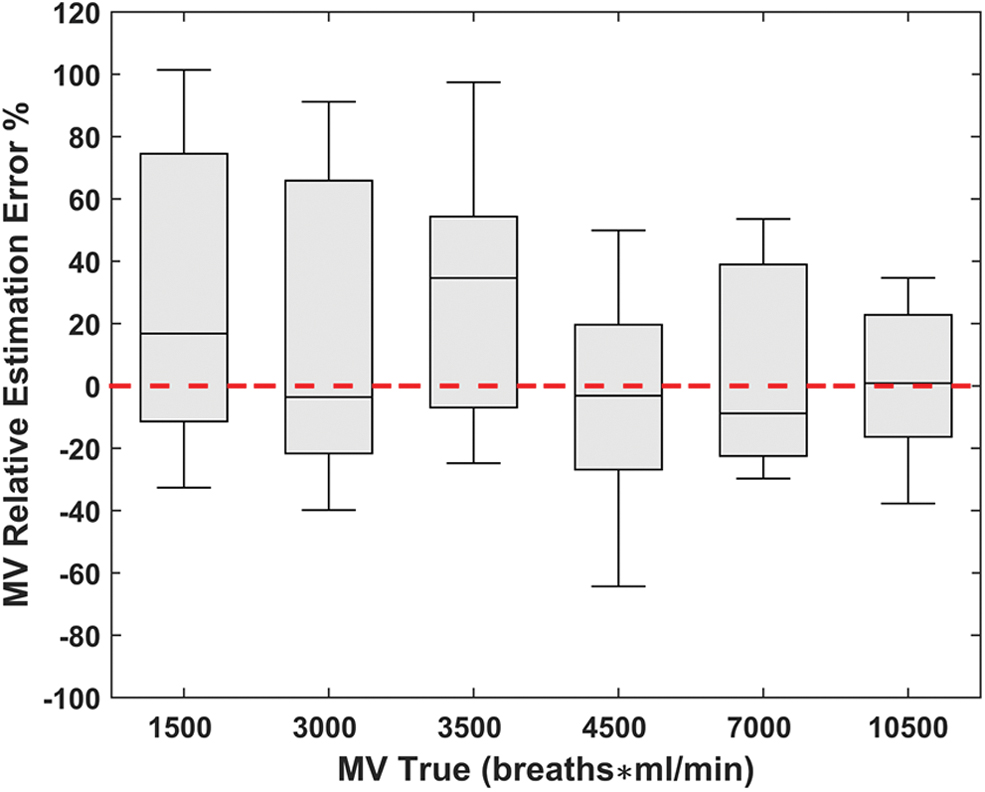
Summary results for MV relative estimation errors (%) presented in increasing order of (MV) values. True TV was varied from 250 to 0 to 750 to 0 to 500 to 0 to 750 mL, while the RR was held constant at either 6 breaths/min (n = 9) or 14 breaths/min (n = 8) for the entire duration of the recording. Expected true MV values were 1,500, 3,000, 3,500, 4,500, 7,000, and 10,500 breath*mL/min. MV relative estimation error % is presented as median (horizontal solid line), 75–25% percentiles (box), and 90–10% percentiles (error bars). Red dashed line represents 0 MV relative estimation error %. MV, minute ventilation; RR, respiration rate; TV, tidal volume. Color images are available online.
Discussion
Advances in technology and medical device innovation have led to smarter noninvasive methods of patient monitoring and disease diagnosis. 11 Here, we aimed to extend our prior work on the development of a smartphone-based monitoring system for measurement of physiological parameters from body surface ECG signals, by investigating the utility of our novel smartphone-based system (cvrPhone) in estimating MV from ECG signals. The major findings of our study are as follows: first, we can reliably estimate the MV from RR and minute TV measurements, derived from body surface ECG; second, MV estimation can be performed using a smartphone-based ambulatory monitoring system, without the need of specialized hardware.
The choice of the Android for cvrPhone 12,34 was made to reduce fees and costs. However, the proposed real-time algorithm can be easily transferred across platforms (i.e., a tablet), therefore reaching an increasingly larger fraction of the population.
Previously, MV has been directly estimated from the HR utilizing regression equations established under diverse exercise conditions. 30,38 However, the relationship between HR and MV has been established to be curvilinear, 28 while interindividual variability has been observed in slopes and intercepts for all types of exercises. We have implemented a novel noninvasive method for estimating MV from RR and TV measurements extracted directly from the 12-lead body surface ECG. The median MV estimated error across a wide range of MV values was found to be just −1%. This demonstrated the ability of the system to provide an accurate MV measure across a wide range of MV settings. While we did not see any correlation between MV setting and estimation error, the accuracy of MV estimation was dependent on acquisition of clean ECG signals and minimizing the error in the estimation of the RR and TV. Further testing under ambulatory settings would be required to assess the accuracy and efficacy of the respiratory monitoring system.
In conclusion, we successfully tested a novel smartphone-based method that estimates the RR and TV values in real time, from ECG signals and estimates MV noninvasively, in swine. Our method has the potential to be implemented as an ambulatory cardiac and respiratory monitoring system, which could greatly aid patient health monitoring not only in intensive care units but also in ambulatory setting.
Footnotes
Authors' Contributions
K.K. and N.A. participated in data analysis and writing of the article. J.D.R. participated in article writing. A.A.A. was responsible for the conception and funding of the study, and participated in the experiments, data analysis, and writing of the article.
Disclosure Statement
No competing financial interests exist.
Funding Information
The work was supported by a Grand-in-Aid (#15GRNT23070001) from the American Heart Association (AHA), the Institute of Precision Medicine (17UNPG33840017) from the AHA, the RICBAC Foundation, NIH grants 1 R01 HL135335-01, 1 R21 HL137870-01, 1 R21EB026164-01, and 3R21EB026164-02S1 to A.A. Armoundas, and grants HL-125715 and HL-147863 to J.D. Roberts, Jr.
Supplementary Material
Supplementary Data
References
Supplementary Material
Please find the following supplemental material available below.
For Open Access articles published under a Creative Commons License, all supplemental material carries the same license as the article it is associated with.
For non-Open Access articles published, all supplemental material carries a non-exclusive license, and permission requests for re-use of supplemental material or any part of supplemental material shall be sent directly to the copyright owner as specified in the copyright notice associated with the article.