




Abstract
Digital trails, data collections of individuals' traceable digital activities online or on digital devices, have been utilized by many industries to provide valuable insights to enhance customer experience, improve operation efficiency, and increase revenues. Despite the abundance of digital trails among health care data, health care has lagged behind other industries in extracting their values. Recently, telehealth's accelerated adoption due to the COVID-19 pandemic provides an unprecedented opportunity for health care providers to take advantage of digital trails. In this study, we describe digital trails generated from the telehealth workflow and discuss a few use cases to demonstrate how telehealth digital trails can be used to improve clinical service quality, streamline patient care workflow, and enhance the patient experience.
Background
Digital trail, sometimes referred as digital footprint, is user-generated data when they interact with digital tools or services such as mobile phones, web searches, and videoconferences. 1 –4 Digital trails are often left by users unintentionally and collected with or without the users' awareness, such as internet protocol (IP) addresses, timestamps, and browsing history. 5 Although some passively generated digital trails might be valueless and hence deserve a short life cycle, others may provide valuable insights to businesses or lead to revenue-generating opportunities. For instance, technology giants such as Google, Facebook, and Amazon have built successful business models around tracking and using user's digital trails for targeted advertising. Digital marketers also heavily leverage the value of digital trails. According to a digital exhaust report, 67% of digital marketers utilize digital trails (IP data) to derive actionable insights and increase customer revenue. 6
Health care has become a data-rich industry since the nationwide adoption of the electronic health record (EHR) systems. As of 2012, the health care industry accounted for 30% of all the world's electronic data storage. 7 The recent surge in telehealth due to the COVID-19 pandemic has further hastened the data boom in health care. Unlike regular face-to-face visits, telehealth visits (aka. televisits) rely on digitization and transfer of voice, video, images, text, and reports between patients and providers through the internet. This digital communication manner unavoidably generates a myriad of digital trails, such as time logs, IP addresses, and connection quality indicators, which have also increased health care data volume.
Despite the unprecedented data abundance, health care has lagged behind other industries in tapping into the digital trail value. Particularly, the use of digital trails in the telehealth context has rarely been discussed. To address this shortage, this perspective article will demonstrate how digital trails can be used in telehealth to improve clinical service quality, streamline patient care workflow, and enhance the patient experience.
Digital Trail in Telehealth Workflow
Telehealth workflow varies from organization to organization. At Nationwide Children's Hospital (NCH), a typical telehealth process consists of four steps using a Health Insurance Portability and Accountability Act (HIPAA)-compliant system: scheduling, E-check in, the televisit session, and an optional patient satisfaction survey (Fig. 1). The patient may schedule a televisit by calling the service provider or through the patient's MyChart (Epic™, Madison, WI) portal. Before the appointment, typically on the day of consultation, the patient logs into their MyChart portal to complete E-check in, during which the system prompts them to sign consent forms (if applicable) and answer a questionnaire. Up to 15 min before their appointment, the patient can click on the join link through MyChart to enter the televisit virtual waiting room through Zoom (San Jose, CA) platform.
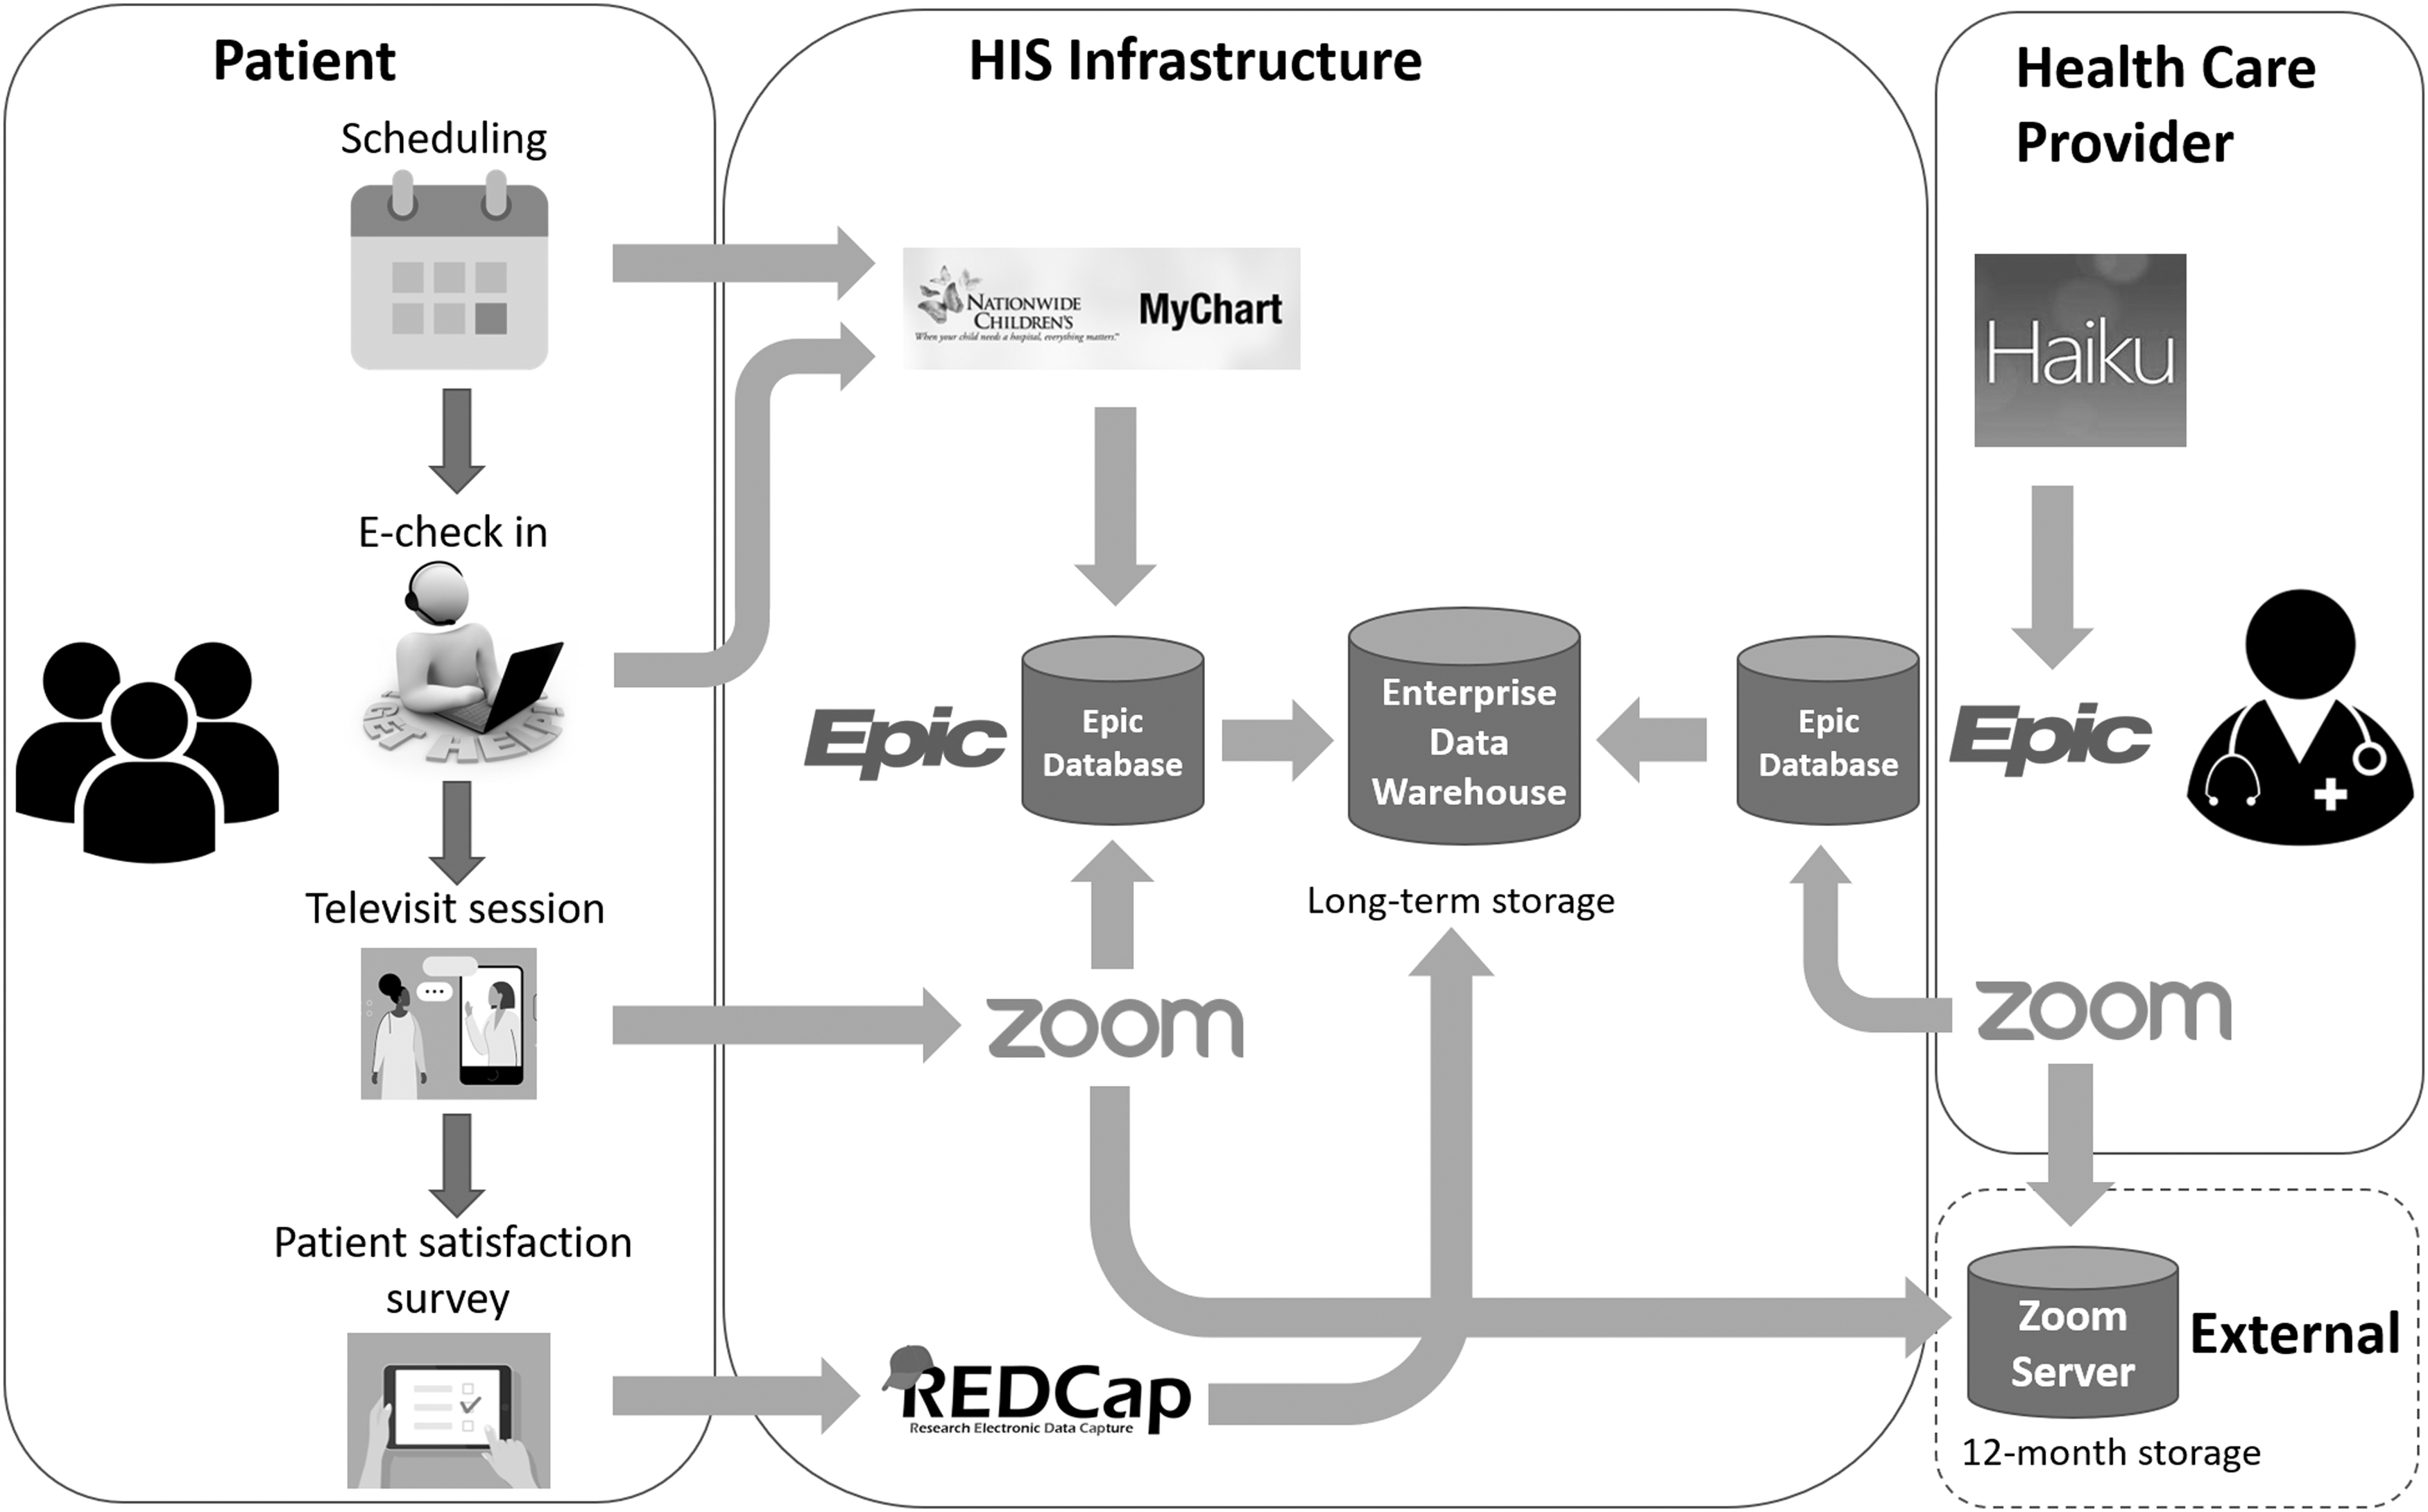
Telehealth workflow diagram. The diagram highlights key areas of NCH's telehealth workflow and data management. HIS, hospital information system; NCH, Nationwide Children's Hospital; REDCap, research electronic data capture.
Meanwhile, the provider can pull up the patient's account and launch a video visit through the Epic desktop or mobile (Haiku) application. When both the patient and the provider are in the virtual room, a two party or multiparty televisit session starts. The Zoom session runs in a secure external cloud. After the visit and when the encounter is officially closed by provider, the patient might receive a MyChart message to finish a satisfaction survey to evaluate their televisit experience. Along this workflow, the Epic EHR system and associated databases capture, integrate, and ultimately store most of the telehealth-related data in NCH's enterprise data warehouse. An exception is the patient survey data, which are captured by the research electronic data capture (REDCap) system.
PRIMARY DIGITAL TRAIL
Examining NCH's telehealth workflow and associated databases enabled us to identify 23 data entries that may fall into the primary digital trail category (Table 1), defined as directly collected data. By retrieval source, the data can be classified into EHR data (from Epic), patient survey data (from REDCap), and videoconferencing data (from Zoom). EHR data include login info, MyChart time-use and activity, patient's technology use (device info, IP address, camera device info, web browser info, and operating system info), and visit data (visit type [new or follow-up], E-check in time, video visit start and end time, and timestamps each participant joined the video visit). REDCap patient survey data include survey delivery time and survey start and submission times. Zoom videoconference data include meeting start and end time, the number of participants, network connection type, and network connection quality indicators. Note that the aforementioned list is not meant to be exhaustive, but to introduce the concept of telehealth digital trails.
Exemplary Digital Trails in Nationwide Children's Hospital's Telehealth Workflow
Time between survey delivery and survey submission.
Time needed to complete the survey once started.
Survey started but not completed.
EHR, electronic health record; IP, internet protocol; REDCap, research electronic data capture.
SECONDARY DIGITAL TRAIL
Analysis of the primary digital trail data derived an additional 15 data entries, namely secondary digital trail data. For instance, utilization data such as the number of MyChart logins within a given timeframe can be derived by aggregating the MyChart account access data. Patient location can be estimated by decoding the IP address of the patient's device. Patient wait time can be calculated using patient and provider join time. Similarly, survey response time can be determined using survey delivery time and survey submission time.
Digital Trail Use Cases in Telehealth
There are many potential use cases of these digital trail data to improve telehealth services. We illustrate the promise with three examples. These use cases cover different quality improvement opportunities in patient experience, satisfaction, and education.
PATIENT EXPERIENCE—NETWORK CONNECTION QUALITY
Patients must have access to sufficient internet bandwidth to participate in televisits. 8 Disruptions of communication due to limit bandwidth and/or network instability will negatively impact the clinical experience of a televisit. The digital trail of videoconference data can reveal real-time audio/video performance, such as latency, jitter, bitrate, as well as video resolution and framerate during a televisit session, which enables both in-process and postprocess quality evaluation. Reviewing connection quality data will also help providers identify patients to follow up with and recognize their needs for technology and/or financial assistance for a better telehealth encounter experience.
PATIENT SATISFACTION—PATIENT WAIT TIME
According to a 2018 Vitals study, a patient's wait time and their health care provider's average rating are strongly correlated. 9 Unsurprisingly, long patient wait times could adversely affect overall patient satisfaction. 10 The ability to track patient wait time is, therefore, a critical step toward quality improvement. In an in-person visit, the patient wait time can only be tracked by personal observation and manual recording, which are expensive and hard to scale. For instance, Naaz and Mohammed conducted a time motion study to evaluate the patient wait time in the outpatient department of an Indian hospital. The hospital cares for >100,000 outpatients in a year; however, the study was only able to track 100 patients within 2 months timeframe. 11 Others estimate patient wait time based on patient self-reported information, which usually lacks accuracy and reliability. 12 However, in a televisit, tracking patient wait time becomes straightforward thanks to digital trails—it only involves a simple calculation using EHR and videoconferencing timestamp data, such as check-in time, patient join time, and provider join time. To demonstrate the scalability, we analyzed the patient wait time for 40,421 patients who have completed a total of 195,458 televisits with NCH providers between June 1 and December 31, 2020. The mean patient wait time was 22.2 ± 19.8 min, and the median was 16 min.
PATIENT EDUCATION—EDUCATION MATERIAL ACCESS
Patient education is an important strategy to enhance patient adherence. 13 However, providers are challenged to know how often patients refer to the printed education materials provided at in-person visits. Although patient portal access to patient data including laboratory results and after visit summary (AVS) do not change with telehealth, all education materials would be distributed in a digital format as opposed to offering printed copies. Using digital trails from the patient portal (e.g., MyChart activity), a better understanding of patient postvisit behavior related to education material access can be obtained. As a proof of concept, we used MyChart activity data (i.e., AVS action audit) to track patients' postvisit access to their AVS reports, which often include patient education materials. The result showed that out of the 40,421 aforementioned telehealth patients, 16,658 (41.2%) visited their AVS reports, and 5,495 (13.6%) downloaded or printed the reports. The average number of AVS actions per televisit was 1.25. These preliminary results demonstrated the utility of digital trail data in providing postvisit insights. More research can be done to study the association of clinical outcomes and education material access.
Privacy and Consent in Using Digital Trail
Although tremendously useful, digital trails must be balanced with privacy requirements. In the United States, the federal HIPAA law and some state laws protect patient health information. Under the HIPAA (Part 164, Subpart E), a hospital (covered entity) is free to use patient health data for quality improvement purposes without a patient's authorization. 14 However, in some states, more stringent laws may be applied to provide more robust privacy. In California, for instance, the Confidentiality of Medical Information Act stipulates that a provider may not disclose a patient's medical information without authorization except for under certain situations such as a medical emergency or a court order. 15 In Europe, the General Data Protection Regulation (GDPR) also prohibits the processing of personal health data without a patient's explicit consent. 16 In these cases, global consents may be needed to explain the use of data and obtain patient authorization.
Conclusions
A McKinsey Global Institute report (2011) predicted that the U.S. health care system could save $300 B a year by using data more creatively and effectively. 17 With telehealth's rapid adoption in 2020, digital trails can be fully leveraged to model human (patients and providers) interaction with digital systems. In this article, our only objective is to introduce the concept and demonstrate a few use cases. When coupled with proper analytics, digital trails can be utilized to improve clinical service quality, streamline patient care workflow, and increase patient satisfaction.
Footnotes
Authors' Contributions
S.L. conceptualized overall project idea. X.Z. and Y.H. developed the initial framework. X.Z. conducted literature review and data analysis. J.L. contributed to the clinical use cases. All authors contributed to the writing of the article and gave approval for the final article.
Acknowledgments
The authors acknowledge the contributions of Sirina Lu and Rajesh Ganta, who assisted in analyzing NCH's telehealth workflow and data management structure.
Disclosure Statement
No competing financial interests exist.
Funding Information
No funding was received for this article.