




Abstract
Objective:
Visual acuity (VA) testing is crucial for early intervention in cases of visual impairment, especially in rural health care. This study aimed to determine the potential of a web-based VA test (PocDoc) in addressing the unique health care needs of rural areas through the comparison in its effectiveness against the conventional VA test in identifying visual impairment among an Indian rural population.
Methods:
Prospective comparative study conducted in December 2022 at a tertiary referral eye care center in central India. We evaluated all patients with the PocDoc VA tests using three device types, and the conventional VA test. Bland–Altman plot (BAP) compared PocDoc and conventional VA tests. Fisher's exact tests evaluated associations between categorical parameters. Kruskal–Wallis tests followed by post hoc Dunn's tests identified association between categorical parameters and numerical parameters.
Results:
We evaluated 428 patients (792 measurements of VA) with mean age 36.7 (±23.3) years. PocDoc resulted in slightly worse VA scores (mean logMAR: 0.345) than conventional (mean logMAR: 0.315). Correlation coefficient between the conventional and PocDoc logMAR VA values was rho = 0.845 and rho2 = 0.7133 (p = 6.617 × 10–215; adjusted p = 2.205 × 10–214). Most data points fell within the interchangeable range of ±0.32 on BAP. Difference between the two methods increased with higher logMAR values, indicating poorer agreement for worse VA scores.
Conclusions:
Identifying and addressing the unique health care needs of rural populations is critical, including access to appropriate and effective VA testing methods. Validating and improving VA testing methods can ensure early intervention and improve the quality of life for individuals with visual impairment.
Introduction
Visual acuity (VA) is a crucial measure of visual function that can help prevent the progression of visual impairment, especially in cases of easily treatable conditions such as cataract and uncorrected refractive errors. 1,2 However, in many rural regions of India, where the uptake of eye care services is low, 3 –5 people often delay seeking treatment for noticeable vision loss, leading to compromised vision due to lack of access, awareness, and financial constraints. 6 –9 Therefore, routine VA testing is particularly important in the rural context to address avoidable visual impairment causes.
With the increasing integration of technology in health care, 10 –12 especially during the COVID-19 pandemic, and with 75% of the global population using smartphones in 2021, 13 mobile applications have become a convenient and affordable way to address the needs of patients and health care systems. 14,15 Recent studies have shown the effectiveness of mobile applications (apps) in VA testing. 16,17 However, many VA testing apps are not validated, and there is significant variation in accuracy because VA testing apps can be published without any verification of their validity, accuracy, and reliability. 18,19 Therefore, there is a need for novel validated apps for VA testing.
PocDoc is a newly developed app that assesses various aspects of visual function through VA, color vision, contrast sensitivity, visual field, and Amsler grid tests. PocDoc enables remote daily monitoring of visual function, ensuring continuity of care at home and timely intervention upon detection of visual abnormalities, reducing the strain on hospital resources by reducing the need/frequency for follow-up visits. The use of a mobile app like PocDoc can enable remote or at-home testing, or even setting up small stations for VA testing in rural areas, thereby improving accessibility and helping to prevent visual impairment and blindness in rural populations.
This study aims to assess the discrepancies between the PocDoc VA test and the conventional VA test in the measurement of VA and to determine the accuracy of PocDoc in identifying visual impairment among a rural population. The validation of the PocDoc app as a reliable and effective tool for VA testing in rural populations could significantly improve access to care and lead to better health care outcomes for millions of people worldwide.
Methods
STUDY DESIGN
After approval from the Institutional Review Board, we conducted a prospective comparative study in a rural population at a tertiary referral eye care center in central India. The study involved the recruitment of 428 patients from December 11 to December 15, 2022. As an exploratory study, we determined the sample size based on logistical and resource constraints. We recruited consecutive patients with no prespecified inclusion or exclusion criteria, aiming to ensure the generalizability of our findings.
Poc Doc APPLICATION PLATFORM
This app is an all-encompassing tool for conducting eye tests. It provides users with detailed instructions on how to execute the tests accurately and effectively, as depicted in Figure 1 and Supplementary File S1. Not only is the PocDoc VA test available on various devices such as laptops, PCs, Android, and iPhone mobiles, and iPads and Android tablets, but it also caters to the optimal testing conditions. The brightness level must be set to the maximum, and the patient must be positioned at 75 cm from the screen to ensure accurate results. The PocDoc VA test is calibrated using a credit card to adjust the size of the box displayed to the size of the card, as shown in Figure 1.
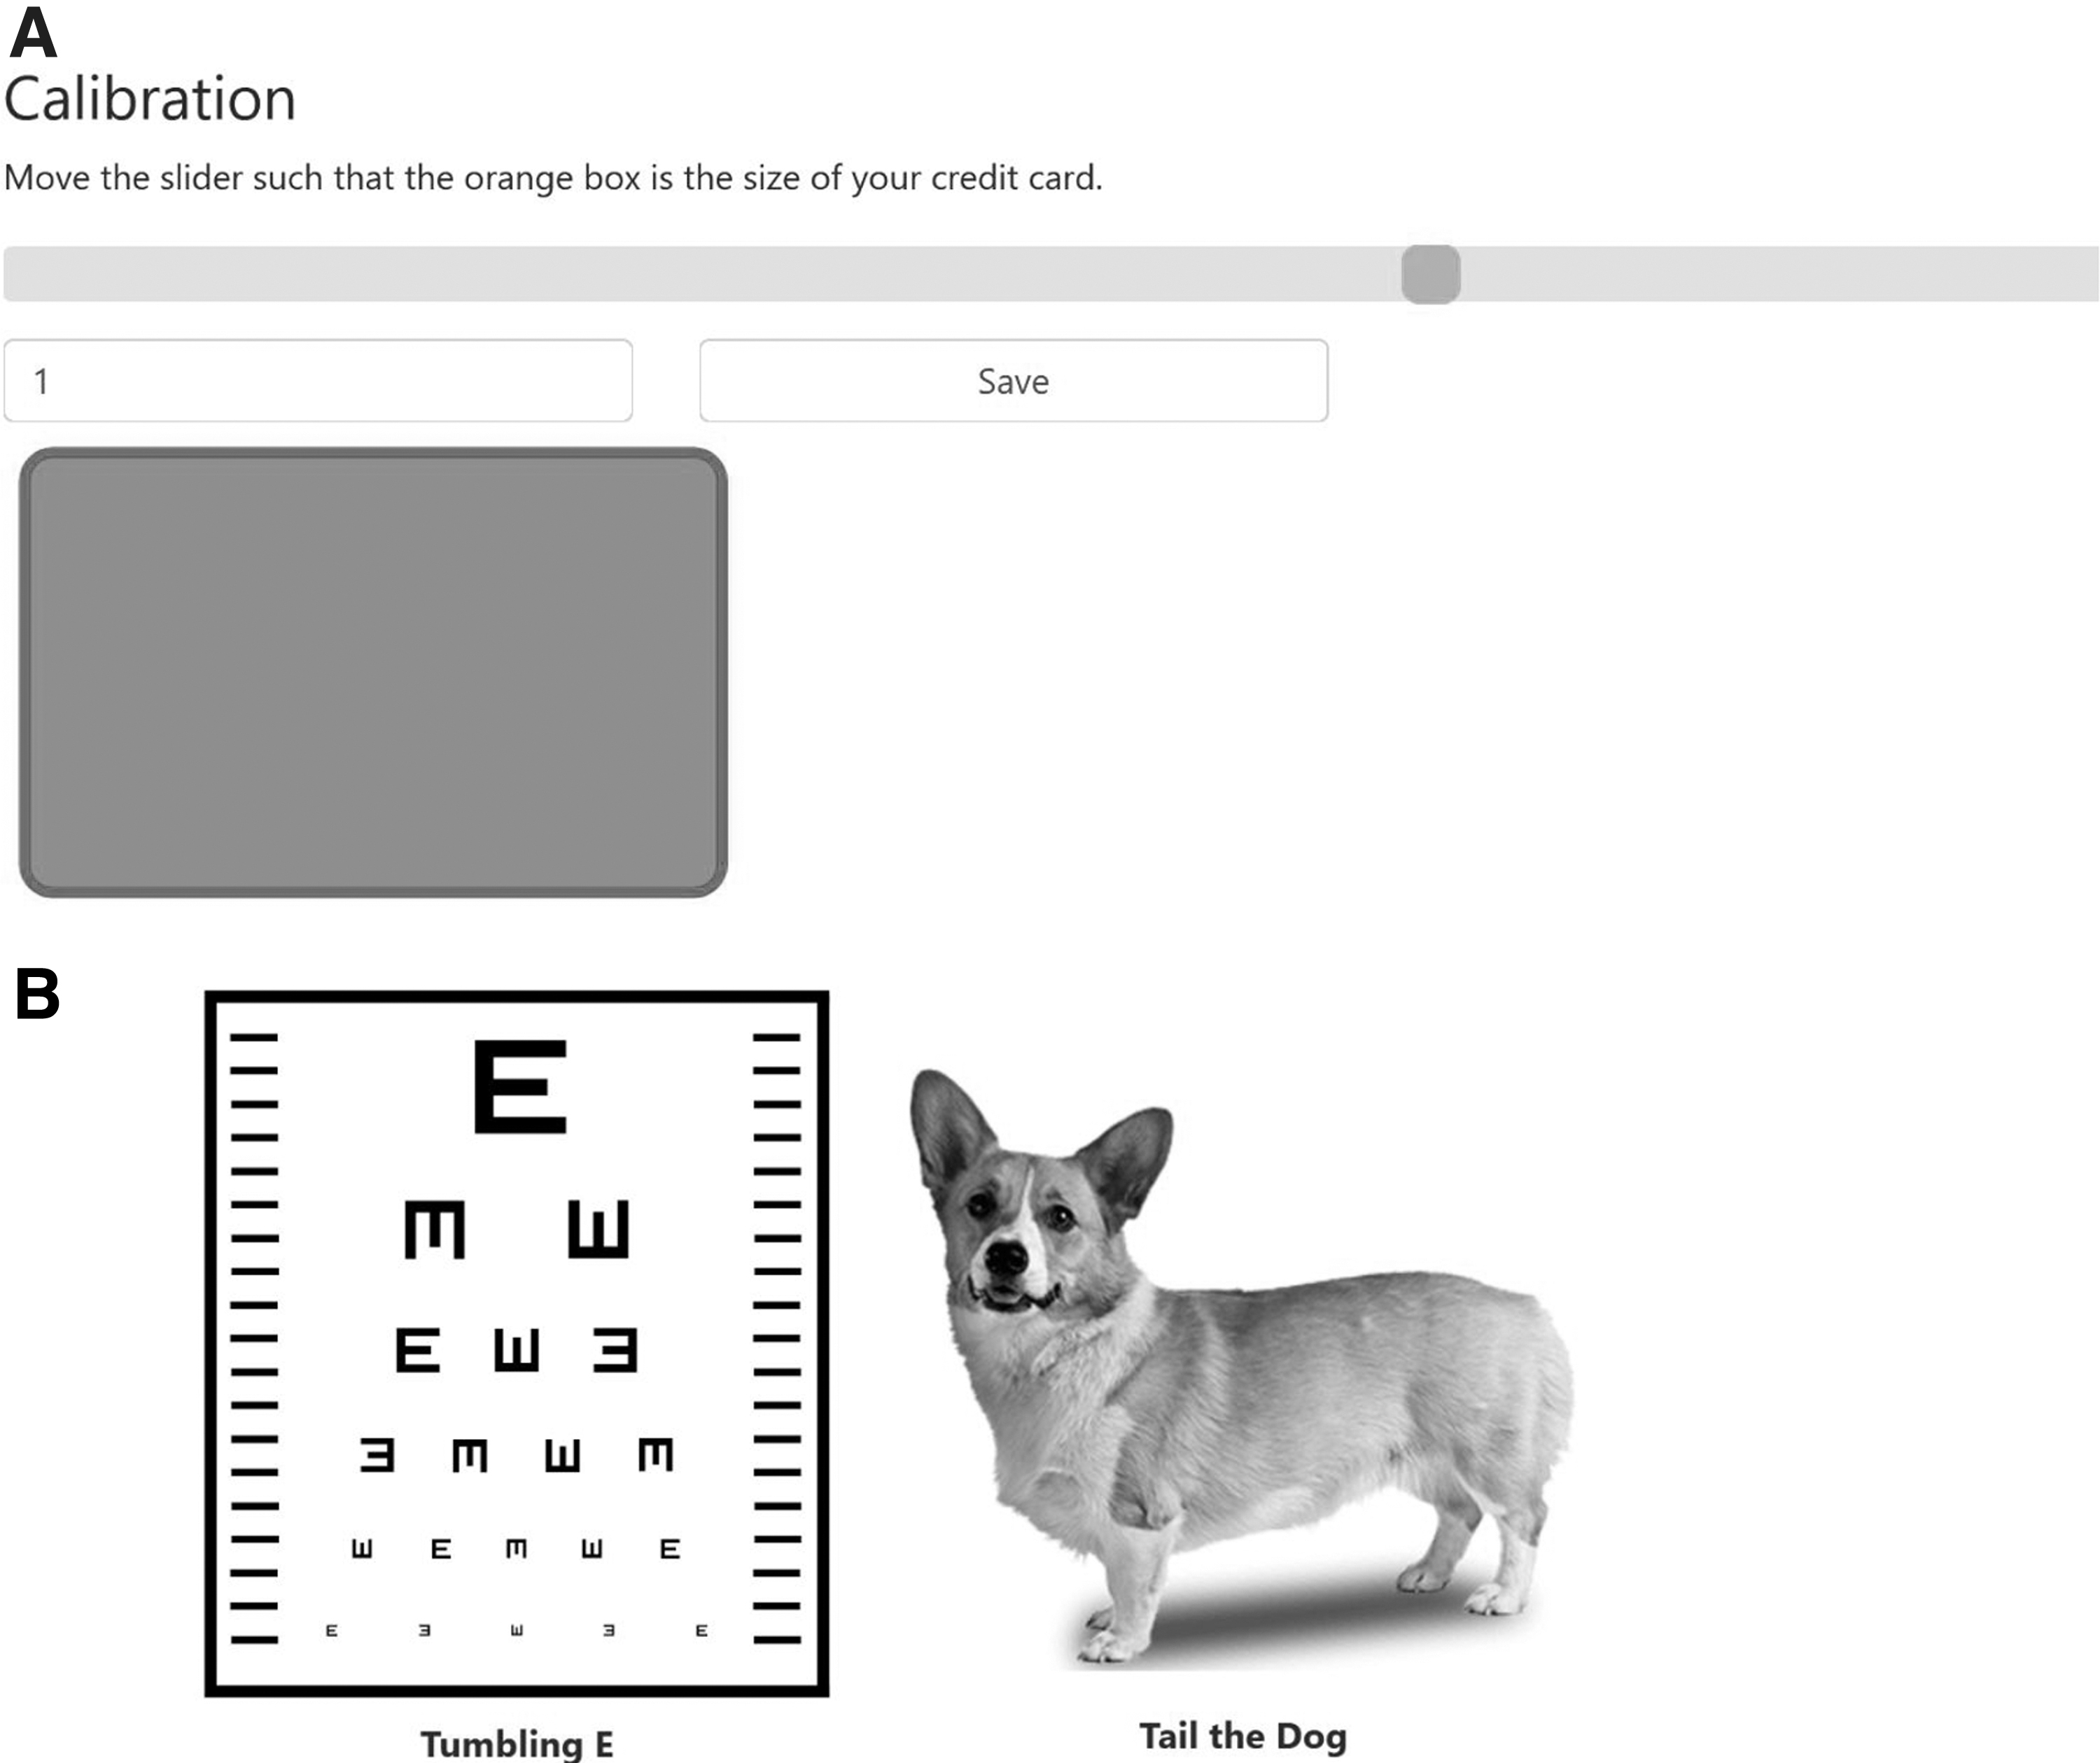
A set of letter(s) or symbol(s) is presented one at a time, with each set's size being proportional to the distance and corresponding to a row on the conventional VA chart. This calibration method ensures that the display is the correct size and proportional on each device. The Tail the Dog test, specifically designed for the pediatric population (Fig. 1), is incorporated in the PocDoc app, which also includes an interactive gaming aspect based on the Tumbling-E VA test platform. The objective of the test is for the individual being tested to identify the correct attachment location of the tail on the back of each dog, providing engaging yet accurate results that require the child to focus on the task at hand.
Poc Doc VA TESTING
PocDoc VA test was carried out by a team of nine examiners, including a high school student, several medical students, and residents, all of whom were supervised by a senior clinician (RA), based on the user manual (Supplementary File S1). We evaluated the best-corrected VA using both the PocDoc VA test and conventional VA tests (Snellen VA scores) on same day. For those patients who did not have their glasses, pinhole occluders were used. The distance between the patient and the device used for administering the PocDoc test (75 cm) and the conventional VA tests (6 m) was measured using a tape measure.
Participants were given an adaptation period of 60 s to adjust to the accommodative demand before the tests were conducted. This was done to minimize any distortions that could potentially arise from immediate exposure to different testing conditions. Data were recorded on the customized PocDoc platform along with other patient data, such as age, gender, presenting complaint, and medical history.
The final day of data collection was considered the postintervention day, with the intervention being the additional training provided to the examiners in the use of the PocDoc app, which took place during the first 4 days of data collection. Of the nine examiners involved, six used a laptop exclusively, one used an iPad exclusively, one used a mobile phone exclusively, and one used both a laptop and an iPad. The Tail the Dog test was only administered to the children at the pediatric clinic, while the Tumbling-E test was conducted primarily for older patients at the specialist outpatient clinics. The laptop or iPad was placed on a table, while the mobile phone was held by the examiner during the test administration.
STATISTICAL ANALYSIS
The data were obtained from PocDoc platform and saved as an Excel sheet. R statistical language version 4.2.1 was used to extract and analyze the data. First, we calculated the sensitivity, specificity, accuracy, positive predictive value (PPV), and negative predictive value (NPV). Then, Bland–Altman plots (BAPs) were done, and the Fisher's exact tests were used to identify associations between categorical parameters, while Kruskal–Wallis tests and post hoc Dunn's tests were used to identify associations between categorical and numerical parameters.
All the methods used were nonparametric, making no assumptions regarding normality. Statistical significance was determined by a p-value <0.05. The PocDoc VA and conventional VA were converted to logMAR values, and the “logMAR_difference” was calculated as the difference between these values. The “logMAR_average” was computed as the average of the two logMAR values. In the bivariate analysis, we excluded eyes with VA score poorer than 6/60 to ensure the validity of our data.
Results
BASELINE CHARACTERISTICS
The study participants had a mean age of 36.7 ± 23.3 years, with a range from 5 to 85 years. The median age was 42 years. The study recruited 428 subjects, 218 (50.93%) males and 210 (49.07%) females, and data were collected for a total of 792 measurements of VA, comprising of 398 from right eyes (50.25%) and 394 from left eyes (49.75%). The primary presenting complaints of the participants were blurred vision, diminished vision, tearing, redness, pain, itching, and trauma in either one or both eyes. Most of the examiners utilized the same device and were assigned to a specific department and test type for at least 4 out of 5 days of the data collection period.
COMPARING THE USE OF Poc Doc VA WITH CONVENTIONAL VA TESTING
The mean PocDoc logMAR value was 0.345, while the mean conventional logMAR value was 0.315. This means that, on average, the PocDoc method resulted in slightly worse VA scores compared to the conventional method, as evidenced also in Table 1. The correlation coefficient between the conventional and PocDoc logMAR VA values was rho = 0.845 and rho2 = 0.7133 (p = 6.617 × 10–215; adjusted p = 2.205 × 10–214), which shows that the two assessment measurements are highly correlated. We then used the BAP to visualize the differences (Fig. 2). BAP shows the difference between the two measurements on the y-axis and the average of the two measurements on the x-axis. In this study, the BAP showed that the mean difference between the two methods was significantly different from 0.00 logMAR.
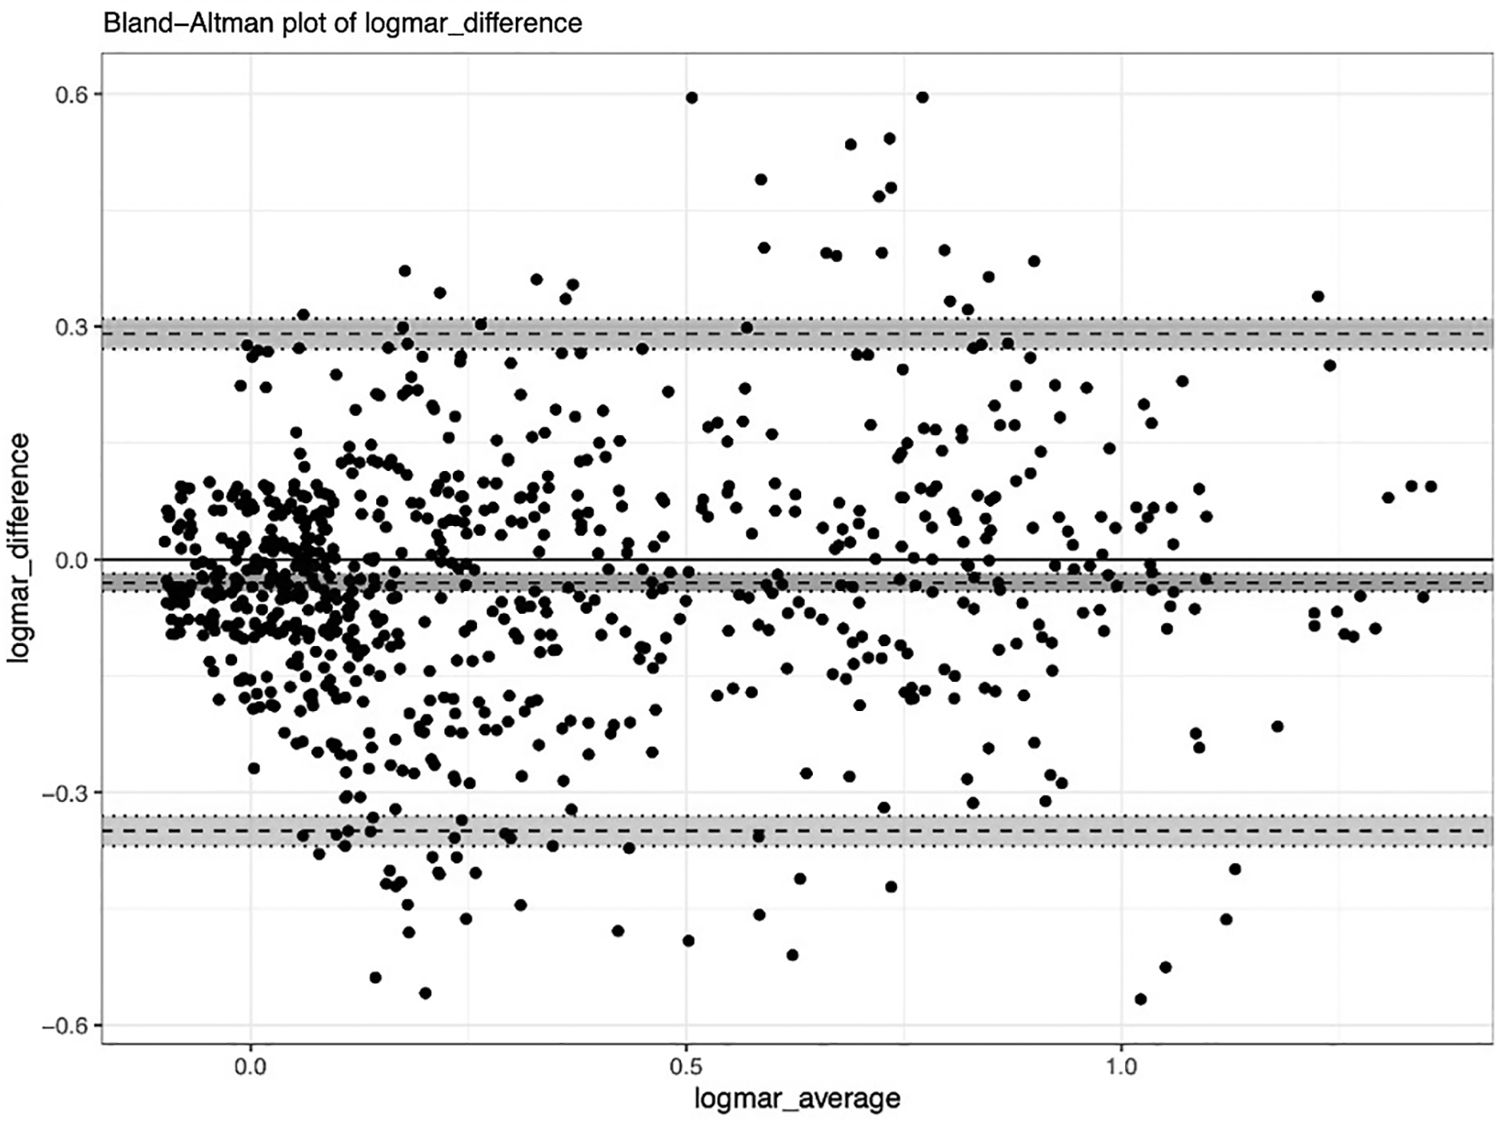
Bland–Altman plot with the x-axis representing the average of the PocDoc and conventional logMAR values and the y-axis representing the difference between logMAR values of the two assessment types. The mean logMAR difference (−0.0296) is represented by the dashed line in the blue horizontal bar. The dashed lines in the green and the red bar represents the LOAs (mean difference ±1.96 × standard deviation of logMAR differences). The 95% confidence intervals are shaded and bounded by dotted lines. LOAs, limits of agreement.
Comparison of Frequencies Per Range of Visual Acuity Obtained with PocDoc and Conventional Tests
We used the categories recommended by the World Health Organization for visual impairment.
VA, visual acuity.
This means that the PocDoc VA method when compared to conventional VA method is generally a bit lower (−0.0296 logMAR difference). The limits of agreement (LOA) of ±0.32 shows that most differences lie within 0.32 of the conventional assessment. However, the BAP also showed that the difference between the two methods tends to be spread across the average logMAR values evenly. Figure 3 represents the BAP across the three device types (iPad, mobile phone, and laptop) used in this study.
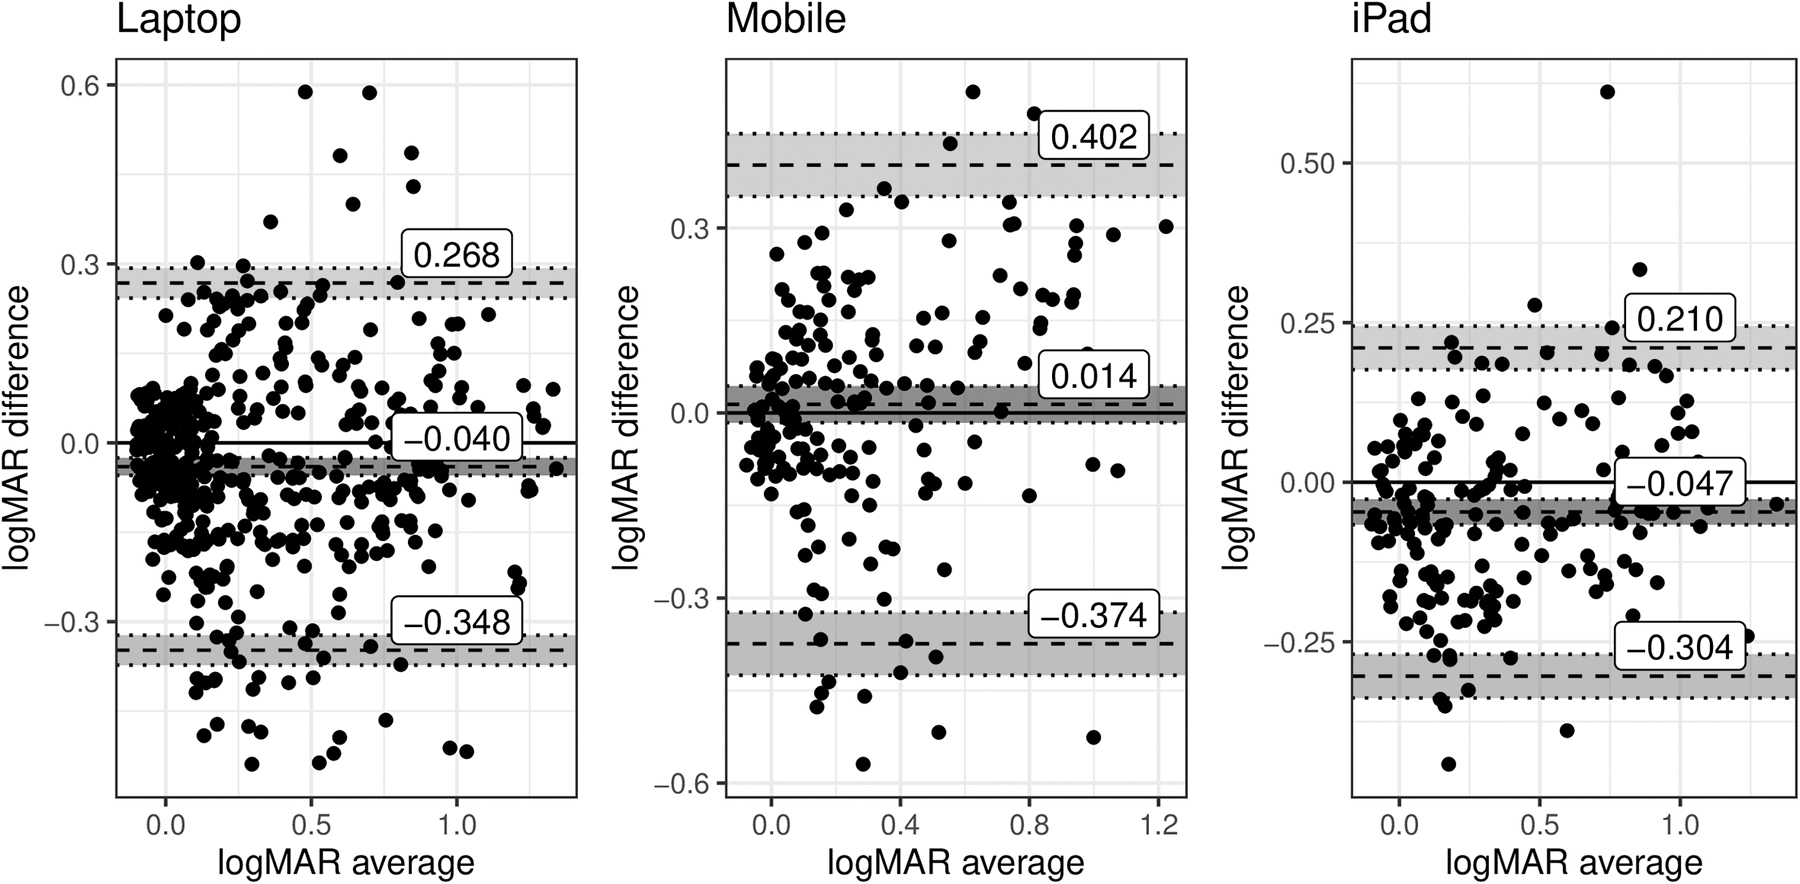
Bland–Altman plot with the x-axis representing the average of the PocDoc and conventional logMAR values and the y-axis representing the difference between logMAR values of the two assessment types for each of the three PocDoc devices. The mean logMAR difference is represented by the dashed line in the blue horizontal bar. The dashed lines in the green and the red bar represents the LOAs (mean difference ±1.96 × standard deviation of logMAR differences). The 95% confidence intervals are shaded and bounded by dotted lines. The data from the laptops and iPads are closer than that from the mobile devices.
When comparing PocDoc, executed on any device, with conventional VA methods (the gold standard) for the detection of any grade of visual impairment, PocDoc demonstrated a sensitivity of 91.7%, a specificity of 86.1%, and an accuracy of 88.0%. in addition, it showed a PPV of 76.9% and a NPV of 95.4% (Table 2).
PocDoc's Visual Impairment Detection: Contingency Table for Sensitivity, Specificity, Positive Predictive Value, and Negative Predictive Value Calculations
Visual impairment was defined as a VA worse than 6/12.
COMPARISON OF log MAR VA DIFFERENCES BETWEEN DIFFERENT TEST TYPES
The Kruskal–Wallis test, which was used to investigate whether there was a significant difference in the logMAR VA difference between the PocDoc Tail the Dog test for the pediatric population and the PocDoc Tumbling-E test for the adult population, found that the adjusted p-value for logMAR difference compared to test type was 0.77, indicating that there was no significant difference in logMAR VA difference between the two test types. This means that both tests produced similar results in terms of measuring VA. However, the study found that the Tumbling-E test had a larger spread of logMAR VA differences than the Tail the Dog test. This means that the Tumbling-E test produced a wider range of logMAR VA differences compared to the Tail the Dog test.
Test types and intervention both did not show any significant impact to the logMAR values; however, univariate testing showed that the examiners (p = 8.583 × 10⁻⁹, p_adjusted = 4.768 × 10⁻⁸) and device used (p = 1.740 × 10⁻⁵, p_adjusted = 8.698 × 10⁻⁵) had a significant impact on the logMAR differences. As the examiners used different devices to carry out the assessments, a generalized linear model using both device and examiner as the independent variables showed that examiners are the only significant terms when considering both examiners and devices together (Supplementary File S2). Figure 4 shows the examiner heterogeneity in the logMAR differences as a combination violin and strip plot.
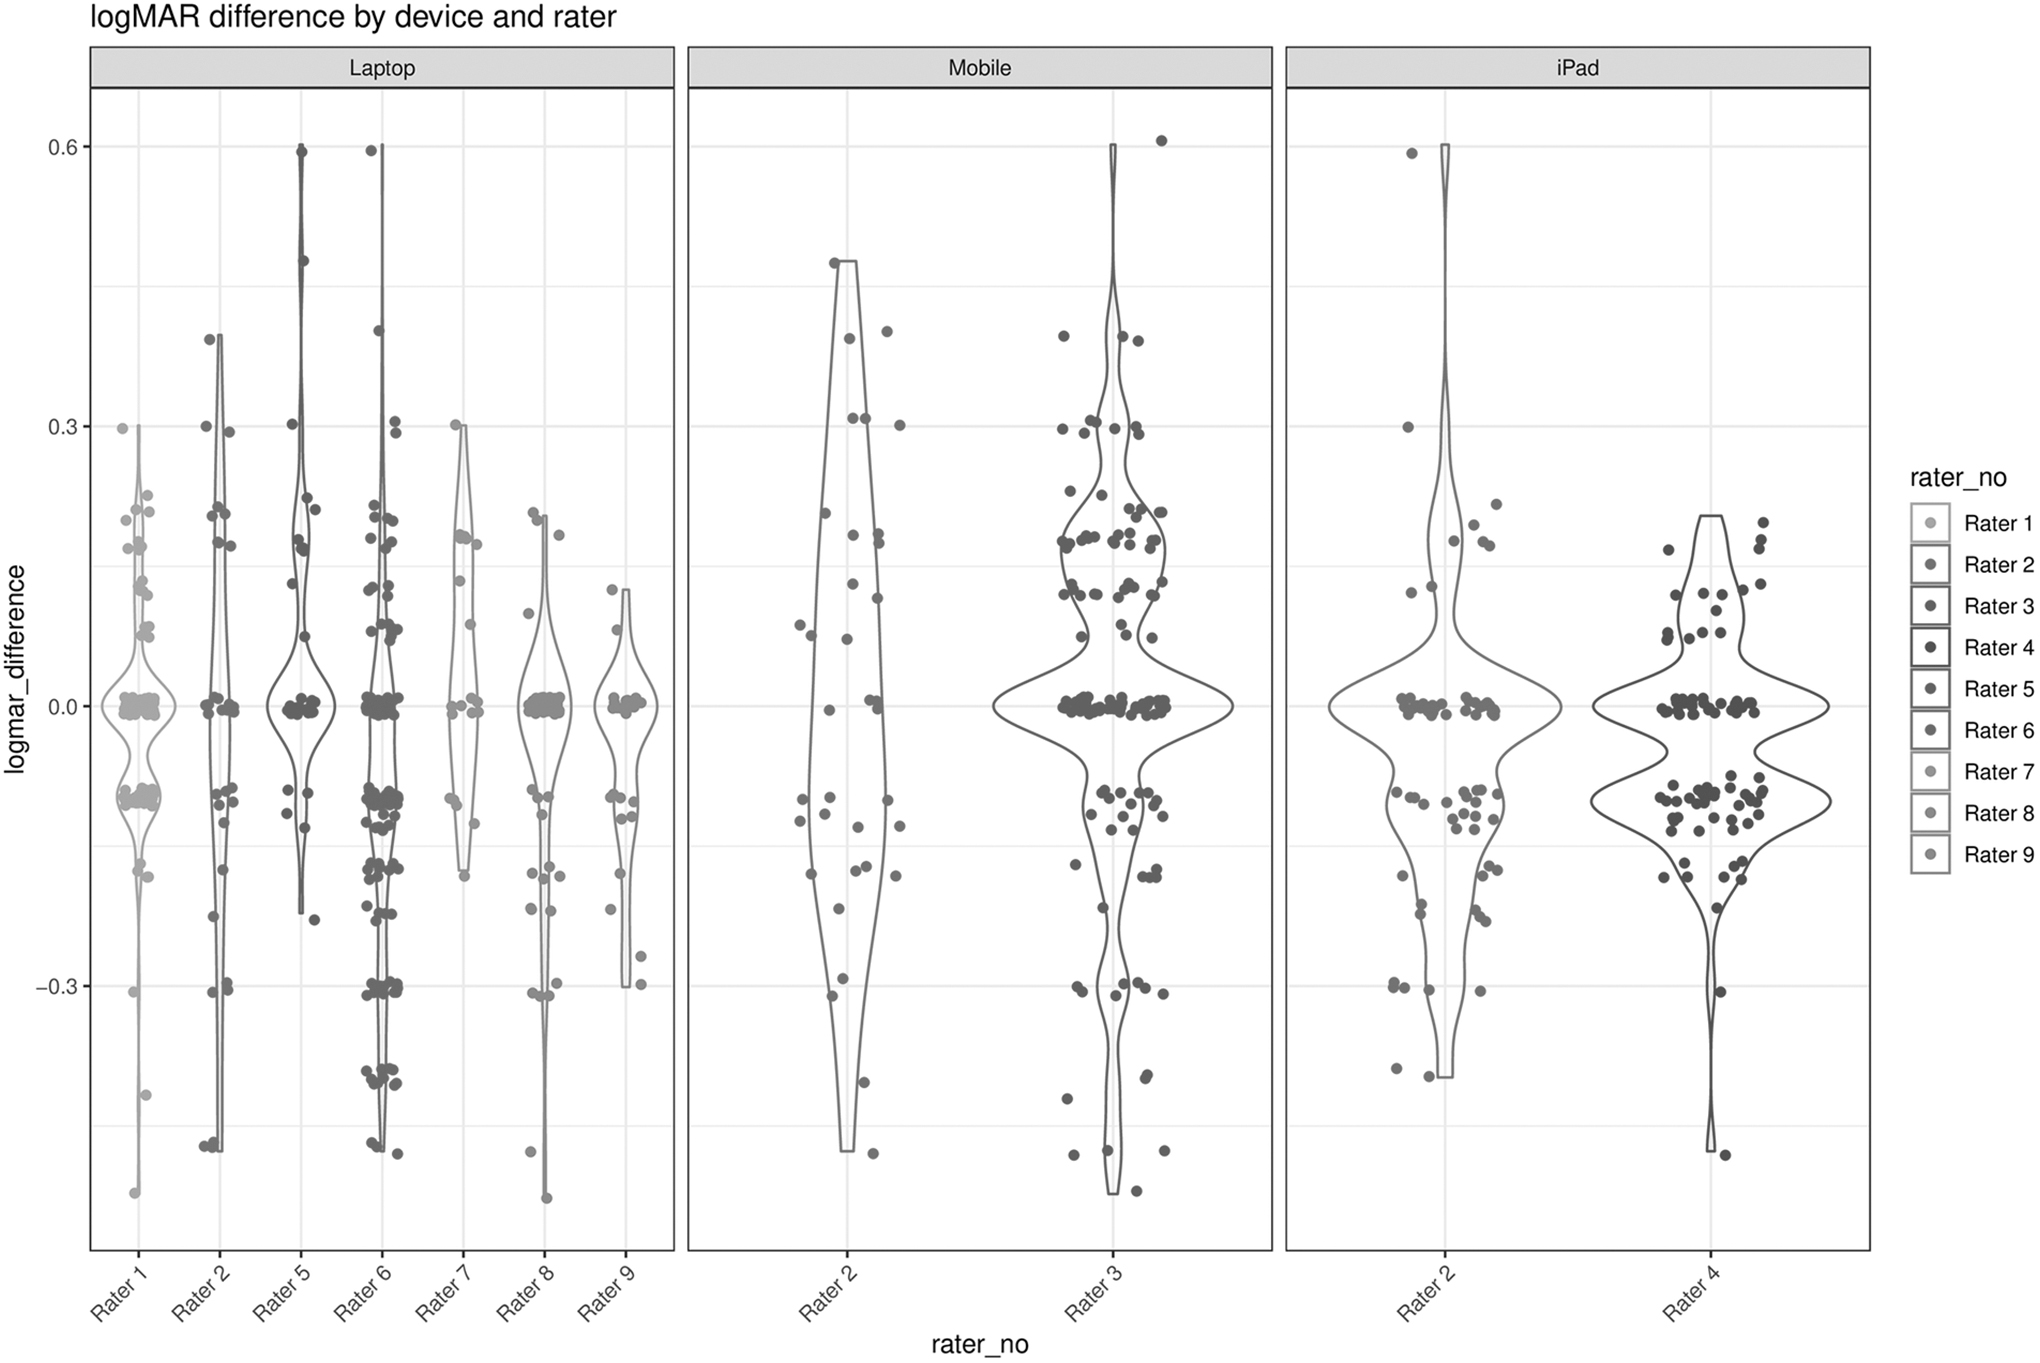
Combination violin and strip plots of the logMAR differences between PocDoc and conventional assessment against the various examiners. Each examiner's data are also given a unique color. The plot has been further faceted by the device type.
COMPARISON OF log MAR VA DIFFERENCES PRE AND POSTINTERVENTION
The Kruskal–Wallis test found that the corrected p-value for logMAR VA difference compared to intervention was 0.65, indicating that there was no significant difference in logMAR VA difference between pre- and postintervention. This result suggests that the intervention did not have a significant impact on the results of the VA test.
Discussion
This study has demonstrated that PocDoc, a web-based app, can be used to measure VA with limited bias, indicating a largely similar level of agreement between PocDoc and the conventional VA test across various levels of visual acuities. The findings suggest that there were some discrepancies between the two methods, with the PocDoc method resulting in slightly worse VA scores than the conventional method. Moreover, the difference between the two methods increased with higher logMAR VA, indicating that the PocDoc method may be less accurate in measuring higher levels of visual impairment. However, within a certain range of VA scores, the two methods were still interchangeable.
Our results highlight the importance of considering the device used to measure VA when conducting research in this field, as it can significantly affect the results obtained. Specifically, the mobile device used in the study produced significantly different results compared to the laptop and iPad and had a wider range of logMAR differences. Therefore, the type of device used should be considered when designing studies in this area.
Furthermore, based on the study's results, it could be suggested that the Tail the Dog test may be a more reliable test for measuring VA in the pediatric population compared to the Tumbling-E test in the adult population. The interactive forms of VA testing, such as PocDoc Tail the Dog, may have the potential to provide better results, although further research is needed to confirm this.
No statistically significant difference between the pre- and postintervention for logMAR VA may be because a longer period of training is required to observe a significant decrease in the difference between the PocDoc and conventional VA results, or the training provided was not effective. However, given that the examiners deemed the 4-day training period to be comprehensive and sufficient, the lack of a notable difference is more likely associated with the easy usability and shallow learning curve of the PocDoc application, which negated the impact of training on the accuracy of recorded results.
The discrepancies between PocDoc and conventional VA methods may be due to inconsistencies in the way VA was recorded and reported, differences in lighting conditions, differences in the distance between the subject and the PocDoc VA device, differences in the calibration of the devices, variations in the angle at which the VA was measured, or the level of patient engagement or understanding during the test. In addition, the logMAR VA difference across different device types could be attributed to several factors, such as the challenge in maintaining the required distance between the patient and the mobile phone, which needs to be held by the examiner, and the font type for the letter “E” used in the Tumbling-E test on the mobile phone, which differed from that of the laptop and iPad.
The difference in screen resolution and contrast could also have contributed to this variance. Finally, since specific examiners were assigned to each device, differences in the examiners' testing style using the mobile phone could have played a role in the observed differences.
Further studies are required to evaluate the cause of these discrepancies. However, there are still strong arguments for favouring and supporting PocDoc VA testing as a valuable tool for VA assessment in rural communities. First, PocDoc VA devices are handheld and can be used in remote settings, making them a valuable tool for reaching underserved populations who may not have access to conventional VA testing methods. Second, PocDoc VA testing has been shown to be reliable and accurate when compared to conventional methods. The diagnostic testing accuracy of PocDoc to detect any grade of visual impairment was superior to others smartphone-based screening tools. PocDoc showed a sensitivity of 91.7% and a PPV of 76.9%, compared to Peek, a smartphone-based screening tool tested in Kenyan schools, that showed a sensitivity of 76.9% and a PPV of 23.1%. 20
Furthermore, PocDoc VA testing has the potential to reduce costs associated with traditional VA testing methods. Conventional VA methods often require specialized equipment or charts and trained personnel, whereas PocDoc VA devices are relatively inexpensive and can be operated by nonspecialist personnel. Thus, PocDoc VA testing has the potential to improve the efficiency of VA assessment in rural communities.
Recent studies have shown the potential of novel web applications, like DigiVis, 16,17 to enable accurate and reliable self-assessment of distance VA using standard digital devices. One study recruited 120 patients aged 5–87 years, who self-tested their vision twice using DigiVis in addition to their standard clinical assessment. The results showed that the bias between VA tests was insignificant, with an upper LOA of 0.173 logMAR and a lower LOA of −0.175 logMAR, and the intraclass correlation coefficient (ICC) was 0.818. The study concluded that DigiVis is accurate, reliable, and well-accepted by patients for self-testing distance VA, with potential to facilitate home monitoring, triage, and remote consultation. 16
A recent study evaluated the accuracy and reliability of DigiVis for automated self-assessment of distance VA in children aged 4–10 years. The study found that VA self-testing showed a mean bias of 0.023 logMAR, with a LOA of ±0.195 logMAR and an ICC of 0.816. User feedback was also collected through a questionnaire, which showed that 96% of children rated the test as good or excellent, as did 99% of their parents. 17
These studies suggest that web applications like PocDoc and DigiVis have the potential to provide accurate and reliable self-assessment of VA, with high levels of user acceptance. However, they do not replace a complete eye examination by an optometrist or ophthalmologist. These tools are designed to recognize gross abnormalities in VA that could suggest the presence of visual impairments or conditions. However, it might not be sensitive or specific enough to account for or differentiate between various ocular conditions such as presbyopia, pseudophakia, myopia, and hyperopia. These web applications could be particularly useful in rural communities where access to trained evaluators and calibrated devices may be limited. Moreover, the use of digital self-testing could potentially reduce the need for face-to-face clinical capacity, allowing for more efficient use of health care resources.
With the ongoing COVID-19 pandemic, 14,15 the need for remote consultations has become increasingly important, and web applications like PocDoc and DigiVis could provide a viable option for remote self-assessment of VA in children and elderly population, potentially reducing the burden on health care services and increasing accessibility to ophthalmological care. However, wider implementation will require integration with existing health care systems, development of appropriate training programs, and further research to validate and optimize these tools for use across various populations and settings.
Conclusions
In conclusion, this study demonstrated that PocDoc is a promising web-based application for measuring VA, with limited bias compared to conventional methods. Although some discrepancies were observed between the PocDoc and conventional methods, these differences were relatively small and could be accounted for by various factors such as device type, testing conditions, and calibration. The findings suggest that PocDoc can be a valuable tool for assessing VA in rural and remote settings, offering advantages in terms of ease of use, portability, cost-effectiveness, and efficiency.
Footnotes
Authors' Contributions
S.S., R.L., H.L., M.A., P.J., P.A., A.G., P.M., R.C., K.C., S.B., Suman, G.S., A.S., J.S., M.P., and P.S.: Conceptualization (equal), Investigation (equal), Writing—original draft (equal), and Project administration (equal), J.B., W.R.-C.: Data curation, Writing—original draft, B.L.: Methodology (equal), Formal analysis (lead), Visualization (lead), and Writing—review and editing (equal), L.S. and A.S.: Conceptualization (equal) and Writing—review and editing (equal), R.A.: Conceptualization (lead), Methodology (equal), Investigation (lead), Funding acquisition (lead), Supervision (lead), and writing—review and editing (equal).
Disclosure Statement
No competing financial interests exist. The PocDoc app was submitted for an invention disclosure funded by NTF-HIP_DEC2019_C1_C_02
Funding Information
The study was funded by NTF-HIP_DEC2019_C1_C_02. Grant Number: NTF_JUN2019_I_C1_D_01.
Supplementary Material
Supplementary File S1
Supplementary File S2
References
Supplementary Material
Please find the following supplemental material available below.
For Open Access articles published under a Creative Commons License, all supplemental material carries the same license as the article it is associated with.
For non-Open Access articles published, all supplemental material carries a non-exclusive license, and permission requests for re-use of supplemental material or any part of supplemental material shall be sent directly to the copyright owner as specified in the copyright notice associated with the article.
