




Abstract
Background:
Little is known about the trends and costs of hypertension management through telehealth among individuals enrolled in Medicaid.
Methods:
Using MarketScan® Medicaid database, we examined outpatient visits among people with hypertension aged 18–64 years. We presented the numbers of hypertension-related telehealth and in-person outpatient visits per 100 individuals and the proportion of hypertension-related telehealth outpatient visits to total outpatient visits by month, overall, and by race and ethnicity. For the cost analysis, we presented total and patient out-of-pocket (OOP) costs per visit for telehealth and in-person visits in 2021.
Results:
Of the 229,562 individuals, 114,445 (49.9%) were non-Hispanic White, 80,692 (35.2%) were non-Hispanic Black, 3,924 (1.71%) were Hispanic. From February to April 2020, the number of hypertension-related telehealth outpatient visits per 100 persons increased from 0.01 to 6.13, the number of hypertension-related in-person visits decreased from 61.88 to 52.63, and the proportion of hypertension-related telehealth outpatient visits increased from 0.01% to 10.44%. During that same time, the proportion increased from 0.02% to 13.9% for non-Hispanic White adults, from 0.00% to 7.58% for non-Hispanic Black adults, and from 0.12% to 19.82% for Hispanic adults. The average total and patient OOP costs per visit in 2021 were $83.82 (95% confidence interval [CI], 82.66–85.05) and $0.55 (95% CI, 0.42–0.68) for telehealth and $264.48 (95% CI, 258.87–269.51) and $0.72 (95% CI, 0.65–0.79) for in-person visits, respectively.
Conclusions:
Hypertension management via telehealth increased among Medicaid recipients regardless of race and ethnicity, during the COVID-19 pandemic. These findings may inform telehealth policymakers and health care practitioners.
Introduction
Hypertension (blood pressure over 130/80 mm Hg) is the leading risk factor for cardiovascular disease–related morbidity and mortality in the United States. 1,2 From 2017 to 2020, an estimated 47% of adults (122.4 million) aged >20 years were diagnosed with hypertension. 1 In 2017–2018, hypertension cost the nation >$52 billion annually. 1 The prevalence of hypertension is disproportionately higher among racial and ethnic minorities. 1 In 2017–2020, 58% of non-Hispanic Black women and 58% of non-Hispanic Black men were diagnosed with hypertension compared with 43% and 49% among non-Hispanic White women and men, respectively. Among Hispanic individuals, 50% of men were diagnosed with hypertension, whereas 35% of Hispanic women were diagnosed with hypertension, the lowest among any group. Higher rates persist among Medicaid recipients, who have a demographic makeup of ∼50% Black or Hispanic. 3,4 Among 19- to 64-year-olds, 28% of Medicaid recipients are diagnosed with hypertension, compared with 22% of privately insured persons. 3,5
In addition to disparities in hypertension prevalence, disparities persist in management of high blood pressure. 1,6 –8 Controlling hypertension is a priority for the nation's leading public health entities. 1,9 Adverse effects of hypertension can be reduced by preventing disease progression through consistent hypertension management 10 and ongoing patient–clinician communication to achieve hypertension control. 11,12 One such tool is telehealth, involving the exchange of medical information via remote electronic communication (e.g., remote monitoring or virtual follow-ups). 13 Prompted by state-mandated stay-at-home orders, telehealth use proliferated during the COVID-19 pandemic 14,15 to address delays in doctor visits 16,17 and interrupted continuity of care. 11,15,18 Telehealth use facilitated access to clinical care during the pandemic 11,16,19 and may reduce health disparities. 20,21
The rise of telehealth during the COVID-19 pandemic and its potential to reduce barriers to care is well documented. 20 –23 Yet, no study has analyzed the trends and costs of telehealth for hypertension management by race and ethnicity. This study aims to examine the following outcomes by race and ethnicity among individuals with Medicaid (1) trends in hypertension-related outpatient visits (telehealth and in-person) before and during the COVID-19 pandemic (2019–2021) and (2) costs of outpatient visits in 2021.
Methods
DATA SOURCE
We used the Merative® MarketScan® Multi-States Medicaid Database from January 1, 2017 to December 31, 2021. 24 The MarketScan Medicaid Database contains administrative claims data from 5 to 13 states for each year and unique IDs to follow individuals over time. The Medicaid Database ranged from 9.0 million enrollees in 2017 to 9.4 million in 2021. We accessed the data through Merative Treatment Pathways, which allows researchers to extract data through online query-based tools. This project was not considered to be human subjects research and therefore did not require Institutional Review Board approval.
STUDY SAMPLE
The study sample included people aged 18–64 years with diagnosed hypertension in 2017–2018, 2 years of lookback periods, without including children or the dual Medicare-eligible population because their health care utilization patterns might be different from people aged 18–64 years. 25 Individuals were defined as having hypertension if they had at least one inpatient or emergency department visit or two outpatient visits 30 days apart with International Classification of Diseases, Tenth Revision, Clinical Modification (ICD-10-CM) diagnoses codes 110–I15 (Supplementary Table S1). In addition, these adults had to be continuously enrolled in Medicaid during 2017–2021. We excluded people who had pregnancy-related ICD-10-CM, diagnosis-related group (DRG), or ICD-10-PCS (procedure coding system) codes (Supplementary Table S1). 26
HYPERTENSION-RELATED OUTPATIENT VISITS (TELEHEALTH AND IN-PERSON)
Telehealth outpatient visits were defined as an outpatient claim with a telehealth-related place of service code or procedure modifier and counted based on unique service date for the visit. In-person outpatient visits were defined as an outpatient claim without a telehealth-related place of service code or procedure modifier (Supplementary Table S2) and counted based on unique service date for the visit. Outpatient visits were considered hypertension-related if the claim contained at least one hypertension diagnosis (Supplementary Table S1).
HYPERTENSION-RELATED COSTS (PER VISIT)
We estimated the (1) average cost per outpatient visit (telehealth and in-person), (2) average out-of-pocket (OOP) cost for individuals per visit, and (3) share of patients' OOP costs to total costs. The cost analysis was restricted to persons with noncapitated insurance plans in 2021, because payment information from managed care and capitated insurance plans are unreliable. Year 2021 was selected to include the most recent cost data available in MarketScan. All cost estimates are presented per visit at 2021 price levels.
INDIVIDUAL CHARACTERISTICS
Racial and ethnic groups were classified by the MarketScan data team into three groups: non-Hispanic White, non-Hispanic Black, and Hispanic. Estimates for other race and ethnicity groups could not be reported owing to small sample size and data-user agreements; however, individuals from these groups were included in the overall results.
STATISTICAL ANALYSIS
From January 1, 2019 to December 31, 2021, we calculated (1) monthly numbers of hypertension-related telehealth and in-person outpatient visits per 100 individuals and (2) monthly proportions of hypertension-related telehealth outpatient visits (i.e., the total number of hypertension-related telehealth outpatient visits divided by the total number of hypertension-related outpatient visits).
We tested differences in monthly estimates by race and ethnicity using analysis of variance and differences for non-Hispanic White versus non-Hispanic Black, non-Hispanic White versus Hispanic, and non-Hispanic Black versus Hispanic using Welch's two-tailed t-test. The month-to-month changes from February 2020 (i.e., the month before the COVID-19 pandemic declaration) to June 2020 (i.e., the end of the stay-at-home order period in most states 17 ) were tested with Welch's two-tailed t-test. A value of p < 0.05 indicated statistical significance.
We determined monthly averages of all months from January 2019 to February 2020 (pre-COVID-19 pandemic period), from March 2020 to December 2021 (during the pandemic), and from July 2020 to December 2021 (after stay-at-home order periods). 17 Hypertension-related outpatient visits were reported per patient per year, and hypertension-related costs were reported per visit for year 2021. We reported mean values and bias-corrected and accelerated bootstrap 95% confidence intervals (CIs) with 1,000 replications for outcomes. We used Stata SE statistical software version 17 (StataCorp, College Station, TX) for all analyses. Data analysis was performed in 2022–2023.
Results
From 2017 to 2021, we identified 229,562 adults aged 18–64 years with hypertension, continuously enrolled in Medicaid, and without a pregnancy diagnosis (Fig. 1). Of the sample, 114,445 (49.9%) were non-Hispanic White, 80,692 (35.2%) were non-Hispanic Black, 3,924 (1.71%) were Hispanic, and 30,501 (13.3%) were classified as other race and ethnicity (Table 1). The mean age (standard deviation [SD]) was 50.2 (10.6) years, and 58.9% of the sample were women.
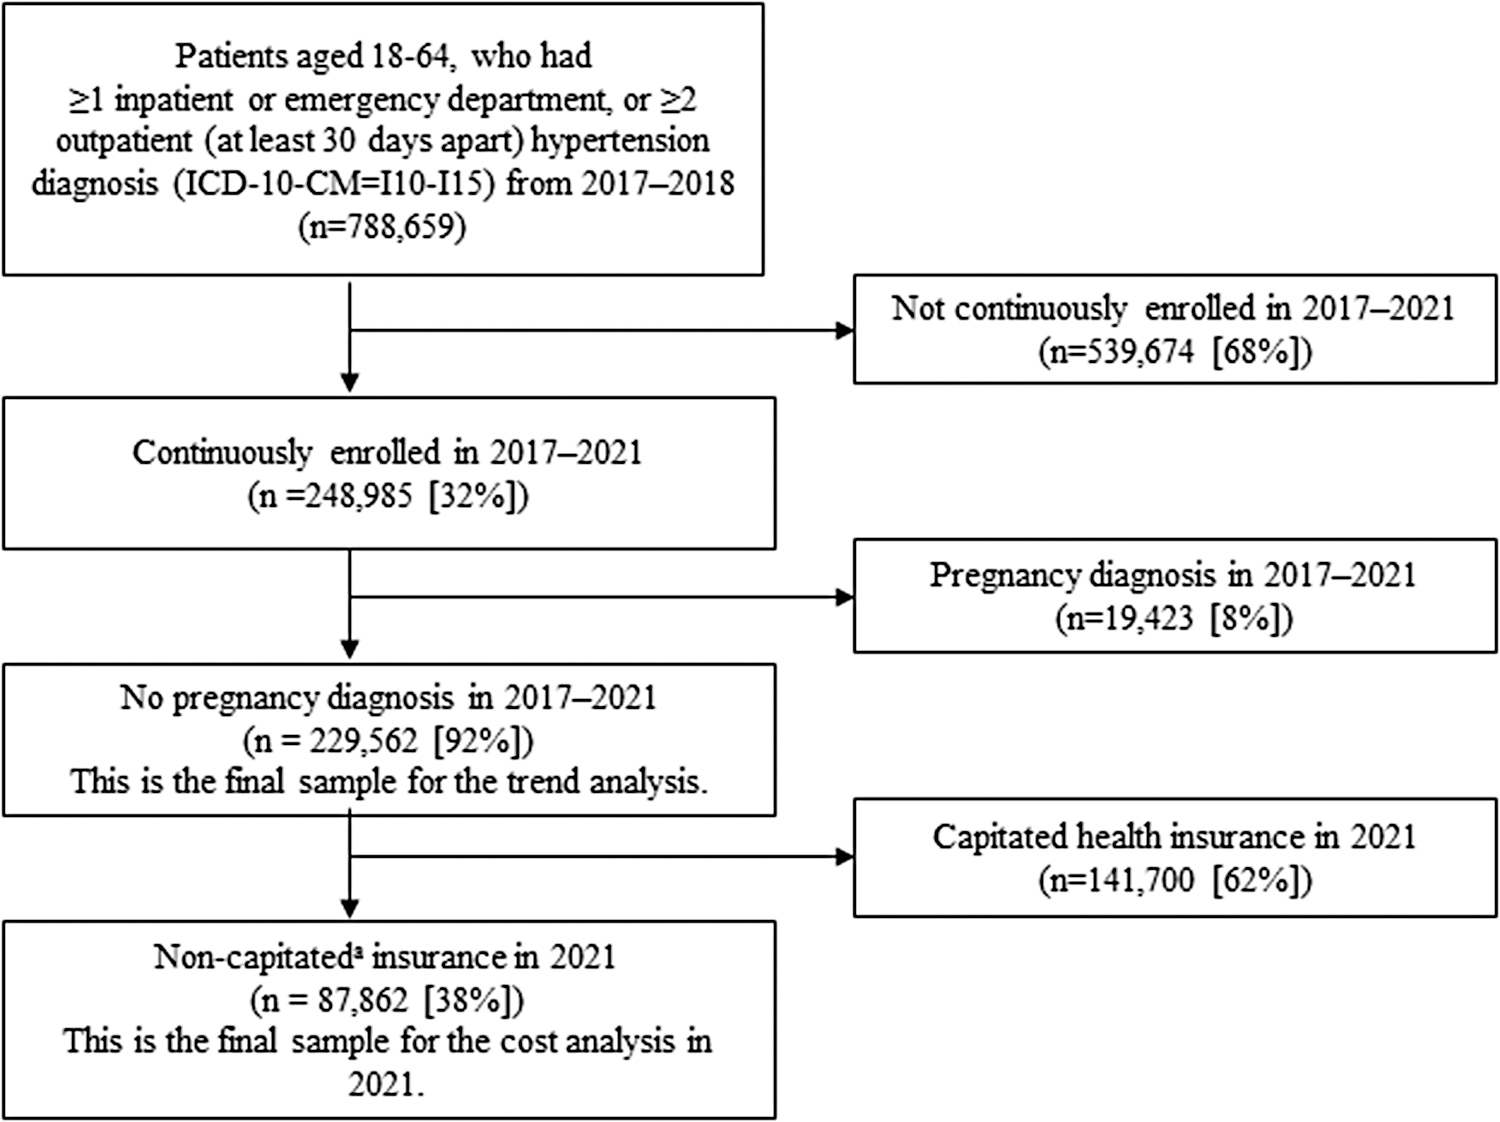
Study sample selection of individuals diagnosed with hypertension, MarketScan® Medicaid Database, 2017–2021. For the cost analysis, we restricted our population to those with noncapitated insurance because costs based on capitated plans are unreliable. ICD-10-CM; International Classification of Diseases, Tenth Revision, Clinical Modification.
Summary Statistics, MarketScan Medicaid Database, 2016–2021 a
SD, standard deviation.
Of the 229,562 people identified in the sample selection process, there were 87,862 with noncapitated insurance in 2021 for subsample analysis (Fig. 1).
HYPERTENSION-RELATED OUTPATIENT VISITS (TELEHEALTH AND IN-PERSON)
From January 2019 to February 2020 (pre-COVID-19 pandemic period), the monthly average of hypertension-related telehealth outpatient visits per 100 individuals was 0.01 (Fig. 2 and Supplementary Table S3). From February 2020 to April 2020 (i.e., the month after the COVID-19 pandemic declaration), the number of hypertension-related telehealth outpatient visits per 100 persons increased from 0.01 to 6.13, decreased thereafter to 3.41 in June 2020, and the monthly average from July 2020 to December 2021 (after stay-at-home order periods) was 1.83. From January 2019 to February 2020, the monthly average of the number of hypertension-related in-person outpatient visits per 100 individuals was 62.66. The number decreased from 61.88 in February 2020 to 52.63 in April 2020 (14.95% decrease), and thereafter returned to a prepandemic level (61.97) in June 2020. The monthly average from July 2020 to December 2021 was 64.67.
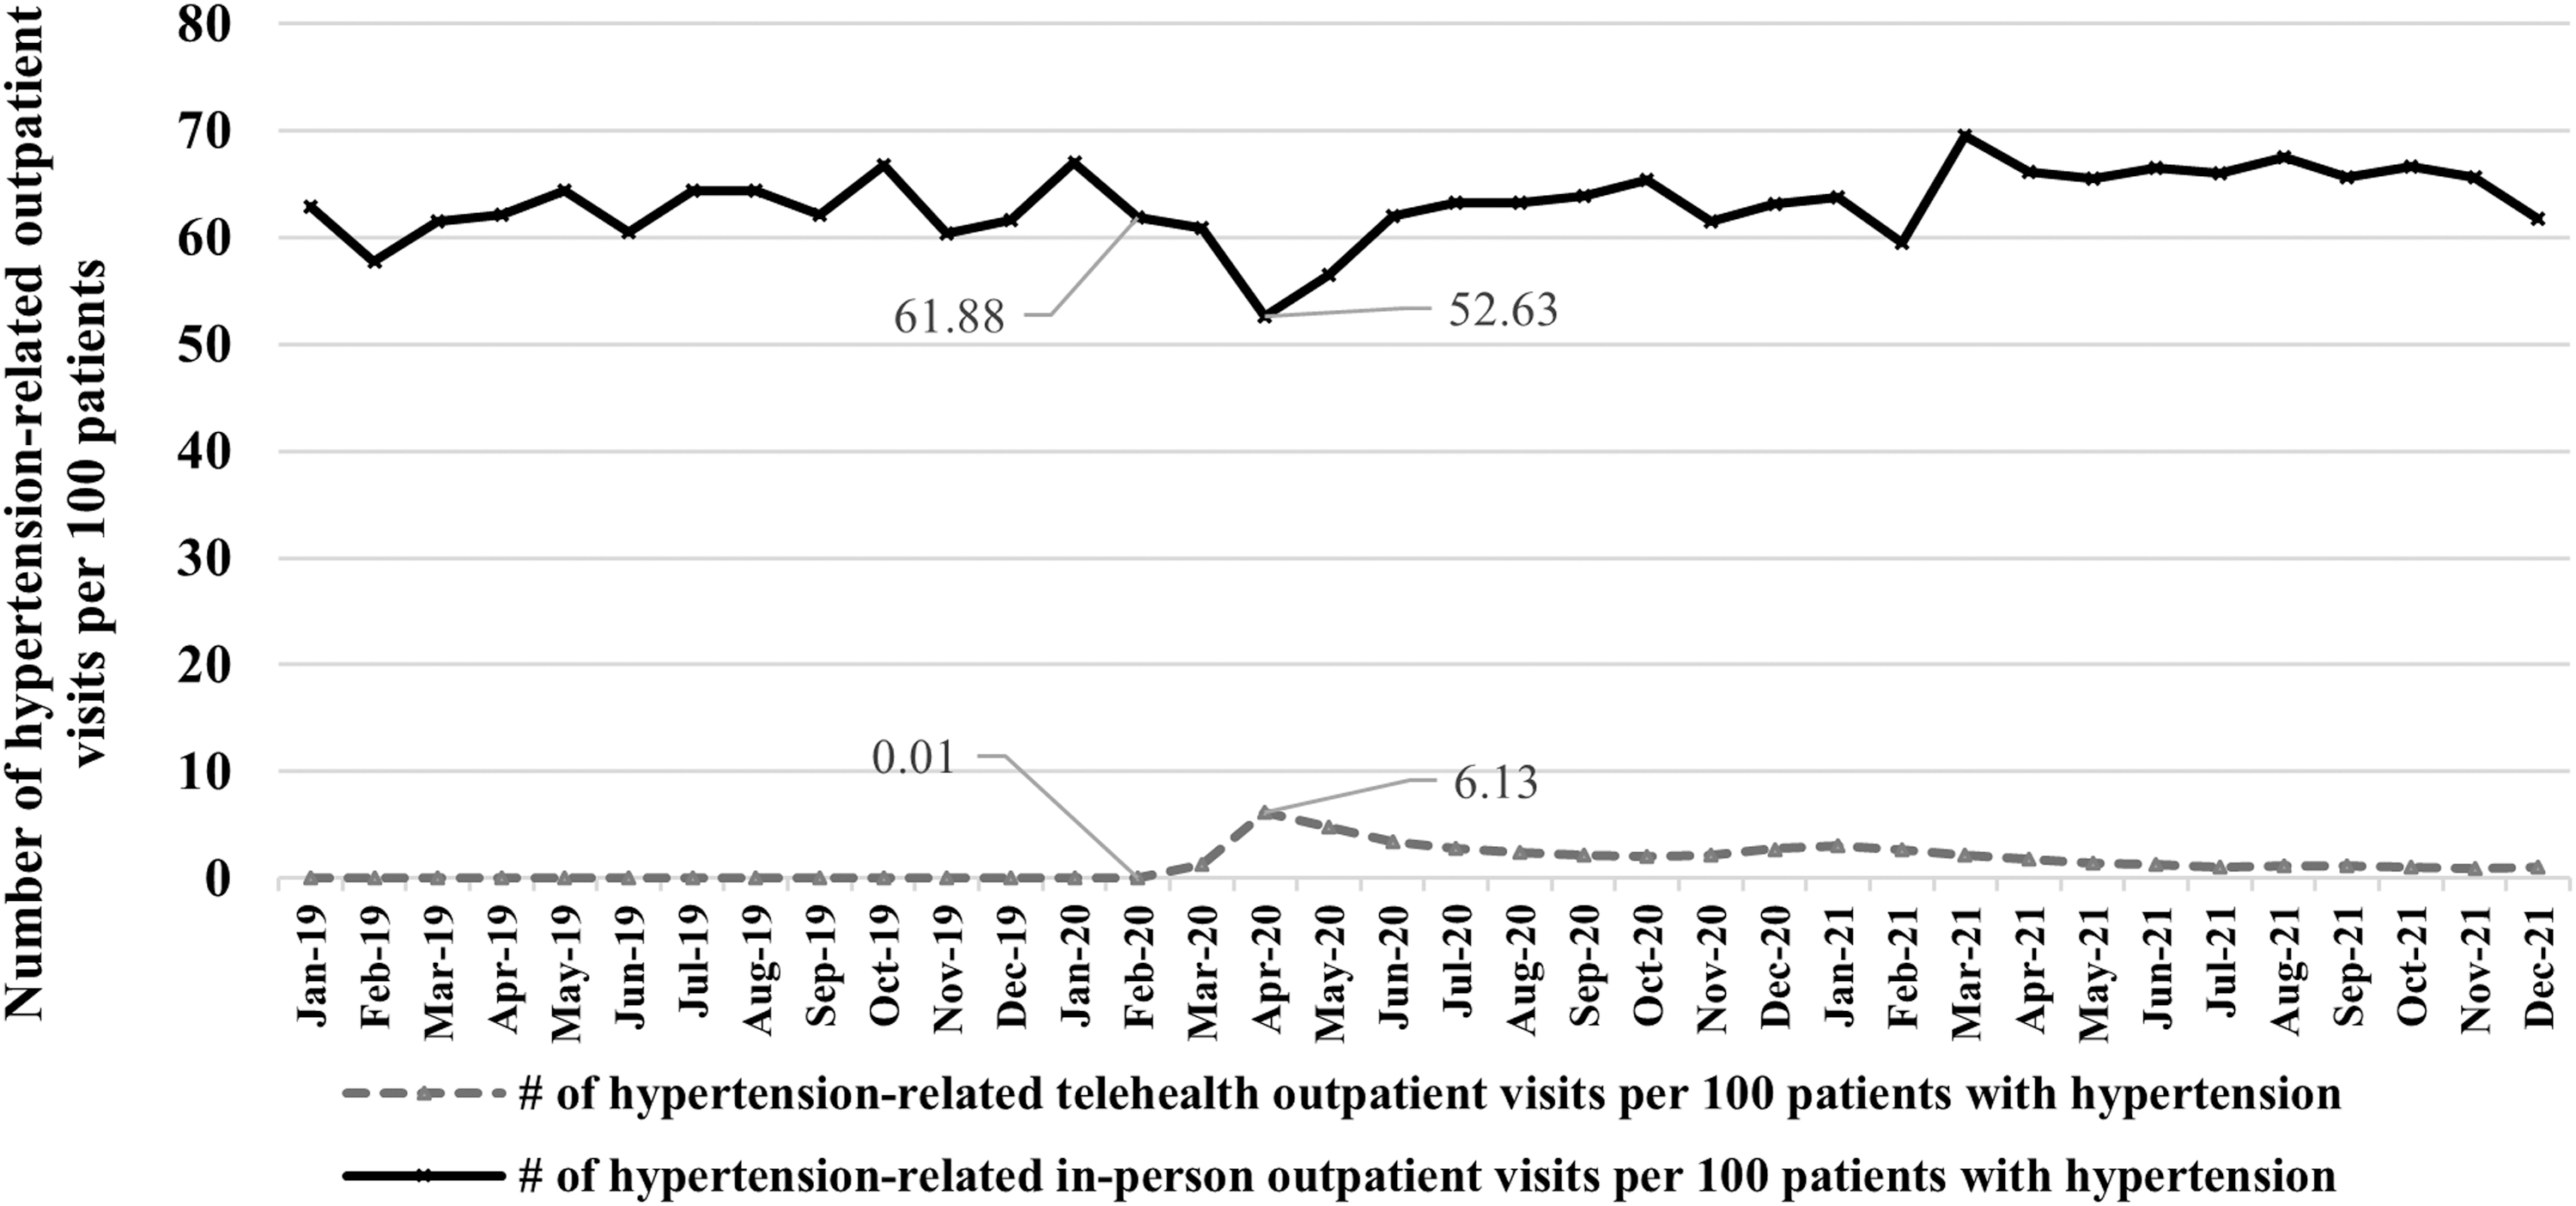
The numbers of hypertension-related telehealth and in-person outpatient visits per 100 persons, MarketScan Medicaid Database, 2019–2021.
Compared with non-Hispanic White and Hispanic adults, non-Hispanic Black adults had statistically significantly more hypertension-related in-person outpatient visits during pre-COVID-19 and COVID-19 pandemic periods (Fig. 3 A). The average number of in-person visits was more than twice as high for non-Hispanic Black adults as for non-Hispanic White and Hispanic adults (Supplementary Table S3B; p < 0.001). During the pre-COVID-19 period, the monthly average number of hypertension-related in-person visits per 100 adults was 44.89 for non-Hispanic White, 92.86 for non-Hispanic Black, and 42.49 for Hispanic individuals. The numbers were lowest in April 2020: 34.14 for non-Hispanic White, 84.39 for non-Hispanic Black, and 29.79 for Hispanic individuals.
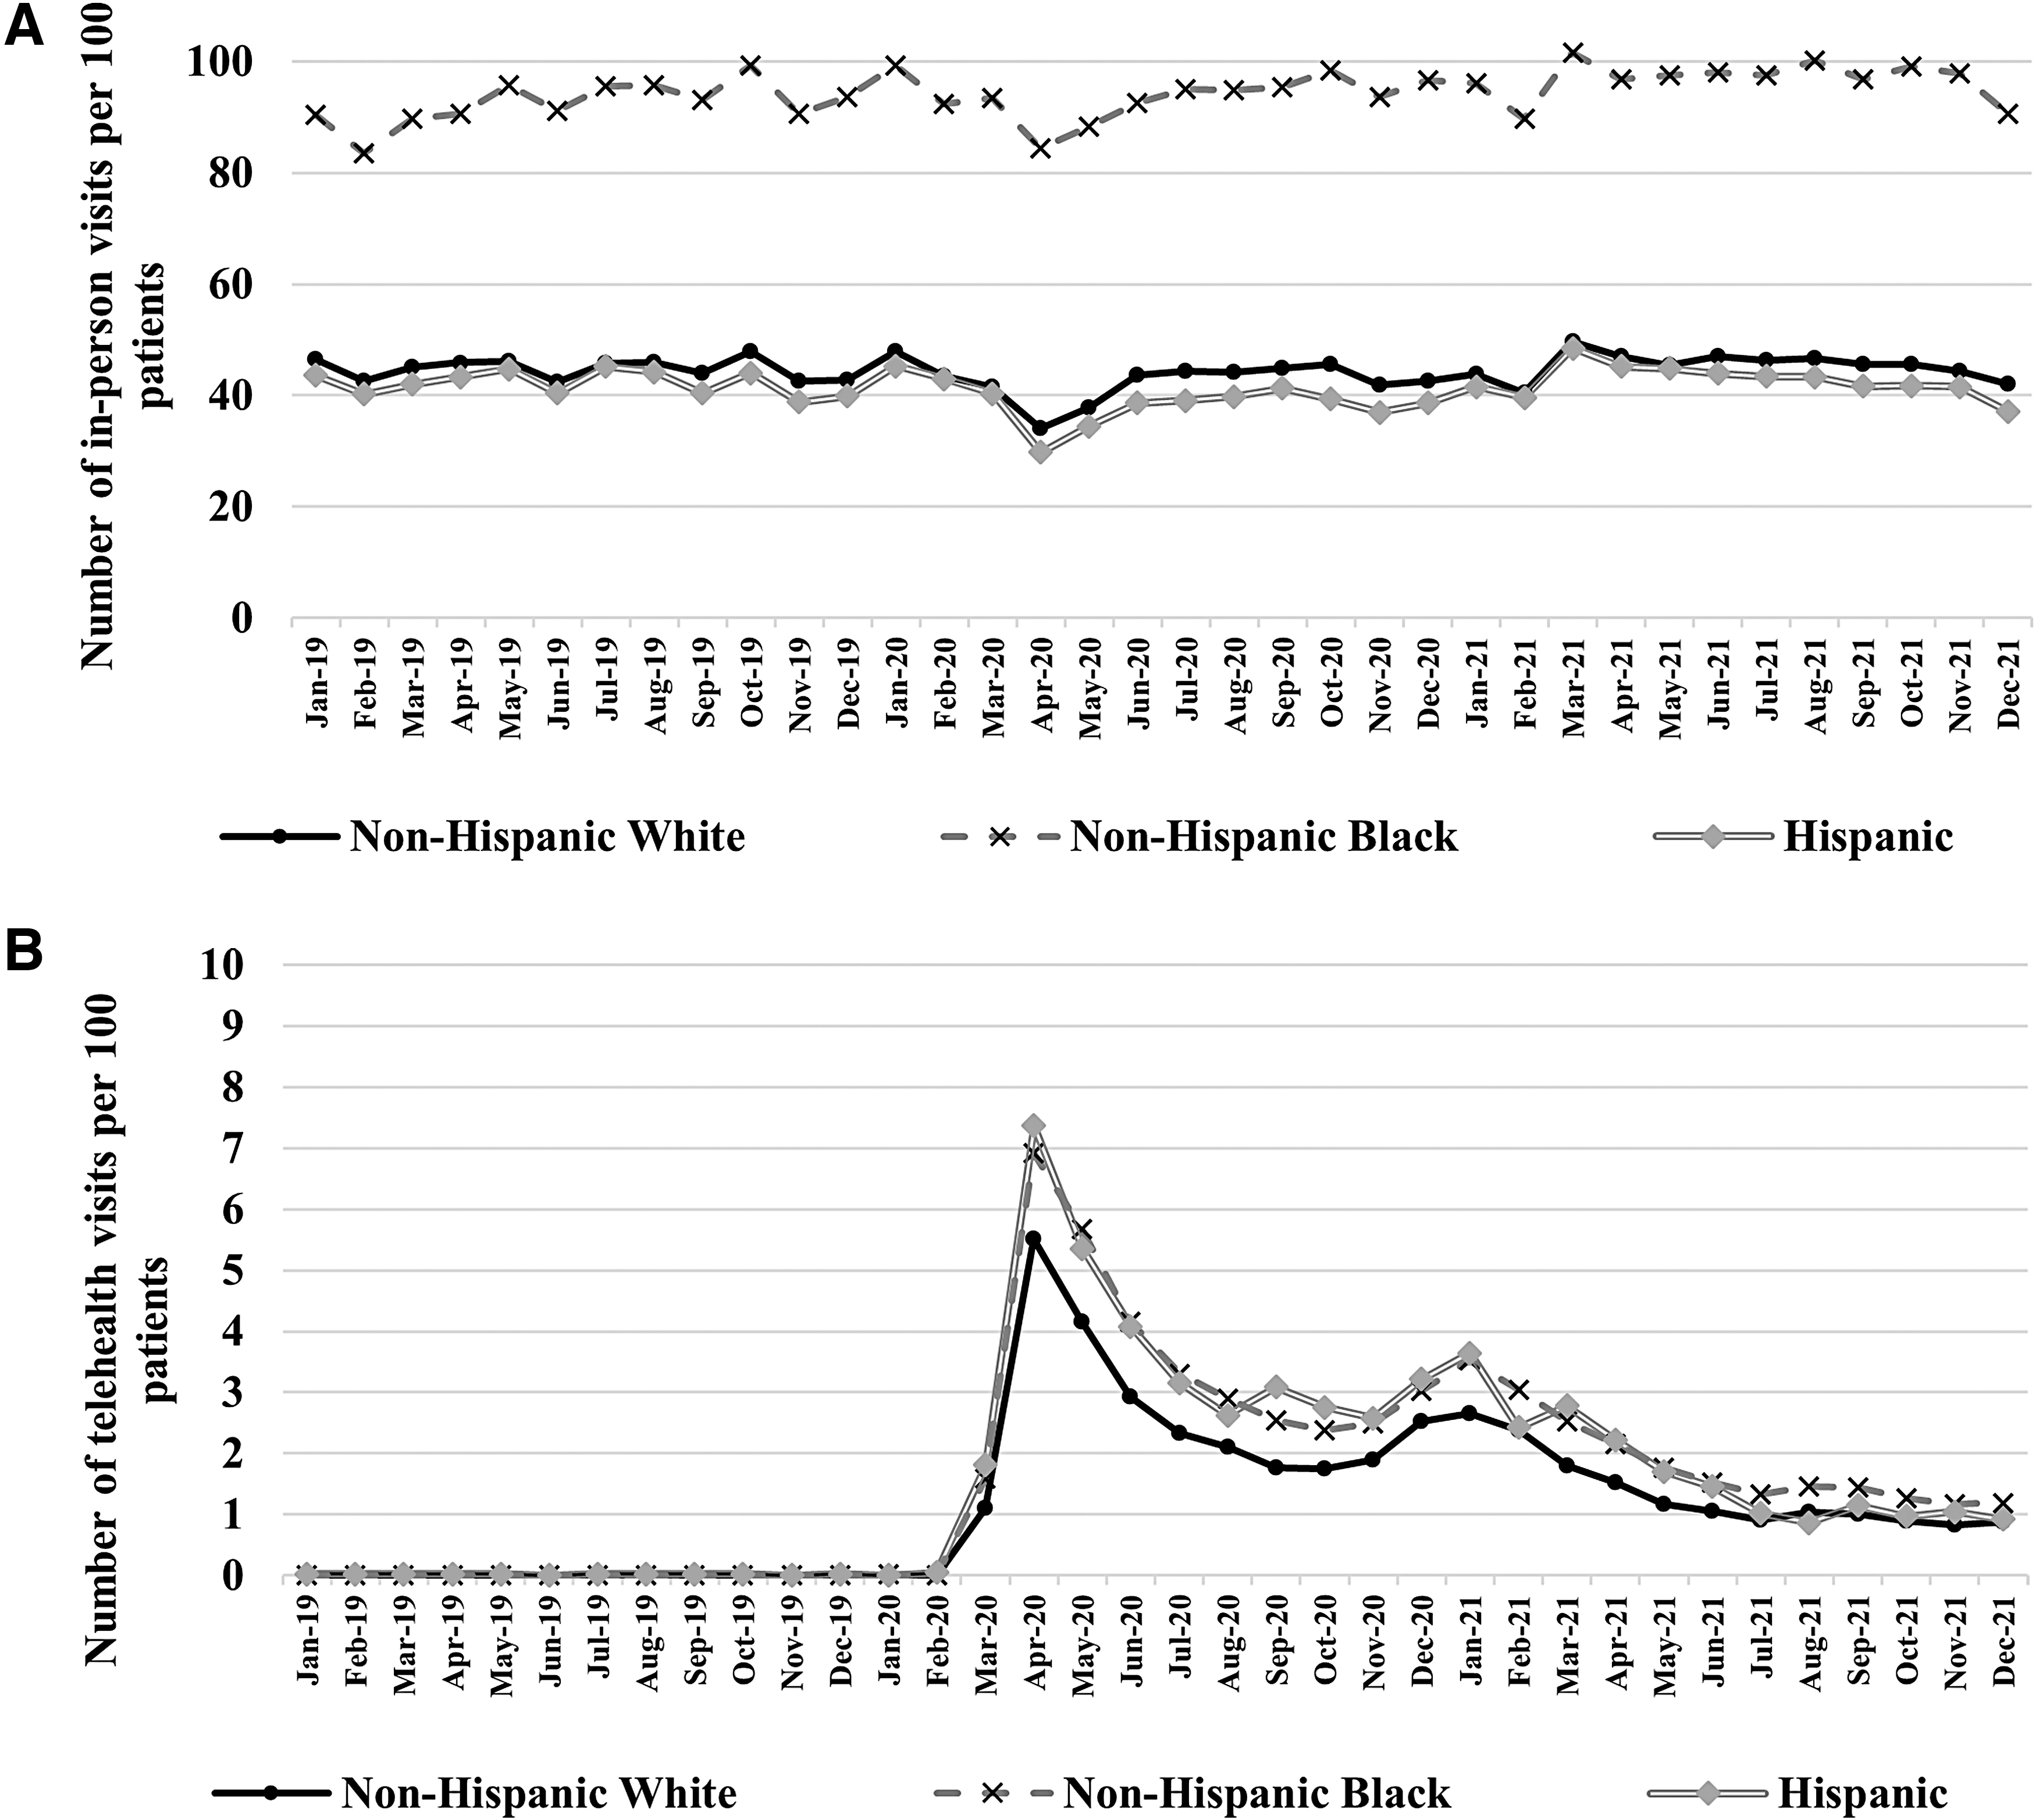
The numbers of hypertension-related telehealth and in-person outpatient visits per 100 persons by race and ethnicity, MarketScan Medicaid Database, 2019–2021.a
The numbers of hypertension-related telehealth visits were statistically significantly different across racial and ethnic groups during the COVID-19 period (Fig. 3B and Supplementary Table S3A). Compared with non-Hispanic White adults (1.92), non-Hispanic Black adults (2.61) had a higher monthly average of hypertension-related telehealth visits per 100 individuals (p < 0.001). For non-Hispanic White adults, the number of telehealth visits per 100 individuals was 0.01 in February 2020, increased to 5.51 in April 2020, and the monthly average from July 2020 to December 2021 was 1.58 (p < 0.001; Fig. 3; Supplementary Table S3A). For non-Hispanic Black adults, the number was 0.00 in February 2020, increased to 6.92 in April 2020, and the monthly average from July 2020 to December 2021 was 2.17.
For Hispanic individuals, the number was 0.05 in February 2020, increased to 7.36 in April 2020, and the monthly average from July 2020 to December 2021 was 2.09. The differences in telehealth use by race and ethnicity were all statistically significantly different (p < 0.001) each month from March 2020 to December 2021 (Supplementary Table S3A).
Proportion of hypertension-related telehealth outpatient visits
Figure 4 presents the proportion of hypertension-related telehealth outpatient visits out of all outpatient visits (both telehealth and in-person), overall, and by race and ethnicity. The monthly average proportion of telehealth visits from January 2019 to February 2020 was 0.01%. The proportion increased to 10.44% in April 2020, decreased to 5.22% in June 2020, and from July 2020 to December 2021 it was 2.76% (p < 0.001; Supplementary Table S3C).
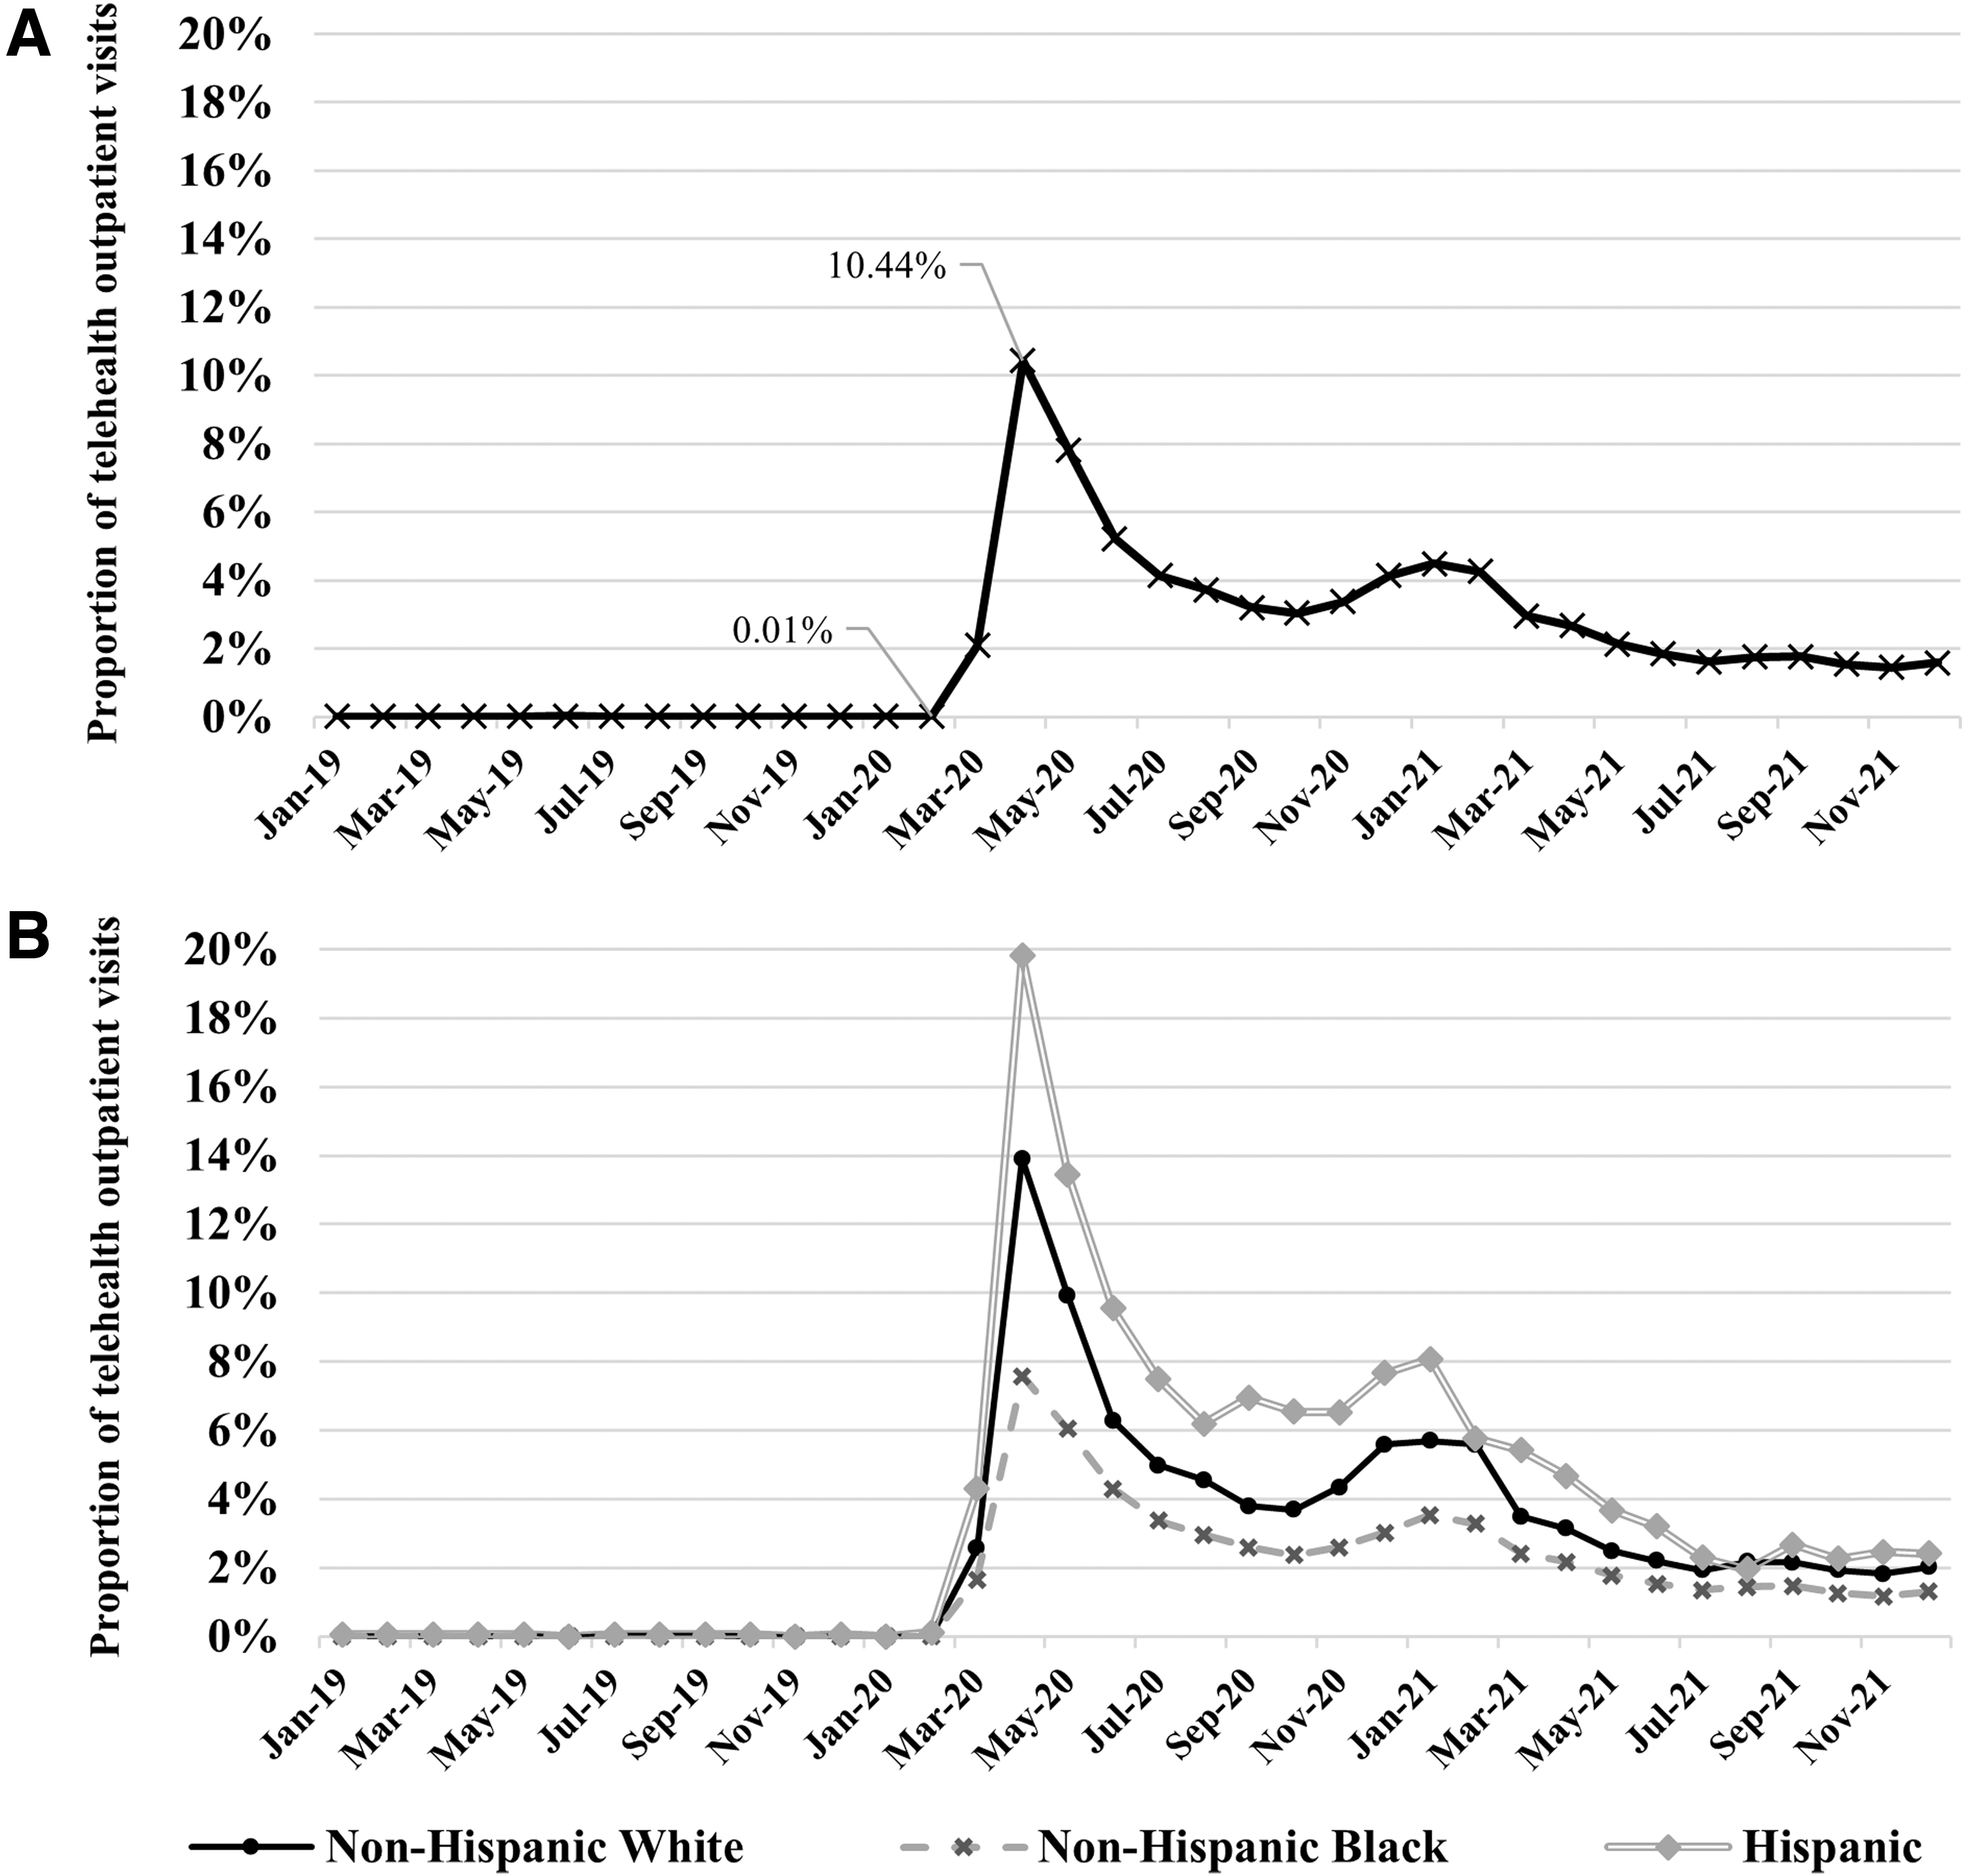
Proportion of hypertension-related telehealth outpatient visits overall
The proportions of telehealth to total outpatient visits were statistically significantly different among the racial and ethnic groups during March 2020−September 2021 (except February 2021) (Fig. 4; Supplementary Table S3C; p < 0.01). During the peak of telehealth use in April 2020, the proportions reached 19.82% for Hispanic, 13.90% for non-Hispanic White, and 7.58% for non-Hispanic Black adults. The monthly averages of the proportions from July 2020 to December 2021 were 4.79% for Hispanic, 3.42% for non-Hispanic White, and 2.20% for non-Hispanic Black adults.
Costs of telehealth and in-person outpatient visits
In the subsample analysis of individuals with noncapitated insurance in 2021 (n = 87,862; Fig. 1), the average total costs for hypertension-related telehealth and in-person visits were $83.82 (95% CI, 82.66–85.05) and $264.48 (95% CI, 258.87–269.51) per visit, respectively (Table 2). The patient's OOP costs for telehealth and in-person visits were $0.55 (95% CI, 0.42–0.68) and $0.72 (95% CI, 0.65–0.79) per visit, respectively.
Average Outpatient Visits and Costs for Hypertension-Related Telehealth and In-Person Outpatient Visits Among Individuals with Established Hypertension, MarketScan Medicaid Database, 2021 a
Hypertension-related outpatient visits include visits with a claim diagnosis of hypertension (ICD-10-CM = I10–I15). The sample size indicates the number of individuals in the respective groups who had telehealth and in-person outpatient visits in 2021. Total costs for in-person and telehealth were defined by the average cost per outpatient visit for in-person and telehealth visits in 2021, respectively. The share of patient OOP costs to total costs per visit was a ratio of patient OOP costs per visit and total costs per visit. The 95% CIs are the bias-corrected and accelerated bootstrap 95% CIs with 1,000 replications.
CI, confidence interval; ICD-10-CM; International Classification of Diseases, Tenth Revision, Clinical Modification; OOP, out-of-pocket.
The average cost of telehealth per visit was lower for Hispanic ($69.47, 95% CI, 60.07–80.52) than for non-Hispanic Black ($84.35, 95% CI, 82.49–86.29) and non-Hispanic White adults ($82.65, 95% CI, 80.28–84.59).
The average cost of in-person visits was higher for non-Hispanic White ($290.12, 95% CI, 280.49–300.16) than for non-Hispanic Black ($246.63, 95% CI, 239.63–253.74) and Hispanic adults ($246.32, 95% CI, 208.85–293.86).
Discussion
Using the administrative MarketScan Medicaid claim database, we documented the trends and costs of hypertension-related telehealth and in-person outpatient visits among adults with hypertension before and during the COVID-19 pandemic by race and ethnicity. Hypertension-related telehealth use among those with hypertension grew during this period and remained elevated in 2021 compared with the pre-COVID-19 pandemic period. There is a breadth of research addressing the potential benefits of telehealth use in the reduction of health disparities; however, there are concerns regarding the digital divide or “the uneven distribution of information and communication technologies in society” based on access and usage. 27 –29 Our own findings highlight how telehealth and in-person utilization increased among all racial and ethnic groups yet disparities remained.
Hispanic adults with hypertension had both the lowest cost per telehealth visit and the highest proportion of hypertension-related telehealth visits. Prior research has reported that Hispanic adults had the lowest self-reported telemedicine use 30 among all racial and ethnic groups. Furthermore, in a study of unique telehealth visits, Hispanic adults had the lowest likelihood of telehealth use 31 compared with non-Hispanic Black and non-Hispanic White adults. These prior studies did not specifically examine individuals using Medicaid, which may have contributed to the difference in our findings.
Another difference with prior studies is that our results found that Hispanic adults had a higher proportion of telehealth visits compared with other racial and ethnic groups even before the COVID-19 pandemic. This could explain the rapid rate of adoption of telehealth among Hispanic adults with hypertension when this option became widely available.
Expanding telehealth use could potentially reduce existing disparities related to hypertension. For example, Hispanic individuals have lower levels of hypertension awareness 32 and treatment 33 compared with non-Hispanic White and non-Hispanic Black adults. Telehealth offers an opportunity to address this through evidence-based practices like self-measured blood pressure monitoring, 34 increased language concordance with a clinician, 32 and culturally adapted lifestyle interventions. Telehealth visits for routine and preventive care, health and lifestyle education, and patient monitoring are relatively low cost compared with in-person care. 33 Such visits, in turn, can lower cost of care, despite increased utilization. The concern regarding the digital divide remains, although increased access to device ownership and broadband access, and related education can support bridging of the digital divide by improving ease of use of evidence-based practices (e.g., patient monitoring and self-measured blood pressure). 29
Non-Hispanic Black adults had the lowest proportion of hypertension-related telehealth outpatient visits (driven mainly by the higher number of in-person outpatient visits in the denominator). Previous results are mixed regarding use of telehealth services among non-Hispanic Black individuals. For example, Fischer et al. 35 found that Black individuals were less willing and less likely to use videoconferencing during February–April 2019. In contrast, White-Williams et al. 31 found that non-Hispanic Black individuals were significantly more likely to use telehealth visits compared with non-Hispanic White and Hispanic individuals. Roghani and Panahi 36 similarly found that Black respondents were more likely to use telemedicine compared with other racial and ethnic groups. The differences in the findings may be owing to (1) different time periods (e.g., Fischer et al. 35 focused on pre-COVID-19 pandemic periods), (2) different insurance types (e.g., White-Williams et al. 31 included persons with both commercial and public insurance, whereas we focused on Medicaid), and (3) different measures of telehealth (e.g., Roghani and Panahi 36 measured if providers offered telehealth before or during the COVID-19 pandemic and if participants scheduled telehealth appointments in a survey, whereas we identified the number of hypertension-related telehealth visits in administrative claims database). In addition, prior studies documented any telehealth use, whereas our study focused on hypertension-related telehealth outpatient visits. Our study demonstrated that, among those with hypertension, non-Hispanic Black adults increased their proportion of telehealth visits, but to a lesser extent than non-Hispanic White and Hispanic adults. Future research may explore the underlying mechanisms and reasons for the differences in costs per telehealth visit and telehealth utilization by racial and ethnic groups.
Non-Hispanic Black adults had the most hypertension-related in-person outpatient visits throughout our study periods. Black individuals, especially those of a lower socioeconomic status, may require complex hypertension management 33,37 for more aggressive forms of hypertension 33 compared with other racial and ethnic groups. Black persons have the lowest rates of hypertension control among any racial or ethnic group, despite higher rates of hypertension awareness and treatment compared with Hispanic adults. 1 Hypertension management can include complementary use of telehealth and in-person strategies, 38 which can improve access to complex specialty care 38 –40 and multidisciplinary collaboration. 38
Studies examining the U.S. Medicaid population provide valuable information on the role of telehealth and Medicaid in increasing access to care for low-income adults—because Medicaid-insured adults are more likely to be of lower Socioeconomic status (SES) compared with privately insured adults. 41 Medicaid populations have much lower OOP costs compared with the privately insured, 22,42 and lower OOP costs are likely to be associated with higher utilization of care. 43 The combination of (1) Medicaid enabling low OOP costs and (2) telehealth reducing logistical barriers to care may facilitate improved hypertension management and reduce health disparities in hypertension awareness, treatment, and control.
This study is subject to limitations. First, the MarketScan Medicaid database contains data from only five to eight states in recent years—thus our results may not be generalizable to the entire U.S. Medicaid population and may suffer from regionalization. Second, this study included only individuals who were continuously enrolled in Medicaid and failed to capture those who dropped out of Medicaid or joined Medicaid during the pandemic. Third, the sample size of the Hispanic population was much smaller than that of non-Hispanic White and non-Hispanic Black populations, which could lead to a greater margin for error. Fourth, this study was focused only on Medicaid recipients, and the findings cannot be generalized to other publicly and privately insured adults with hypertension. Fifth, owing to the use of claims data, there is a potential risk for reporting errors because of telehealth coding discrepancies. 44
Conclusions
Hypertension management via telehealth outpatient services increased during the COVID-19 pandemic among Medicaid recipients regardless of race and ethnicity compared with the pre-COVID-19 pandemic period. Hispanic adults had the highest proportion of hypertension-related telehealth visits of any racial and ethnic group, whereas non-Hispanic Black adults had the highest total number of telehealth and in-person outpatient visits. The growth and sustained elevated rates of telehealth use may indicate both increased availability and reimbursement as well as acceptance of telehealth for hypertension management. Research that further examines the factors fueling disparities in telehealth use and cost—while contextualizing the role of race and ethnicity—may help reduce disparities, improve access to care, and support hypertension management.
Footnotes
Acknowledgment
The authors sincerely thank Michael Schooley, Fátima Coronado, Adam Vaughan, and Janet Wright (Centers for Disease Control and Prevention) for their guidance, suggestions, and article review.
Authors' Contributions
J.S.L.: Conceptualization, data curation, formal analysis, investigation, methodology, project administration, resources, software, validation, visualization, writing—original draft, writing—review and editing. A.B.: Conceptualization, methodology, investigation, writing—original draft, writing—review and editing. L.M.P.: Conceptualization, methodology, validation, writing—review and editing. S.L.J.: Conceptualization, supervision, validation, writing—review and editing. N.O.: Conceptualization, investigation, writing—original draft. K.L.B.: Conceptualization, investigation, writing—original draft. C.W.: Conceptualization, investigation, writing—original draft. F.L.: Supervision, conceptualization, formal analysis, validation, visualization, writing—review and editing. K.R.: Supervision, conceptualization, formal analysis, validation, visualization, writing—review and editing.
Disclaimer
The findings and conclusions in this article are those of the authors and do not necessarily represent the official position of the Centers for Disease Control and Prevention. Use of trade names and commercial sources is for identification only and does not imply endorsement by the U.S. Department of Health and Human Services.
Disclosure Statement
No competing financial interests exist.
Funding Information
No funding was received for this article.
Supplementary Material
Supplementary Table S1
Supplementary Table S2
Supplementary Table S3
References
Supplementary Material
Please find the following supplemental material available below.
For Open Access articles published under a Creative Commons License, all supplemental material carries the same license as the article it is associated with.
For non-Open Access articles published, all supplemental material carries a non-exclusive license, and permission requests for re-use of supplemental material or any part of supplemental material shall be sent directly to the copyright owner as specified in the copyright notice associated with the article.
