




Abstract
Introduction:
In 2021, we introduced a program to promote the use of teledermatology among pediatricians. In the present study, we created and validated a satisfaction questionnaire to assess pediatricians’ perceptions of teledermatology. We used this questionnaire to evaluate the efficacy of the program.
Methods:
First, a provisional questionnaire, based on questionnaires available in the literature, was drafted. A group of experts evaluated the clarity, coherence, relevance and sufficiency of the questions, and we calculated a content validity index (CVI). Only questions with a CVI above 0.78 were acceptable. Based on these results and on the experts’ comments, we revised the questionnaire and then sent it to a population of pediatricians. We used their responses to validate the revised questionnaire using statistical methods. A Cronbach’s alpha above 0.7 indicated adequate internal consistency, and an intraclass correlation coefficient above 0.75 indicated adequate reproducibility. We used the Varimax method to measure construct validity.
Results:
We clarified and reformulated some questions from the provisional questionnaire based on the experts’ comments. All questions had a CVI above 0.78, so no other changes were needed. Although the statistical validation showed suboptimal construct validity, the revised questionnaire had good internal consistency and reliability, and high content validity index.
Discussion:
The validated questionnaire is a robust tool for assessing pediatricians’ satisfaction with teledermatology.
Introduction
Teledermatology enables dermatologists to evaluate images of skin lesions remotely. 1 In the field of pediatrics, skin problems account for 30% of primary care visits, 2 but children can wait up to 4 or even 6 months to see a dermatologist due to high care demand. 3 Promoting teledermatology could help to reduce wait lists, ease the care burden of emergency departments, and improve interprofessional communication.
In asynchronous teledermatology, dermatologists evaluate stored images and clinical data of each patient to establish a diagnosis and therapeutic plan. This modality provides children with rapid access to high-quality dermatological care 4 and enables remote management of 63% of skin lesions with no need for an in-person visit. 5 Pediatric dermatologists favor the use of teledermatology in their routine practice. 6 In a 2015 study by Forgel et al., 56% of dermatologists considered teledermatology an important component of dermatological consultations. 7 In general, these professionals are satisfied with teledermatology. 8
In 2009, Alicante General University Hospital (HGUA) developed an asynchronous teledermatology platform with its own resources. Through this system, dermatologists could manage cases via telemedicine or schedule and prioritize in-person visits or surgical treatment as needed, depending on the individual condition. HGUA expanded access to the platform to all primary care pediatricians (PCPs) in 2015 and has continued to develop the system over the years, facilitating communication between PCPs and specialists.
In 2020, another research team at the HGUA analyzed the use of teledermatology by pediatricians and found that only 10% of consultations had taken place through the system, which suggested it was being underused. We decided to intervene to optimize the use of teledermatology, establishing a series of actions to improve the availability and infrastructure of the service, as well as a personalized training program for pediatric professionals who had access to the tool. To determine the effectiveness of this intervention, it was necessary to evaluate the tool.
Evaluations of teledermatology systems should cover user satisfaction, educational capacity, and economic impact. 9 Few published studies have evaluated user satisfaction with teledermatology, and the questionnaires used in these studies have important methodological limitations. For this reason, we developed and validated a questionnaire for evaluating the experience of professionals in the HGUA with teledermatology, based on existing questionnaires in the literature. 10
Methods
We created and validated a questionnaire aimed at the 45 PCPs who have access to teledermatology in the 12 public health care centers within the HGUA catchment area. The aim of the questionnaire was to evaluate PCPs’ experience and satisfaction with the tool. With the results, we can evaluate the impact of the intervention implemented in 2021.
The validation process was granted ethics committee approval. We established a target population comprising all pediatricians in the province of Alicante and the Region of Murcia. This population has similar working conditions to the professionals who will receive the final questionnaire. We calculated the sample size following the rule of 5–10 individuals per questionnaire item, with the aim of collecting at least 200 to 300 responses for validation. 11
Our study involved the following steps: Development of a provisional questionnaire: Two dermatologists and one PCP adapted questionnaires published in the literature to our population. The provisional version of our questionnaire comprised 15 questions with Likert response options, grouped into four dimensions, as well as questions about the respondent’s sex, age, position, professional category, and the use of teledermatology. We designed the questionnaire to be self-administered through Google Forms. Revision of the questionnaire: After a group of survey experts had evaluated the provisional version, we made all necessary changes to produce a revised version according to their opinions. After that, the expert evaluated this revised version of the questionnaire for clarity, coherence, and relevance of each question, according to the definitions established in Table 1. They also evaluated whether each dimension had sufficient questions. We used a template to ensure consistency (Table 2). Each item received a score from 1 to 4, and there was a space for additional comments. To decide whether a question was suitable for the questionnaire, we used the content validity index for each item (I-CVI), referred to as clarity, coherence, relevance, and sufficiency, defined as the ratio between the number of experts that provided a score of 3 or more to that item, divided by the total number of participating experts. For a question to be included in the final questionnaire, the I-CVI for every condition had to be greater than 0.78. We also calculated the CVI for the whole questionnaire (S-CVI), defined as the mean value of every I-CVI calculated. To ensure adequate content validity, S-CVI had to be greater than 0.9.
12
Validation of the questionnaire: after revising the questionnaire and proving every item had an I-CVI greater than 0.78, we sent it to the target population (on two occasions, in March and April 2021, to guarantee reproducibility) and performed a statistical analysis of the responses. Two weeks after sending the questionnaires, we sent a reminder to all potential respondents to increase the response rate.
Definition of Clarity, Coherence, Relevance, and Sufficiency for the Questionnaire Evaluation
Template for the Expert Evaluation of the Provisional Questionnaire
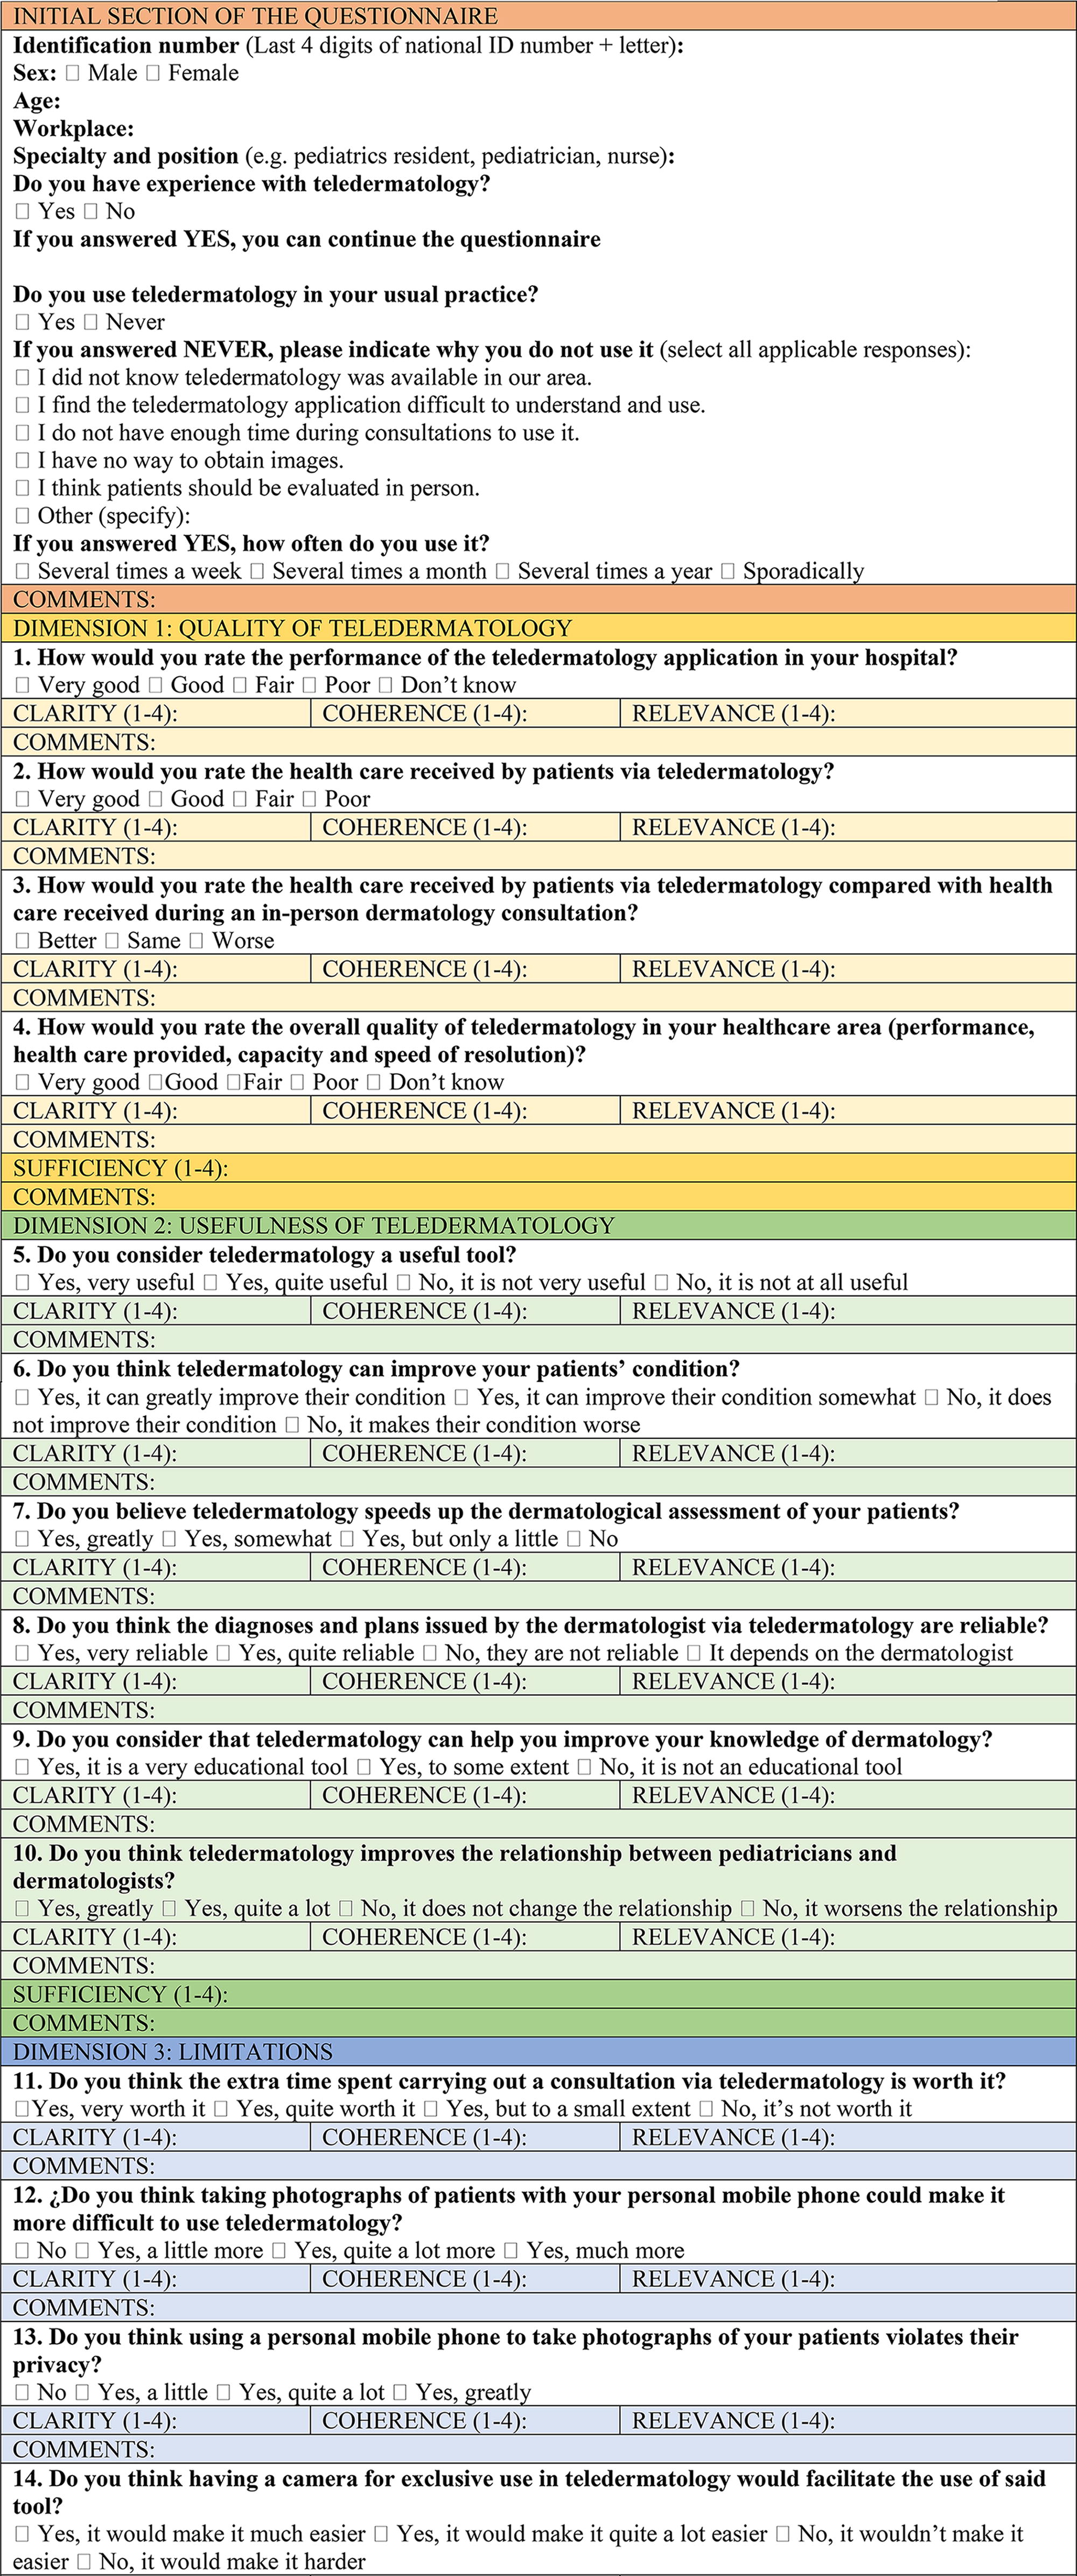
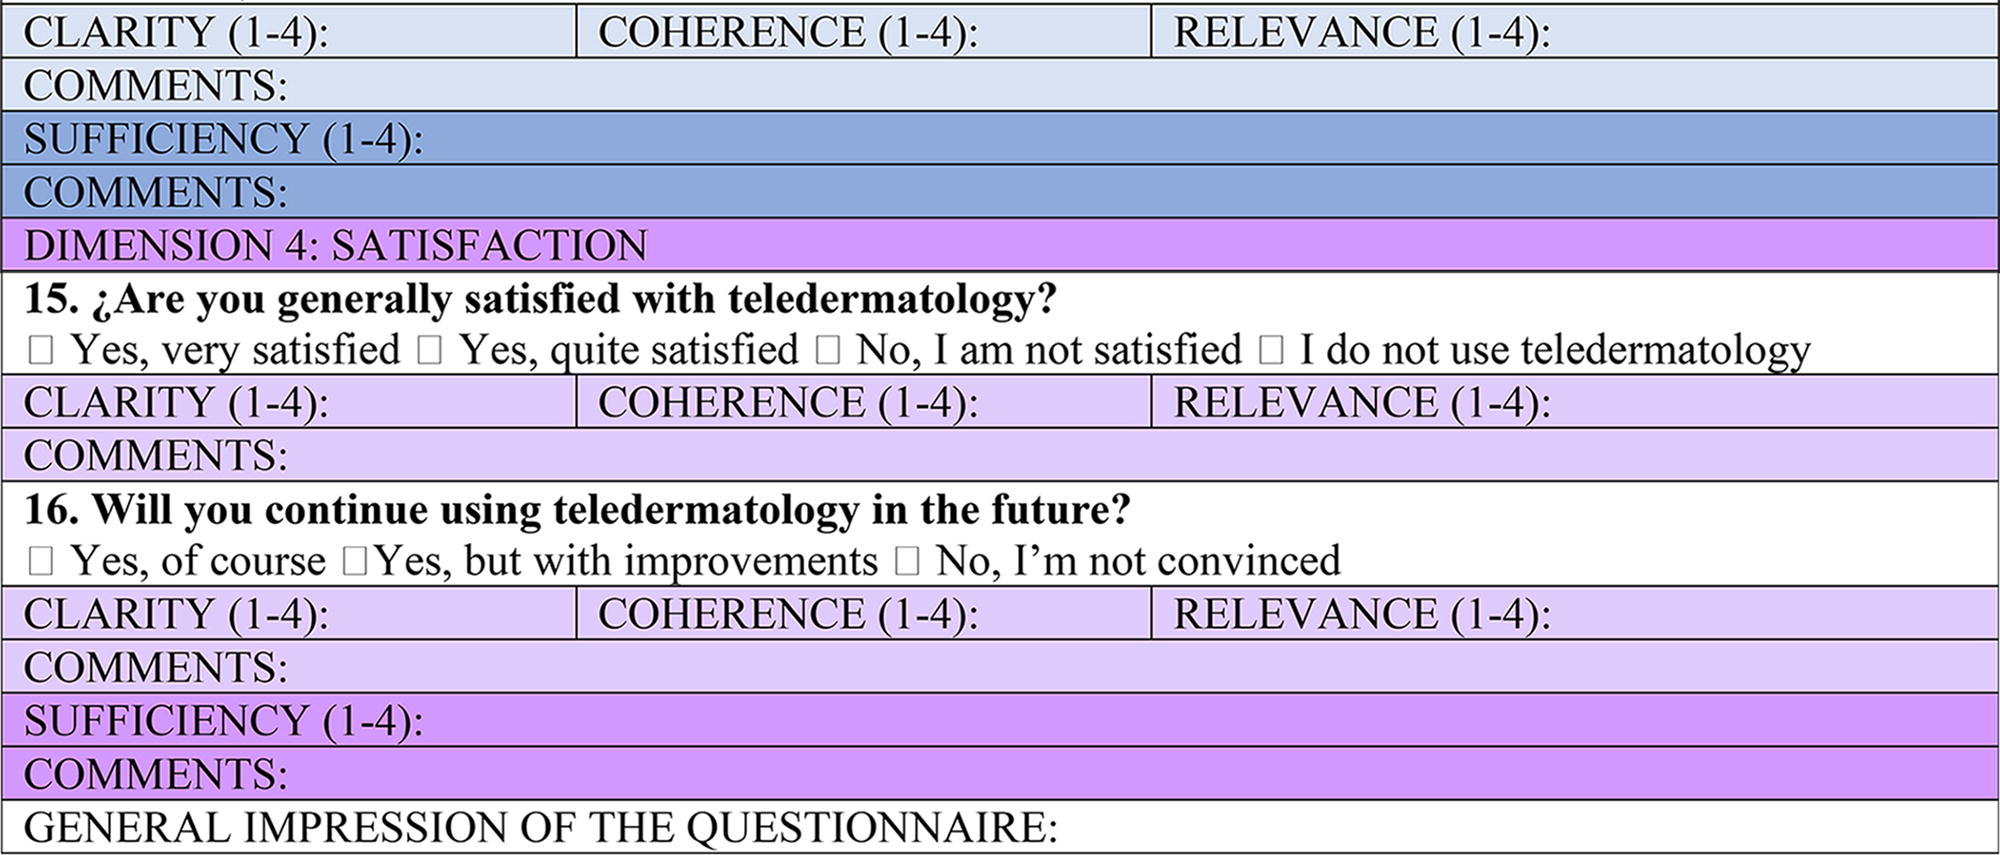
We collected the data in an Excel spreadsheet using Google Forms, and we used SPSS 21.0.0.0 to analyze the data. The statistical analysis included the following measures: Internal consistency of each item in the same dimension. We calculated Cronbach’s alpha coefficient; items that scored over 0.7 were considered adequate. Reproducibility of the questionnaire, or temporal stability in the responses to questionnaires sent at different times (March and April 2021). We considered that after 1 month, respondents were likely to have forgotten their responses, but significant changes that could alter the responses (e.g., pediatric staff changes) were unlikely to have occurred. For this measure, we calculated the intraclass correlation coefficient, considering a value greater than 0.75 indicative of adequate reproducibility. Construct validity, which required a statistically significant Bartlett test (p < 0.05) and a Kaiser-Meyer-Olkin (KMO) index greater than 0.7. After confirming that these requirements were met, we performed a principal component analysis to study the shared and common variance of each variable and a factorial analysis, following the Varimax method and creating a rotated component matrix. The criterion for including an item in each domain of our questionnaire was a factor greater than 0.5. In this way, we determined whether the domains of our questionnaire (and their components) coincided with the components and domains detected in the factorial analysis.
After conducting the statistical analysis and making the necessary modifications to the revised questionnaire, we created the final validated questionnaire for professionals.
Results
EVALUATION AND REVISION OF THE PROVISIONAL QUESTIONNAIRE
Twenty experts evaluated the provisional questionnaire. Based on the experts’ comments, we modified the wording and response options of some questions to improve comprehensibility and thus elicit more reliable responses. We also made the following changes. We added a question about knowledge of teledermatology to the initial demographic data section to filter out people who had insufficient knowledge to provide valid responses. We added a question about the role of teledermatology in reducing wait times: “Do you believe teledermatology speeds up the dermatological assessment of your patients?” (Question 7 of the revised questionnaire). We detected two questions related to problems with using teledermatology during consultations that transmitted a similar idea (questions 10 and 11 of the provisional questionnaire); we combined them into a single question (question 11 of the revised questionnaire). We split question 12 (“Are you uncomfortable with having to use your personal mobile phone to take photographs of your patient?”) into two questions (12 and 13 of the revised questionnaire). We created a new final open question where respondents could indicate areas of improvement in teledermatology.
Table 3 compares the provisional and revised versions of the questionnaire.
Comparison Between the Provisional Questionnaire and the Revised Version Submitted for Validation (Green: new Question; Orange: merged Questions)
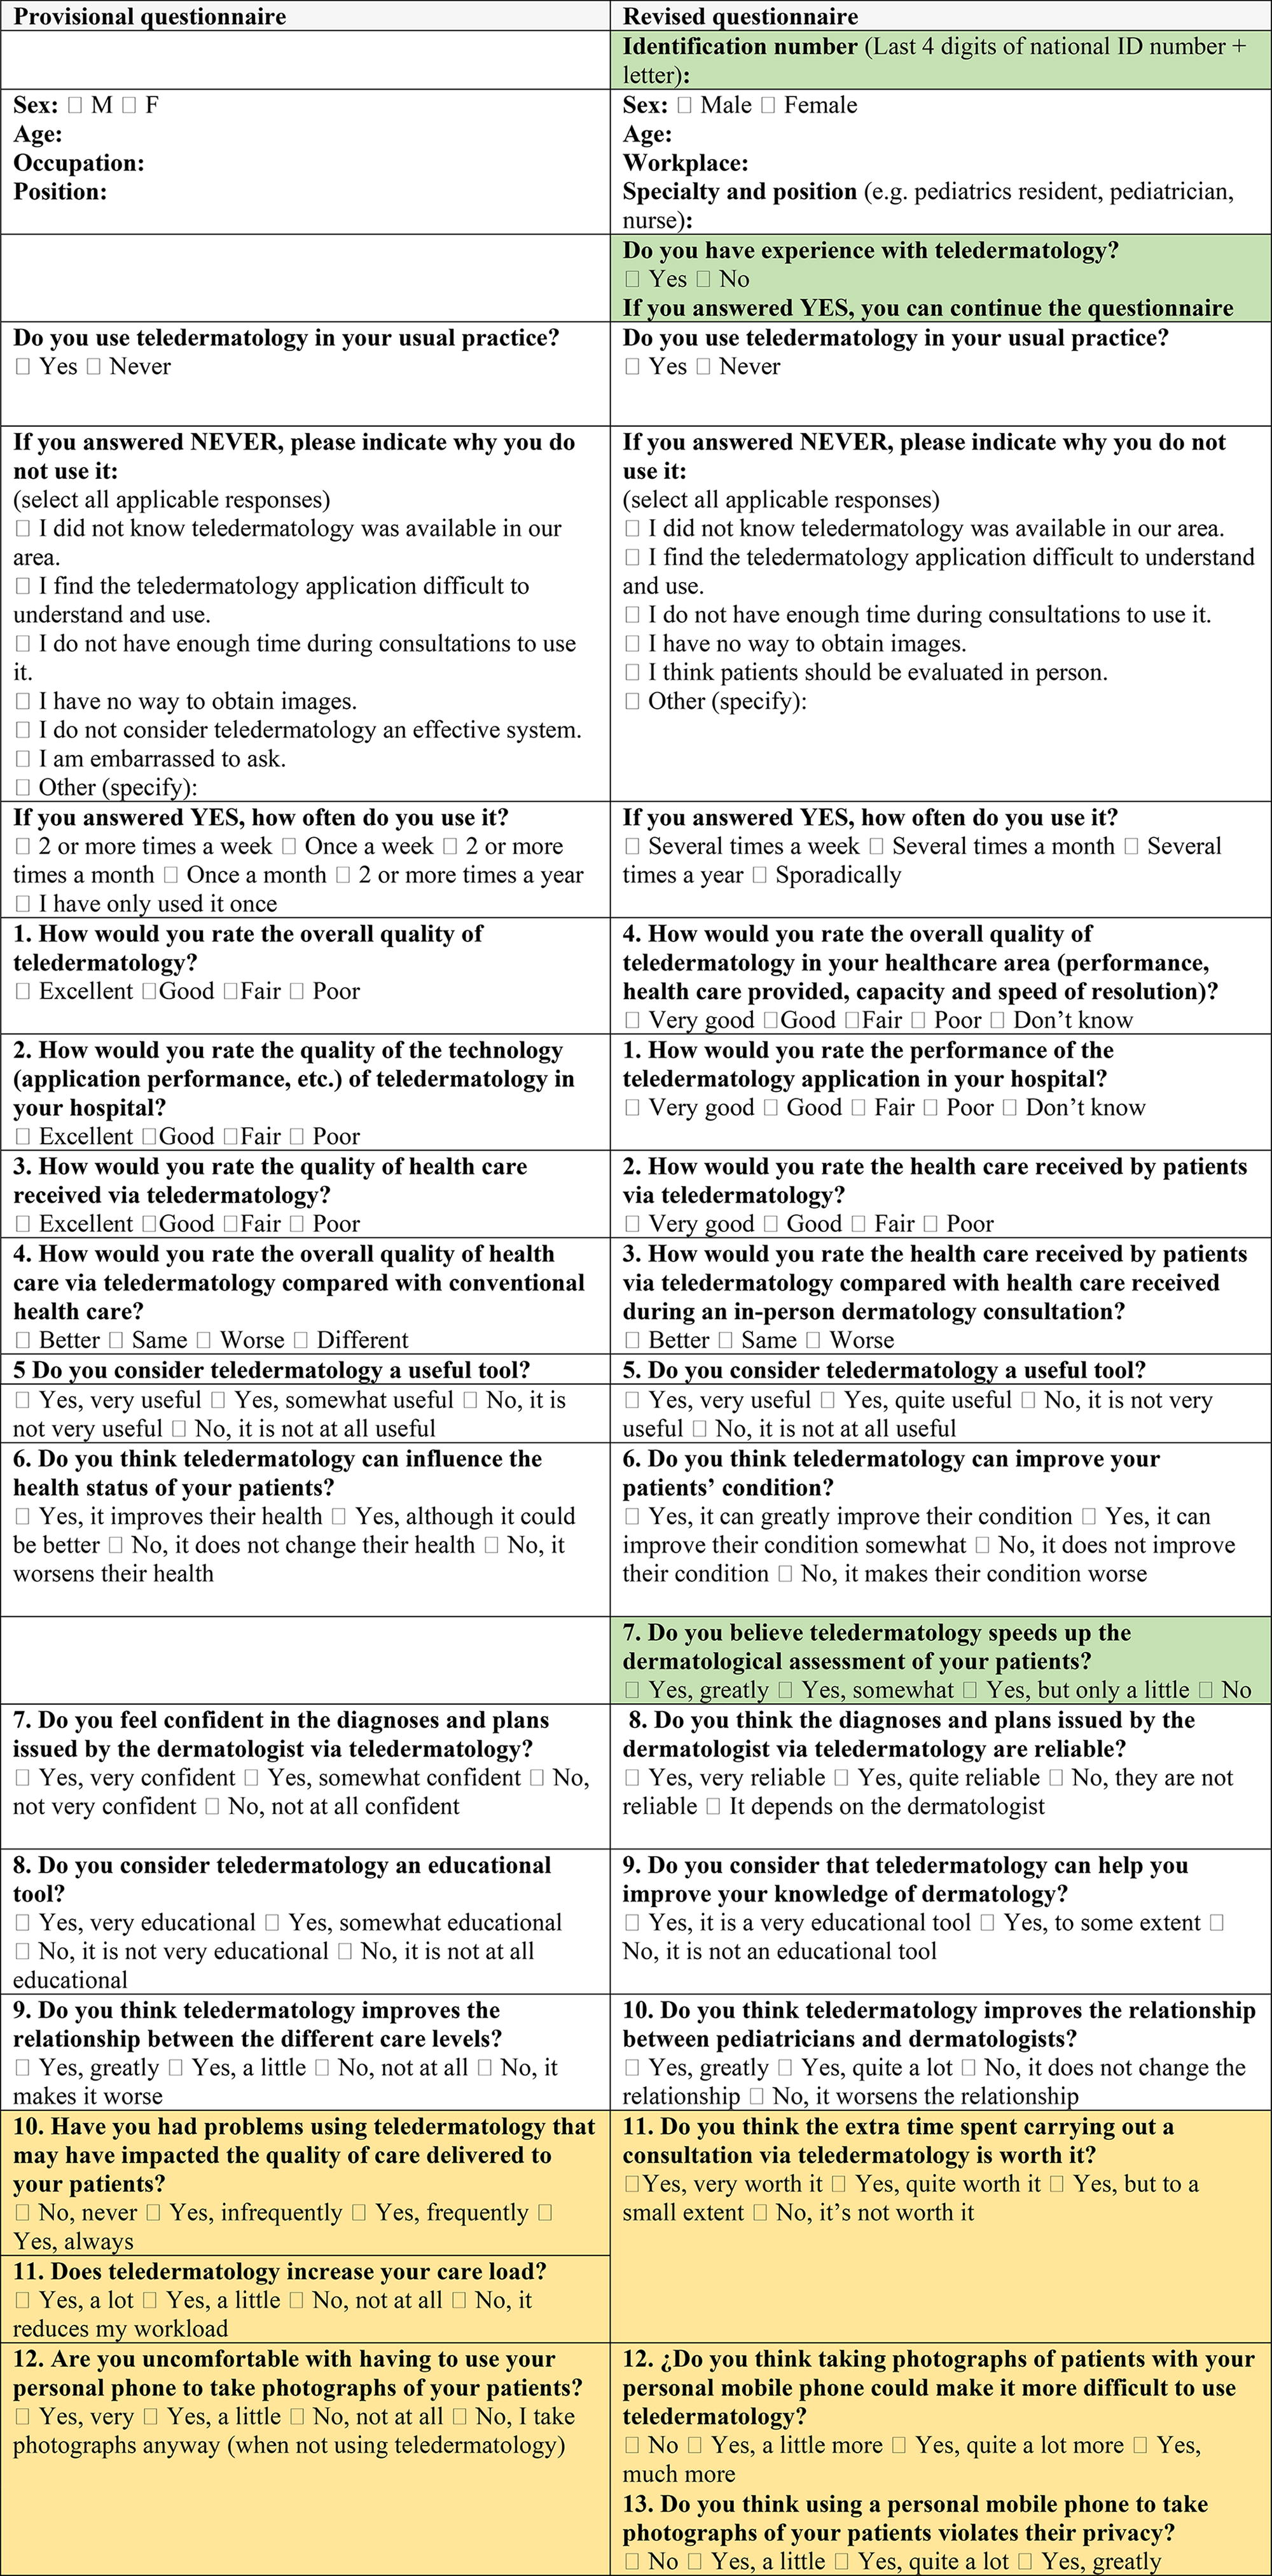
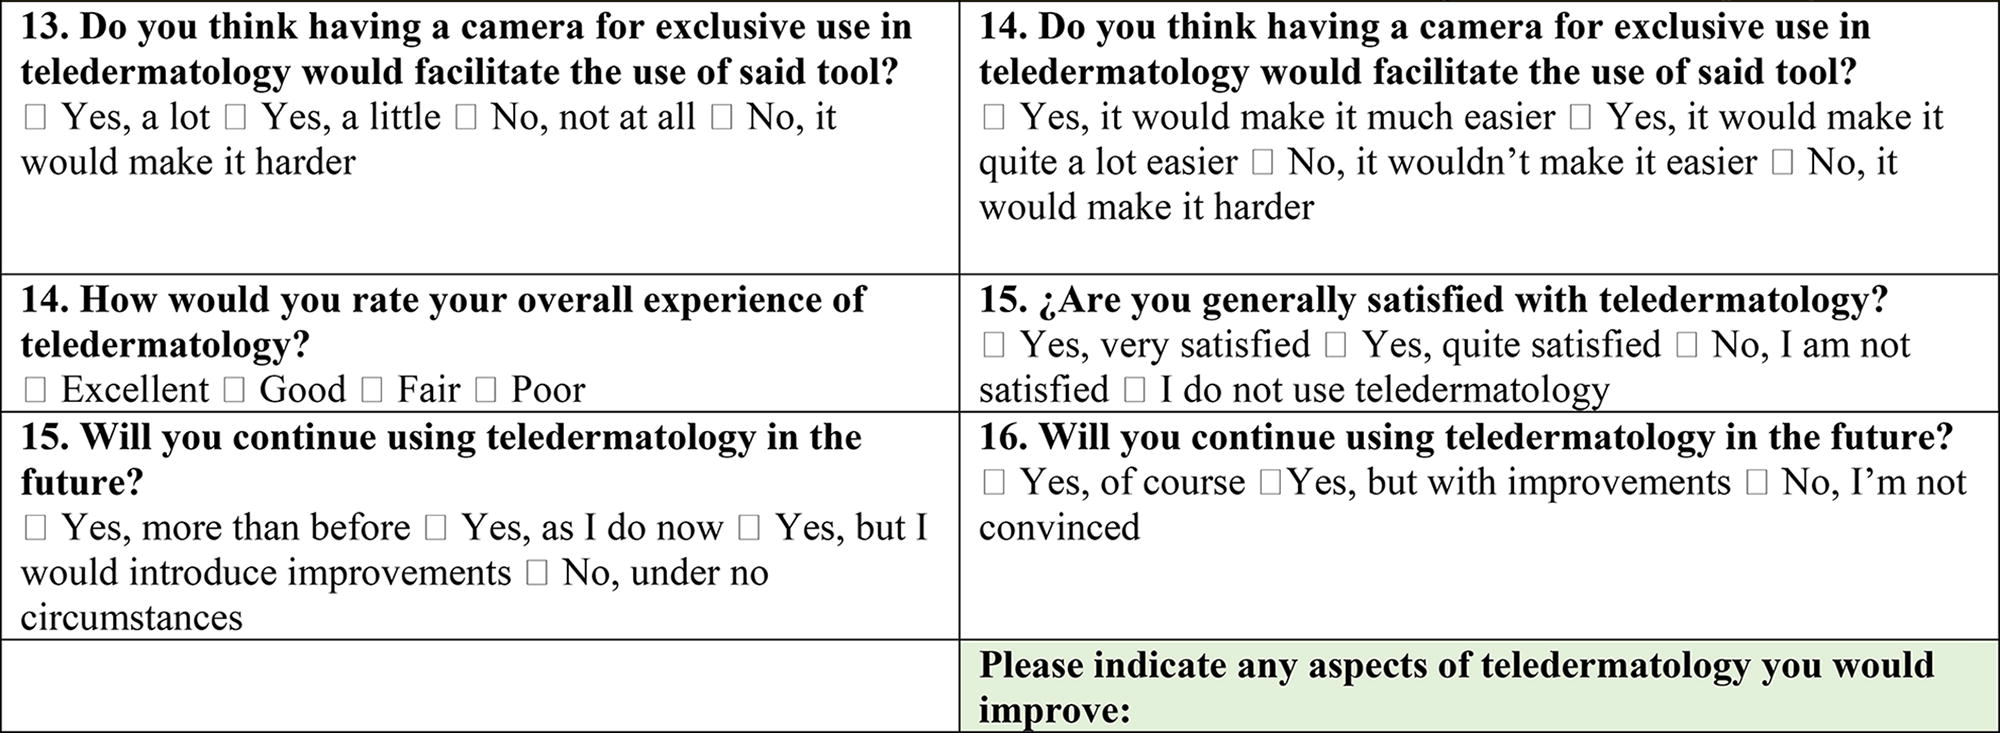
We then calculated the CVI for each question (I-CVI) and for the whole questionnaire (Table 4). All questions had an I-CVI greater than 0.78 for clarity, coherence, relevance, and sufficiency, and an S-CVI greater than 0.9 for those attributes.
I-IVC Values of the Experts’ Scores for Clarity, Coherence, Relevance, and Sufficiency of the Questions in the Questionnaire
STATISTICAL VALIDATION OF THE REVISED QUESTIONNAIRE
We sent the revised questionnaire to our target population (Table 3), and 95 PCPs responded. All the responses were included in the validation process. The analysis of internal consistency showed a Cronbach’s alpha greater than 0.7 in the domains of “Quality” (0.765) and “Utility” (0.832). However, the index was 0.522 for “Limitations” and 0.672 for “Satisfaction”. Removing question 13 of the provisional version (“Do you believe that having a camera for the exclusive use of teledermatology would facilitate the use of said tool?”) increased the index for “Limitations” to 0.709. Cronbach’s alpha for the whole questionnaire was 0.890, or 0.911 without question 13 (Table 5).
Validation of Internal Consistency: Cronbach’s Alpha Coefficients
Bold values in Table 5 correspond with Cronbach’s alpha coefficients over 0,7.
We measured the reproducibility or reliability of the questionnaire by sending it out a second time. We received 34 completed questionnaires. The intraclass correlation coefficient was 0.875 (95% confidence interval 0.753–0.939), confirming the temporal stability of the responses (Fig. 1).
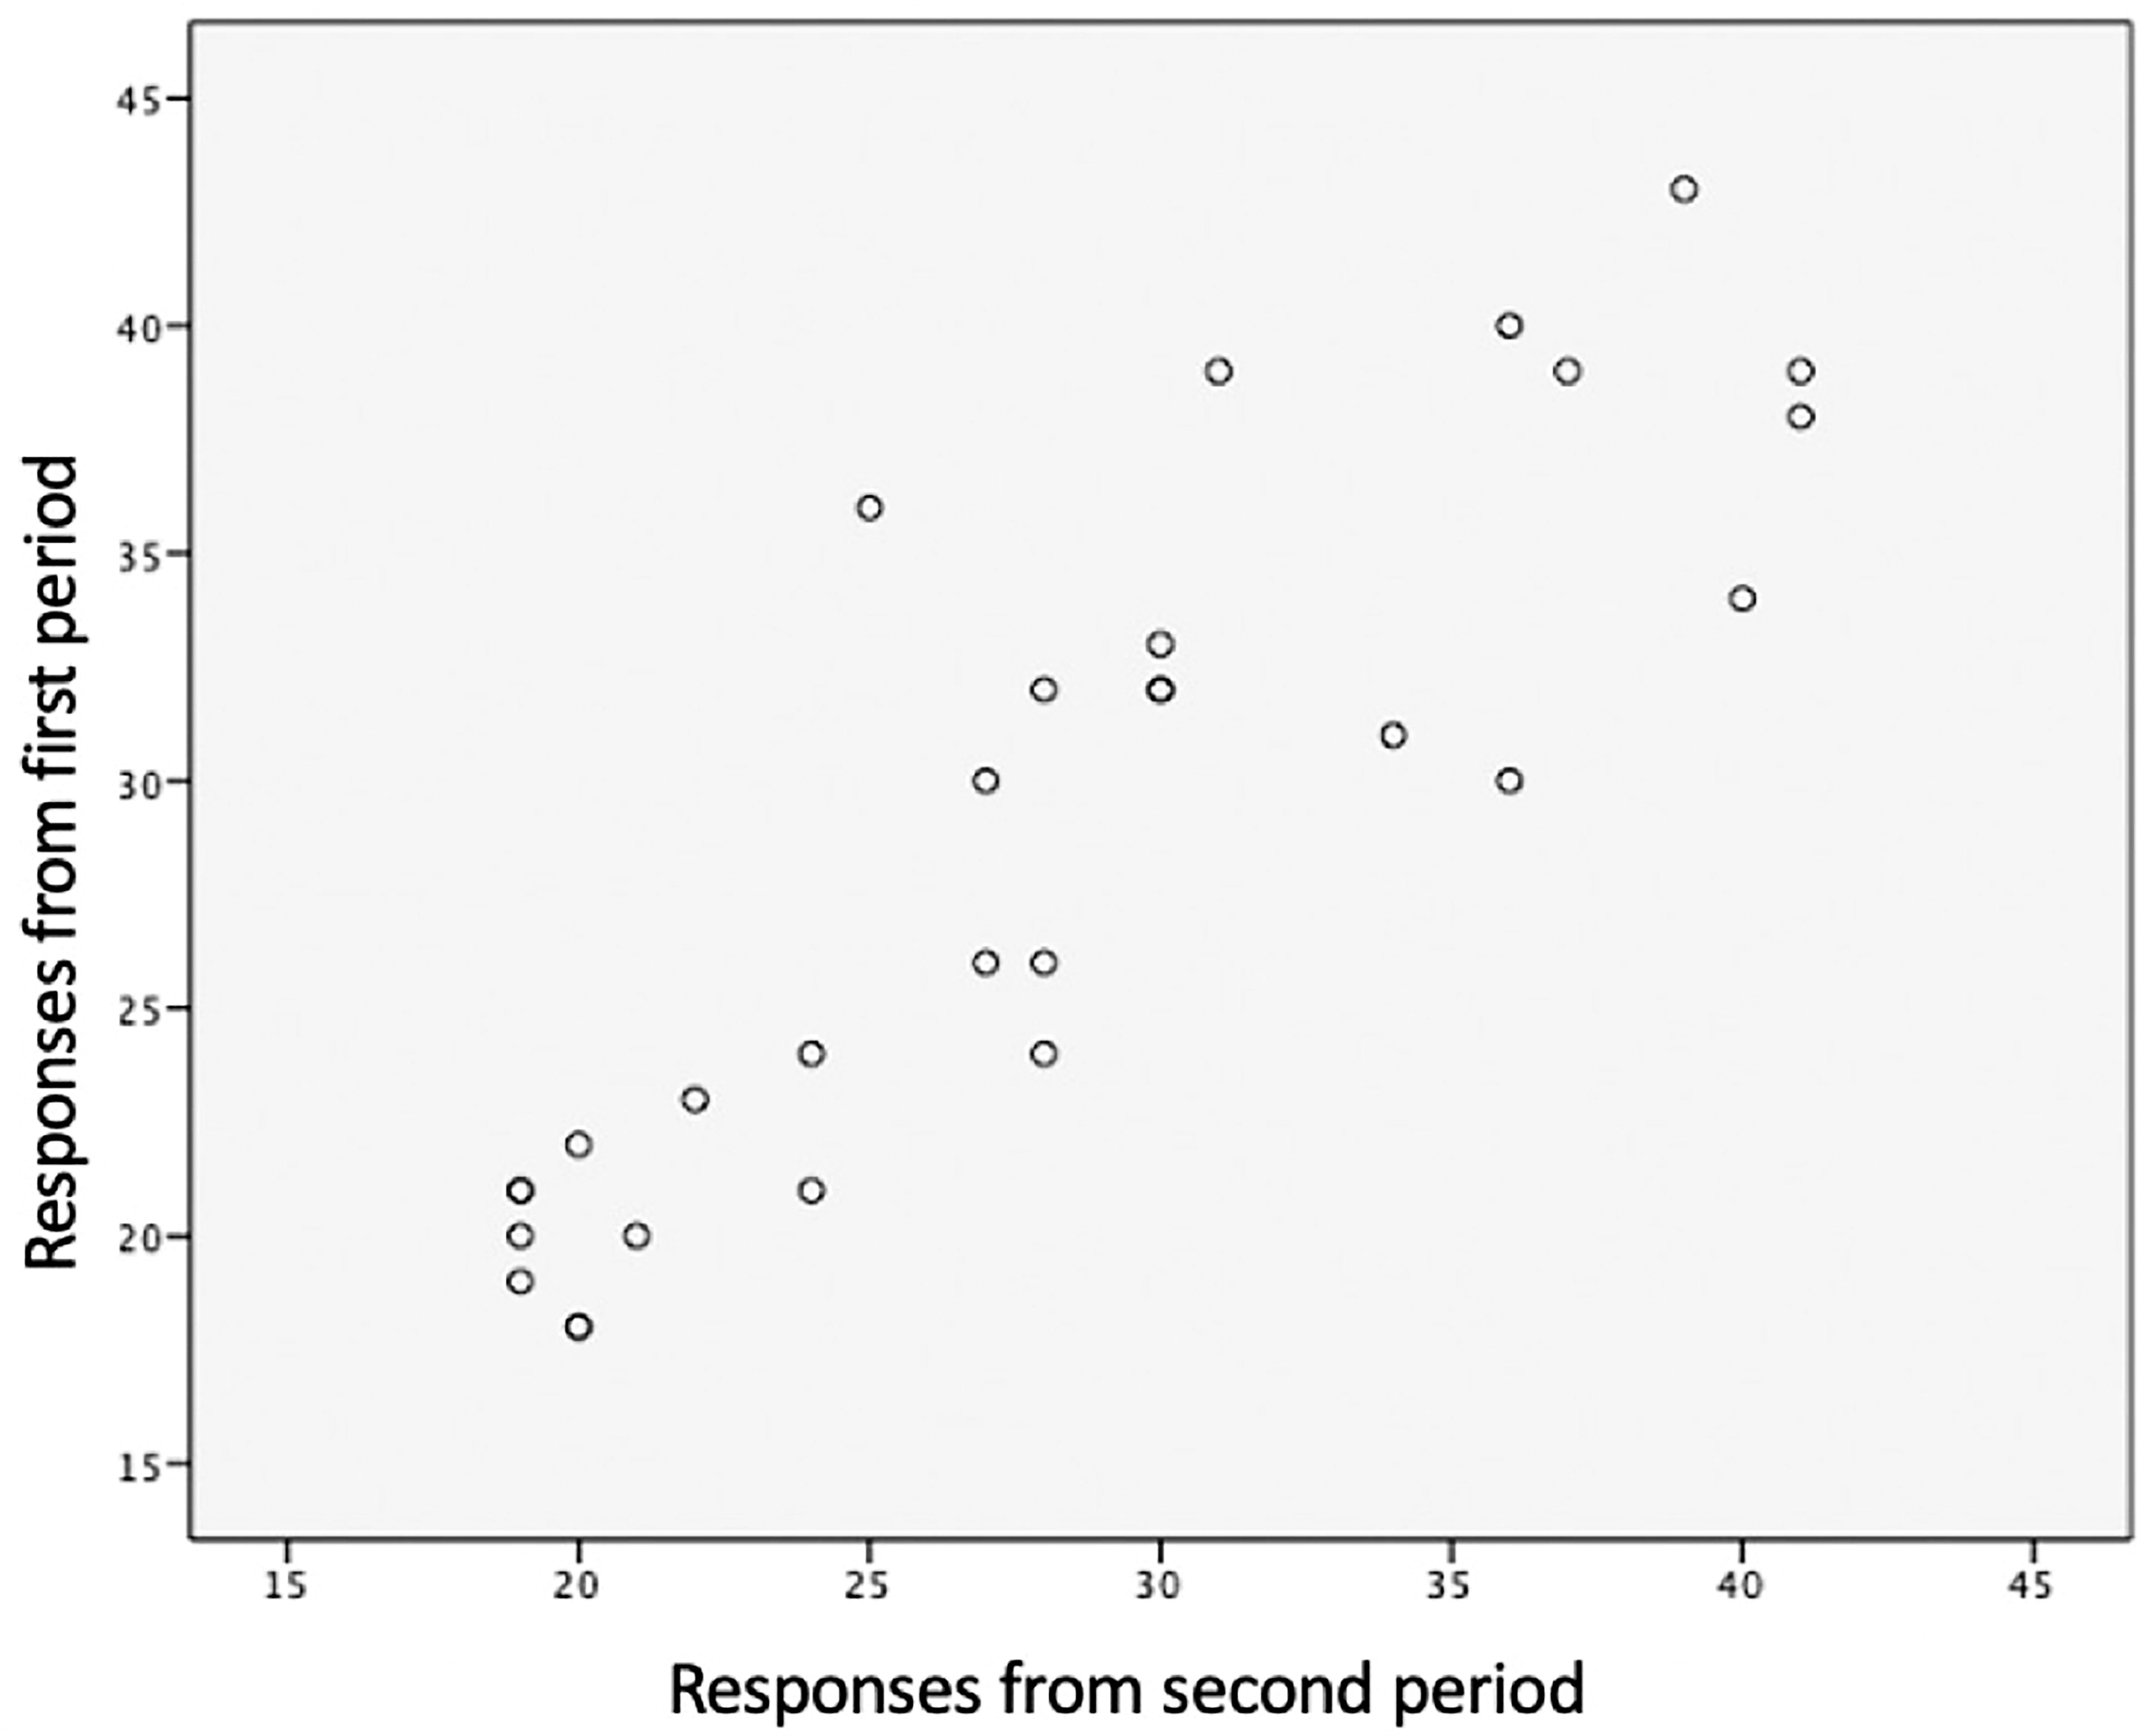
Scatter graph of the questionnaire responses from the two time points.
The KMO test produced an index of 0.846, and the result of the Bartlett test was statistically significant (p < 0.001); therefore, we were able to conduct the factorial analysis to determine construct validity. The questions with the lowest communality indices, obtained through principal component analysis (Table 6), were “How would you rate the health care received by patients via teledermatology compared with health care received during an in-person dermatology consultation?” (0.463) and “Do you consider that teledermatology can help you improve your knowledge of dermatology?” (0.478).
Communality Indices Calculated for Each of the Questions through Principal Component Analysis
The Varimax method detected four components with an eigenvalue greater than 1, which explained 68.1% of the variance in the questionnaire (Fig. 2). Four was also the number of domains in the provisional questionnaire.
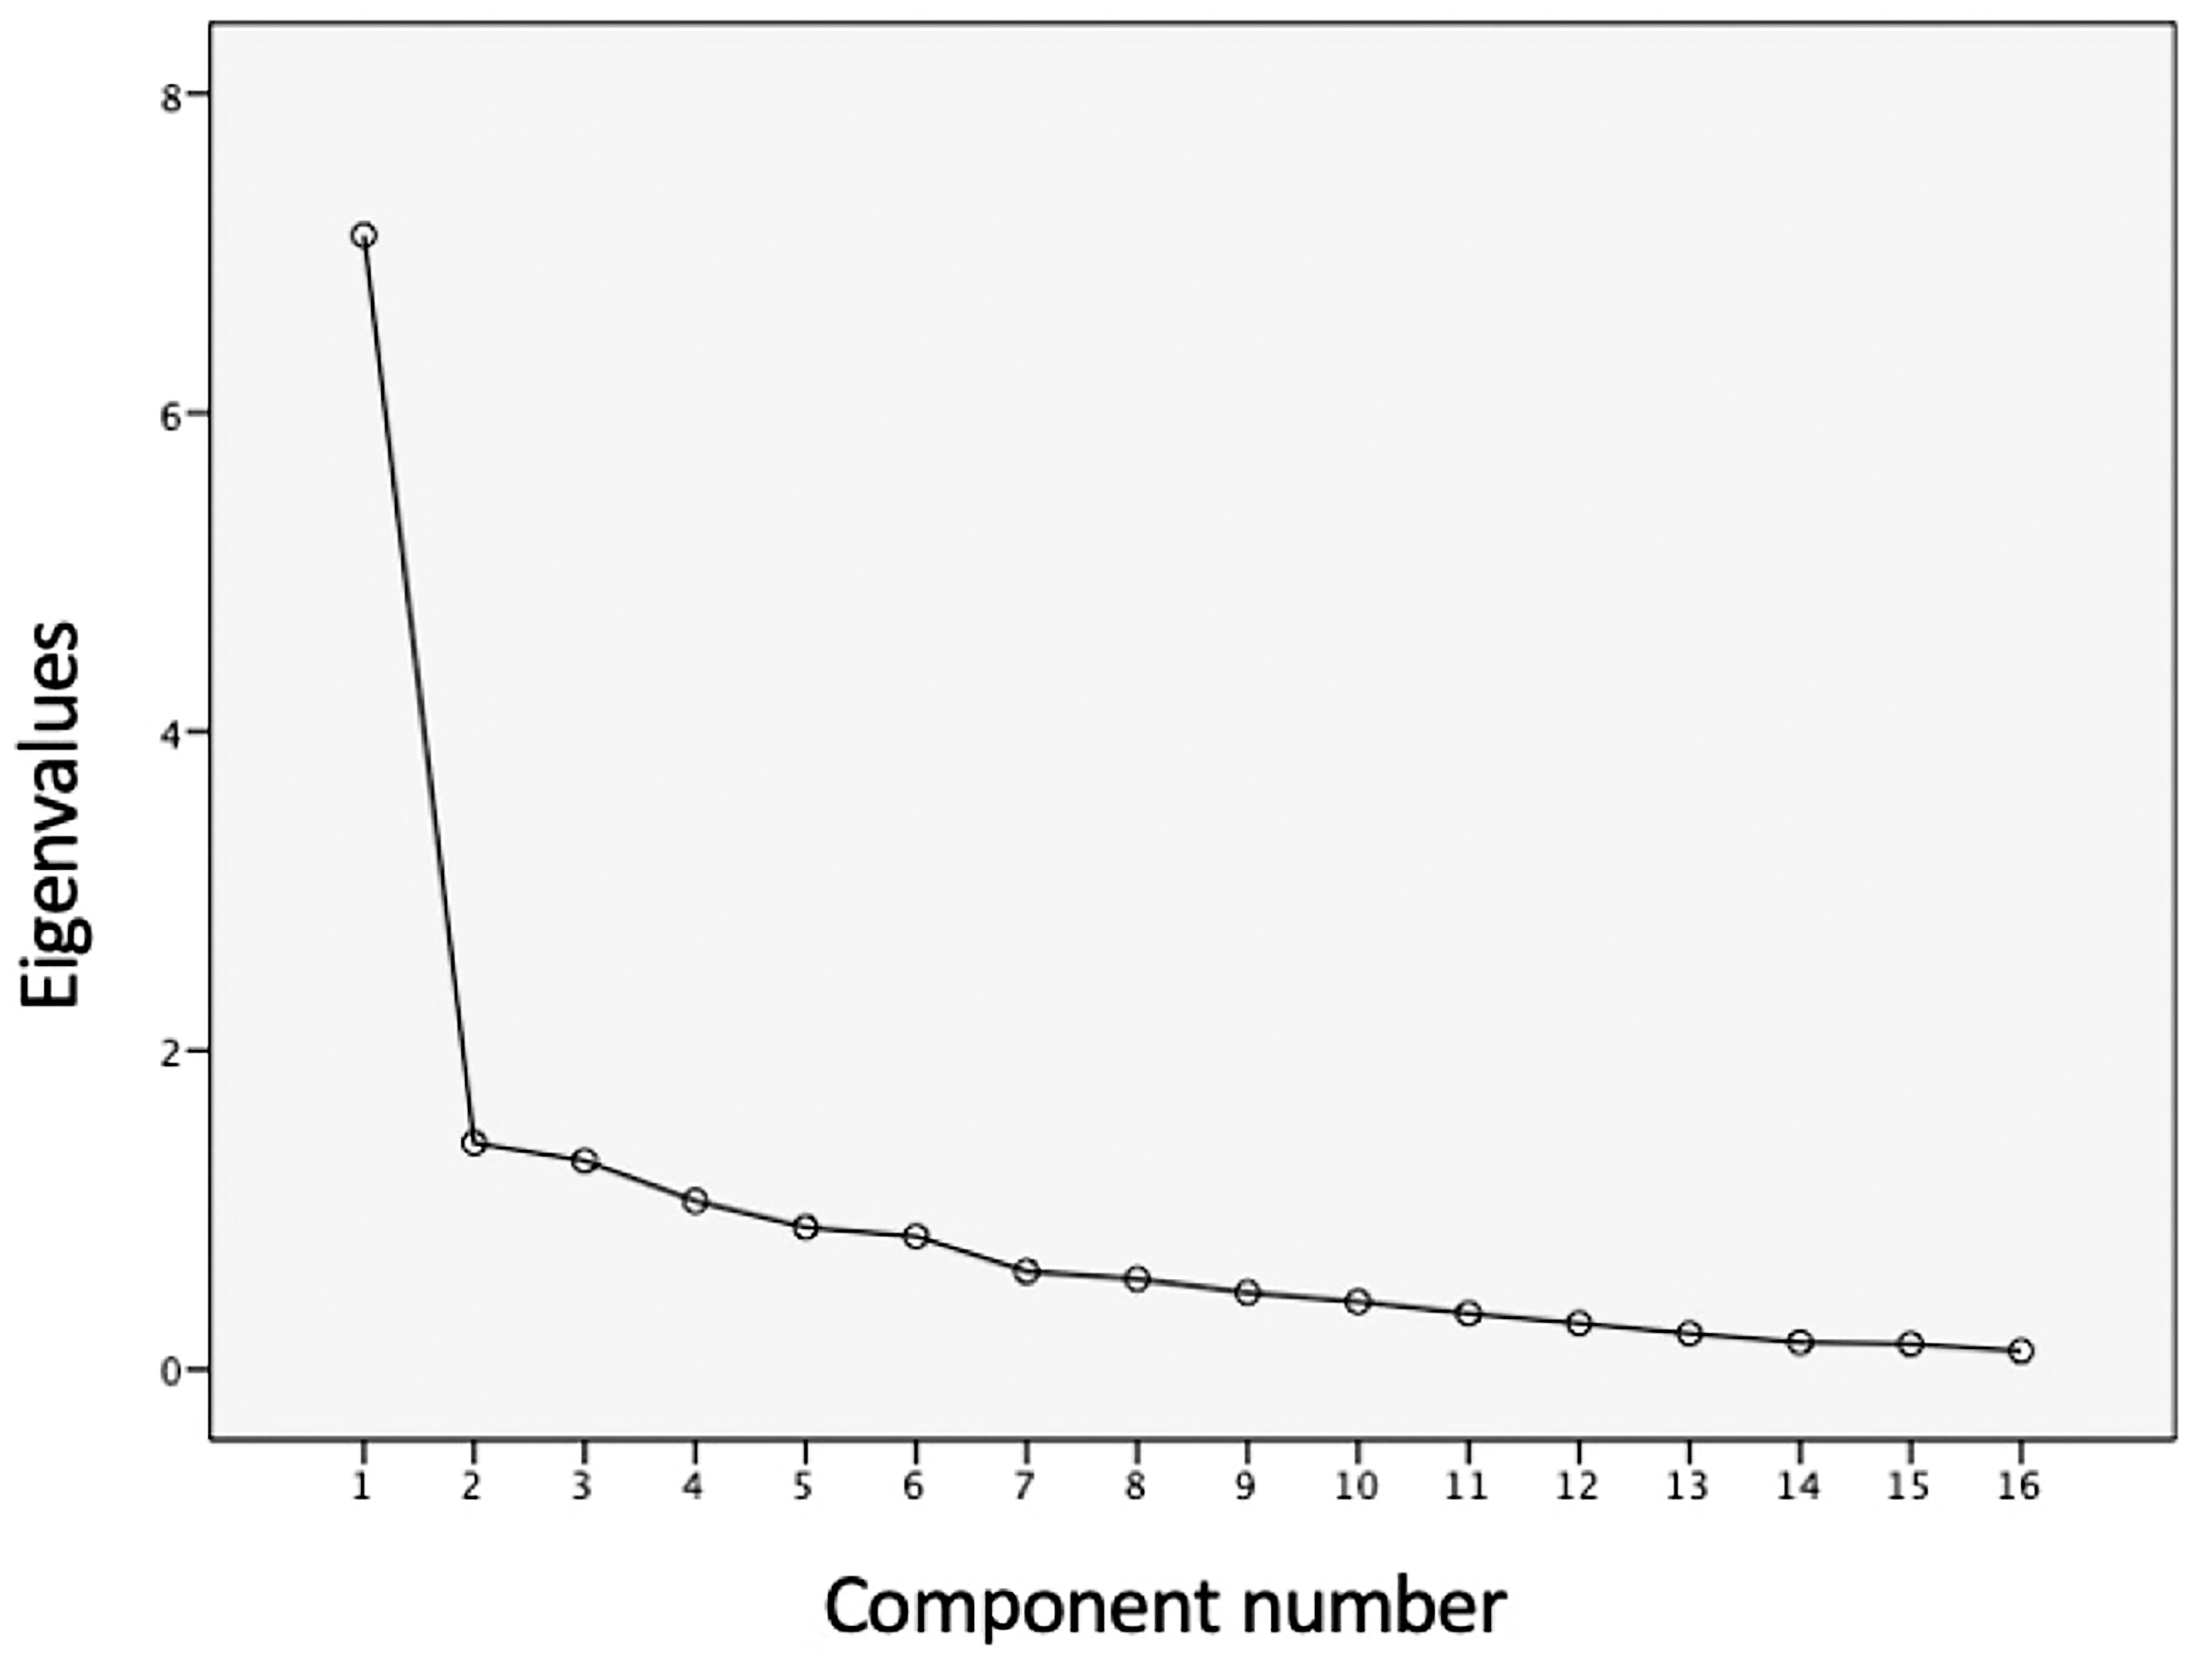
Screen plot obtained using the Varimax method for detecting the questionnaire domains.
To include the questionnaire items in each of the components, we studied the data in a rotation matrix (Table 7). For an item to be included in a component, it had to have a factor greater than 0.5. After ordering the items in the four components using this criterion, we found some discordance with respect to the domains defined before validation.
Rotation Matrix Obtained Though the Varimax Method for Determining the Components of Each of the Questionnaire Domains
Bold values correspond with factors over 0,5.
Component 1 explained 44.46% of the variance and included 5 of 6 items from the “Utility” domain, as well as two items from the “Satisfaction” domain. Component 1 also included the question “Do you think the extra time spent carrying out a teledermatology consultation is worth it?” which belonged to the “Limitations” domain.
Component 2 explained 8.87% of the variance and included 3 of 4 questions from the “Quality” domain.
Component 3 explained 8.17% of the variance and included 2 of 4 questions from the “Limitations” domain, as well as the question “How would you rate the health care received by patients via teledermatology compared with health care received during an in-person dermatology consultation?” from the “Quality” domain.
Component 4, which explained 6.6% of the variance, included no items.
Two items had a factor below 0.5 in all components; these were the questions, “Do you think the diagnoses and plans issued by the dermatologist via teledermatology are reliable?” And “Do you believe that having a camera for the exclusive use of teledermatology would facilitate the use of said tool?”
FINAL VALIDATED QUESTIONNAIRE
With the results obtained in the validation process and considering that Cronbach’s alpha was above 0.7 for the questionnaire as a whole, we decided to keep all the questions of the revised questionnaire, with only minor variations in the wording. Although the construct validity was suboptimal, the questionnaire showed good internal consistency, good reliability, and good content validity.
The result of our study was a validated questionnaire (Table 8) suitable for virtual dissemination through Google Forms.
Final Validated Questionnaire (Spanish and English Version)
The English version is a translation of the original Spanish questionnaire. Please consider that the translation of the items into english does not replace a transcultural adaptation of the instrument.
Discussion
When we consulted the literature, we were unable to find a suitable Spanish-language questionnaire for evaluating pediatricians’ satisfaction with teledermatology. For this reason, we decided to create our own questionnaire through a process of consensus and with reference to previously published questionnaires. 8,10,13,14 After a group of experts had evaluated our provisional version, we made pertinent changes to the first version of the questionnaire. Then, we submitted the revised version for statistical validation; once checked, every item had an I-CVI greater than 0.78 for clarity, coherence, relevance, and sufficiency.
The two main aspects of the validation of a questionnaire are reliability and validity. 15 Reliability was assessed by the internal consistency, with a Cronbach’s alpha coefficient above 0.70 for the whole questionnaire (0.890), as well as for most of its dimensions, and by the reproducibility, as the target population’s responses were stable across two time points separated by 1 month, reaching an intraclass correlation index of 0.875. Therefore, we can consider our questionnaire reliable with results comparable to the study published by Vidal i Abadall in 2018, who obtained a Cronbach’s alpha coefficient of 0.84 and an intraclass correlation index of 0.93. 10
To assess validity, we studied construct validity. The principal component analysis revealed two questions with a lower communality index (questions 3 and 9 of the revised questionnaire), probably because they had fewer response options than the other questions (three instead of four). Furthermore, the Varimax method and the rotated component matrix detected four components to match our four domains. However, the items in each component were different from our initial grouping, which means the construct validity was suboptimal. In addition, we studied content validity with S-CVI, reaching values for clarity, coherence, relevance, and sufficiency greater than 0.9. That is why our questionnaire is considered valid, with excellent content validity, though construct validity was poor. This discordance could be explained because of the low answer rate despite the correct diffusion of the questionnaire.
Although the question “Do you think having a camera for exclusive use in teledermatology would facilitate the use of said tool?” had a factor of less than 0.5 in the rotated component matrix, and although eliminating this question increased the Cronbach’s alpha coefficient of the dimension and of the whole questionnaire, we decided to keep it in the validated version, as the question had an adequate I-CVI and the responses were very useful for guiding the intervention. For this reason, and in view of the questionnaire’s validity and reliability, we made no changes to the revised version. Such a situation was approached similarly by Zhou et al. 16
The final validated questionnaire has an initial section for collecting demographic information and for determining professionals’ experience with teledermatology to filter out those with insufficient knowledge to complete the questionnaire (Table 8). After this initial section, there are a further 16 questions, adapted and reformulated from the 15 questions in the provisional questionnaire: we added one question to the “Usefulness” domain, and we regrouped questions from the “Limitations” domain (Table 3).
Our study has the following limitations: The virtual dissemination of the questionnaire and the lack of incentives may have reduced the response rate. Although there were sufficient respondents to validate the questionnaire, as some studies do,
16
other studies have achieved larger samples.
10
The validated questionnaire focuses on pediatric asynchronous teledermatology, so it is not applicable to other professionals who use teledermatology or to professionals who use other modalities of telemedicine, including synchronous teledermatology. Our questionnaire evaluates the use of personal mobile phones to take pictures in the teledermatology process, so organizations using other devices may remove these questions referring to the use of mobile phones in teledermatology.
In conclusion, our results show that our questionnaire is a robust tool for evaluating pediatricians’ satisfaction with teledermatology.
Footnotes
Disclosure Statement
The authors declare that there is no conflict of interest.
Funding Information
The author(s) received no financial support for the research, authorship, or publication of this article.