
Abstract
Sleeping sickness is a major threat to human health in sub-Saharan Africa. Southeastern Uganda has experienced a number of significant epidemics in the past 100 years, most recently from 1976 to 1989. Recent and continued spread of the disease has highlighted gaps in the ability of current research to explain and predict the distribution of infection. Vegetation cover and changes in vegetation may be important determinants of transmission and disease risk because of the habitat preferences of the tsetse fly vector. This study examines the determinants of sleeping sickness distribution and incidence in southeastern Uganda from 1970 to 2003, spanning the full epidemic region and cycle, and focusing in particular on vegetation cover and change. Sleeping sickness data were collected from records of the Ugandan Ministry of Health, individual sleeping sickness treatment centers, and interviews with public health officials. Vegetation data were acquired from satellite imagery for four dates spanning the epidemic period, 1973, 1986, 1995, and 2001. Zero-inflated regression models were used to model predictors of disease presence and magnitude. Correlations between disease incidence and the normalized difference vegetation index (NDVI) at the subcounty level were evaluated. Results indicate that sleeping sickness infection is predominantly associated with proximity to water and spatial location, while disease incidence is highest in subcounties with moderate to high NDVI. The vegetation density (NDVI) at which sleeping sickness incidence peaked differed throughout the study period. The optimal vegetation density capable of supporting sleeping sickness transmission may be lower than indicated by data from endemic regions, indicating increased potential for disease spread under suitable conditions.
Introduction

Location of study site. Star indicates major population centre, Kampala.
The continental distribution of trypanosomiasis is determined by the distribution of suitable climatic and vegetative conditions for the presence of tsetse vectors in Africa (Rogers 1991, Leak 1999, McDermott et al. 2001, Berrang-Ford et al. 2005). At regional and local scales, sleeping sickness is influenced by vegetation and land cover variation because of the habitat preferences of vector species. Research by Odiit et al. (2006), for example, found that the sleeping sickness status of villages in Tororo District between 1987 and 2002 was significantly associated with proximity to wetlands and vegetation wetness. The main vector of sleeping sickness in southeastern Uganda, Glossina fuscipes fuscipes, is predominantly a riverine fly, found in vegetated areas near the edges of rivers or lakes as well as vegetated thickets and peri-domestic habitats (Onyango 1969, Matovu 1982). Changes in vegetation and land cover may also contribute to sleeping sickness incidence (Ford 1969, Mbulamberi 1989, Hadis et al. 1995, Koerner et al. 1995, Leak 1999, Fournet et al. 2000, Courtin et al. 2005). The collapse of the cotton and coffee industries, associated with political instability in the 1970–1980s, is believed to have resulted in the growth of bush and local vegetation, creating expanded tsetse habitat and contributing to the 1976 sleeping sickness epidemic in southeastern Uganda (Koerner et al. 1995). Understanding of the influence of land cover and particularly land cover change on sleeping sickness incidence can benefit from the use of satellite imagery to evaluate disease risk over larger regions in space and for multiple dates (Rogers and Randolph 1993). Satellite-derived data are particularly useful for historical and time-series analyses, allowing increased standardization of data formats and processing methodologies.
A recent study (Berrang-Ford et al. 2006a) identified spatial and temporal trends in sleeping sickness incidence in southeastern Uganda from 1970 to 2003. The study frame included the full temporal period and spatial region encompassing the most recent major epidemic of T.b. rhodesiense sleeping sickness in Uganda. The authors report rapid radial spread of sleeping sickness in the 1970s and 1980s, followed by continuous northward spread in the late 1990s. This pattern has continued, with recent reports of potentially expanded tsetse habitat, ongoing incidence, and spread into previously unaffected regions in central Uganda (WHO 2006, Ministry of Health 2008). Conclusions recommended investigation of the predictors and determinants of these trends. This article follows up on the results of Berrang-Ford et al. (2006a) to describe and evaluate the determinants of sleeping sickness in southeastern Uganda from 1970 to 2003, with particular focus on the role of vegetation and vegetation change.
Materials and Methods
Study area
The study area comprised 17 districts in southeastern Uganda, subdivided into 46 counties and 225 subcounties (Fig. 1). The region covers approximately 55,000 km2, with a population of just under 9 million (UBOS 2002). Thirteen percent of this population live in the urban capital, Kampala (UBOS 2002), with the remainder predominantly rural, dominated by livestock and subsistence farming (Jamal 2001, Leggett 2001).
Data collection
Cross-sectional sleeping sickness data for the period 1970–2003 were collected in 2004, including case counts and measures of disease magnitude by subcounty per year. Data were collected for all available records of sleeping sickness patients in 17 southeastern Ugandan Districts between 1970 and 2003. A detailed description of data collection methodology can be found in Berrang-Ford et al. (2006a).
Sleeping sickness data from 1988 to 2003 were provided by the National Sleeping Sickness Control Program (NSSCP) at the Ugandan Ministry of Health. For data before 1988, no centralized collection of records exists beyond district summaries; sleeping sickness case data remain in records at individual treatment centers. Data before 1988 were collected retrospectively in 2004 during visits to all treatment centers active in the 1980s. Case definition was based on the primary diagnosis; all cases recorded in record books were included in this study. No quantitative records were available before 1980. Interviews were conducted with public health officials to complement and extend 1970s and 1980s data. Questions focused on establishing the chronology of sleeping sickness infection. Example questions: When was the first case of sleeping sickness in Iganga District? What subcounties were affected? What happened in 1979? Were there a few or a lot of cases in that subcounty that year? What do you mean when you say epidemic level? and How confident are you? There were a limited number of key health officials present during these years (i.e., 3–5); all remained contactable via the Ministry of Health. Interviews were used to verify data for the 1980s and to classify disease magnitude for the 1970s. Interviewer information was compared to available sleeping sickness records and the literature. These results were used to develop a classification database of disease magnitude by subcounty and year for all years and subcounties during the study period (1970–2003). Resulting data and maps were presented to informants for discussion and validation at follow-up interviews in 2005. Triangulation of data sources and expert information was used to reduce potential error and recall bias.
Additional explanatory variables included human population density, cattle and pigs per capita, distance from subcounty centroid to nearest waterbody (major lake or river, Fig. 1), centroid coordinates, and prevalence of Trypanosoma brucei in the cattle and pig populations. Human population data were acquired from the 1980, 1991, and 2002 population censuses for Uganda (UBOS 2002). Prevalence data of trypanosomiasis infection in cattle and pigs were acquired from a 2002 Nagana survey conducted by the Farming in Tsetse Controlled Areas (FITCA) Project (
Satellite image processing
Four sets of Landsat satellite images covering southeastern Uganda (Fig. 1) were acquired from the United States Geological Survey (USGS) for the following dates: 1973 (multispectral scanner), 1986 (thematic mapper), 1995 (thematic mapper), and 2001 (enhanced thematic mapper). Image resolution was 30 m for thematic mapper/enhanced thematic mapper imagery and 60 m for multispectral scanner (MSS) images. To minimize seasonal differences between dates, images with minimal cloud cover were selected from late October to March during Uganda's dry season; sleeping sickness cases are highest during the dry season in the study area (Rogers 1991), and dry season data comparison is less sensitive to the effects of rainfall variation. The satellite data were geometrically corrected to match image pixels to their true ground space in a known coordinate system. Images were georeferenced to 1:50,000 digital topographical data provided by Africover Nairobi (
While comparison of satellite data across years is subject to significant challenge due to seasonal and annual variation, calibration based on methods developed by Green et al. (2000) maximized image reliability; raw image digital numbers were converted to comparable surface reflectance values using solar irradiance values, solar illumination geometry, and calibration using deep, nonturbid lake reflectance values across images. Resulting images were merged and clipped to the dimensions of the study area, creating a single image for each of the 4 years. Clouds and deep waterbodies were masked and excluded from all analyses.
Various indices have been used to predict variation in tsetse habitat, including normalized difference vegetation index (NDVI), Greenness, Moistness, Forest Canopy Density, and individual reflectance bands and band combinations (Kauth and Thomas 1976, Rogers and Packer 1993, Rogers and Williams 1993, Kitron et al. 1996, Robinson et al. 1997, Jamalabad and Abkar 2004, Odiit et al. 2006). Subcounty means of these indices were extracted from imagery using Idrisi Kilimanjaro (Clark University, Worcester, MA). Although alternative indices to the NDVI have been recommended (Robinson et al. 1997), NDVI was found to be most strongly correlated in all analyses for this dataset. Combination of multiple indices was precluded by significant interaction and confounding between indices. NDVI represents an index of vegetation cover; high NDVI values indicate higher vegetation densities (Lillesand and Kiefer 2000). Mean NDVI values were extracted from the satellite imagery for each subcounty and year.
Data analysis
Data from 1980 to 2003 were available as mean annual case counts per subcounty; annual case counts were averaged for each subcounty over the 34-year period. Pre-1980 data were available only as binary or ordinal categories of magnitude (no cases, 1–5 cases, 16–100 cases, and 100+ cases). For these data, categories were replaced with case count data using the minimum count for each category range. The data were highly over-dispersed with an excess of zero counts (i.e., no cases). Zero-inflated (ZI) models, based on a mixture of logistic with Poisson (ZIP) or negative binomial (ZINB) models (Dobbie and Welsh 2001, Agarwal et al. 2003), were used to identify predictors contributing to both logistic variation (i.e., what variables predict whether a subcounty will experience cases of sleeping sickness) and to variation in case counts (i.e., among the subcounties that experience cases, what variables predict how many cases a subcounty will have). For selection between alternative ZIP and ZINB models and negative binomial regression models, the Vuong and likelihood ratio tests were used (Long and Freese 2001). A linear regression model was used to evaluate predictors of year of first infection.
All models were conducted in the software STATA 9.2 (StataCorp, College Station, TX), using manual backward elimination, followed by testing for significant interaction and confounding using a 30% threshold (Dohoo et al. 2003). Where appropriate, variables were tested for normality and independent variables tested for linear associations with the outcome. The sleeping sickness and model residual data were checked for presence of spatial autocorrelation using a global Moran's I (GeoDa v.0.9.5-i5, Anselin & The University of Illinois; Queen contiguity weighting). Spatial effects were controlled for using a second-order trend surface model in the spatial coordinates of the subcounty centroids (Waller and Gotway 2004). Semivariogram modeling, based on the resulting residuals of the regression models/ZINB model, did not reveal evidence for unaccounted spatial autocorrelation.
Results
Sleeping sickness
Figure 2 shows the epidemic curve for 1970 to 2003 in southeastern Uganda. The epidemic commenced in 1976, peaking in the 1980s, followed by a decline in the 1990s. While the time-series shown is bimodal, the epidemic is generally considered to be a single, essentially unimodel event; the dramatic decrease in incidence in 1982 and 1983 is related to temporary German Red Cross intervention in 1980 in the Luuka county region (western Iganga District) and reduced surveillance in the early 1980s associated with political and economic decline in the country (Abaru 1985, Berrang-Ford et al. 2006a, Berrang-Ford 2007, Mbulamberi, personal communication).
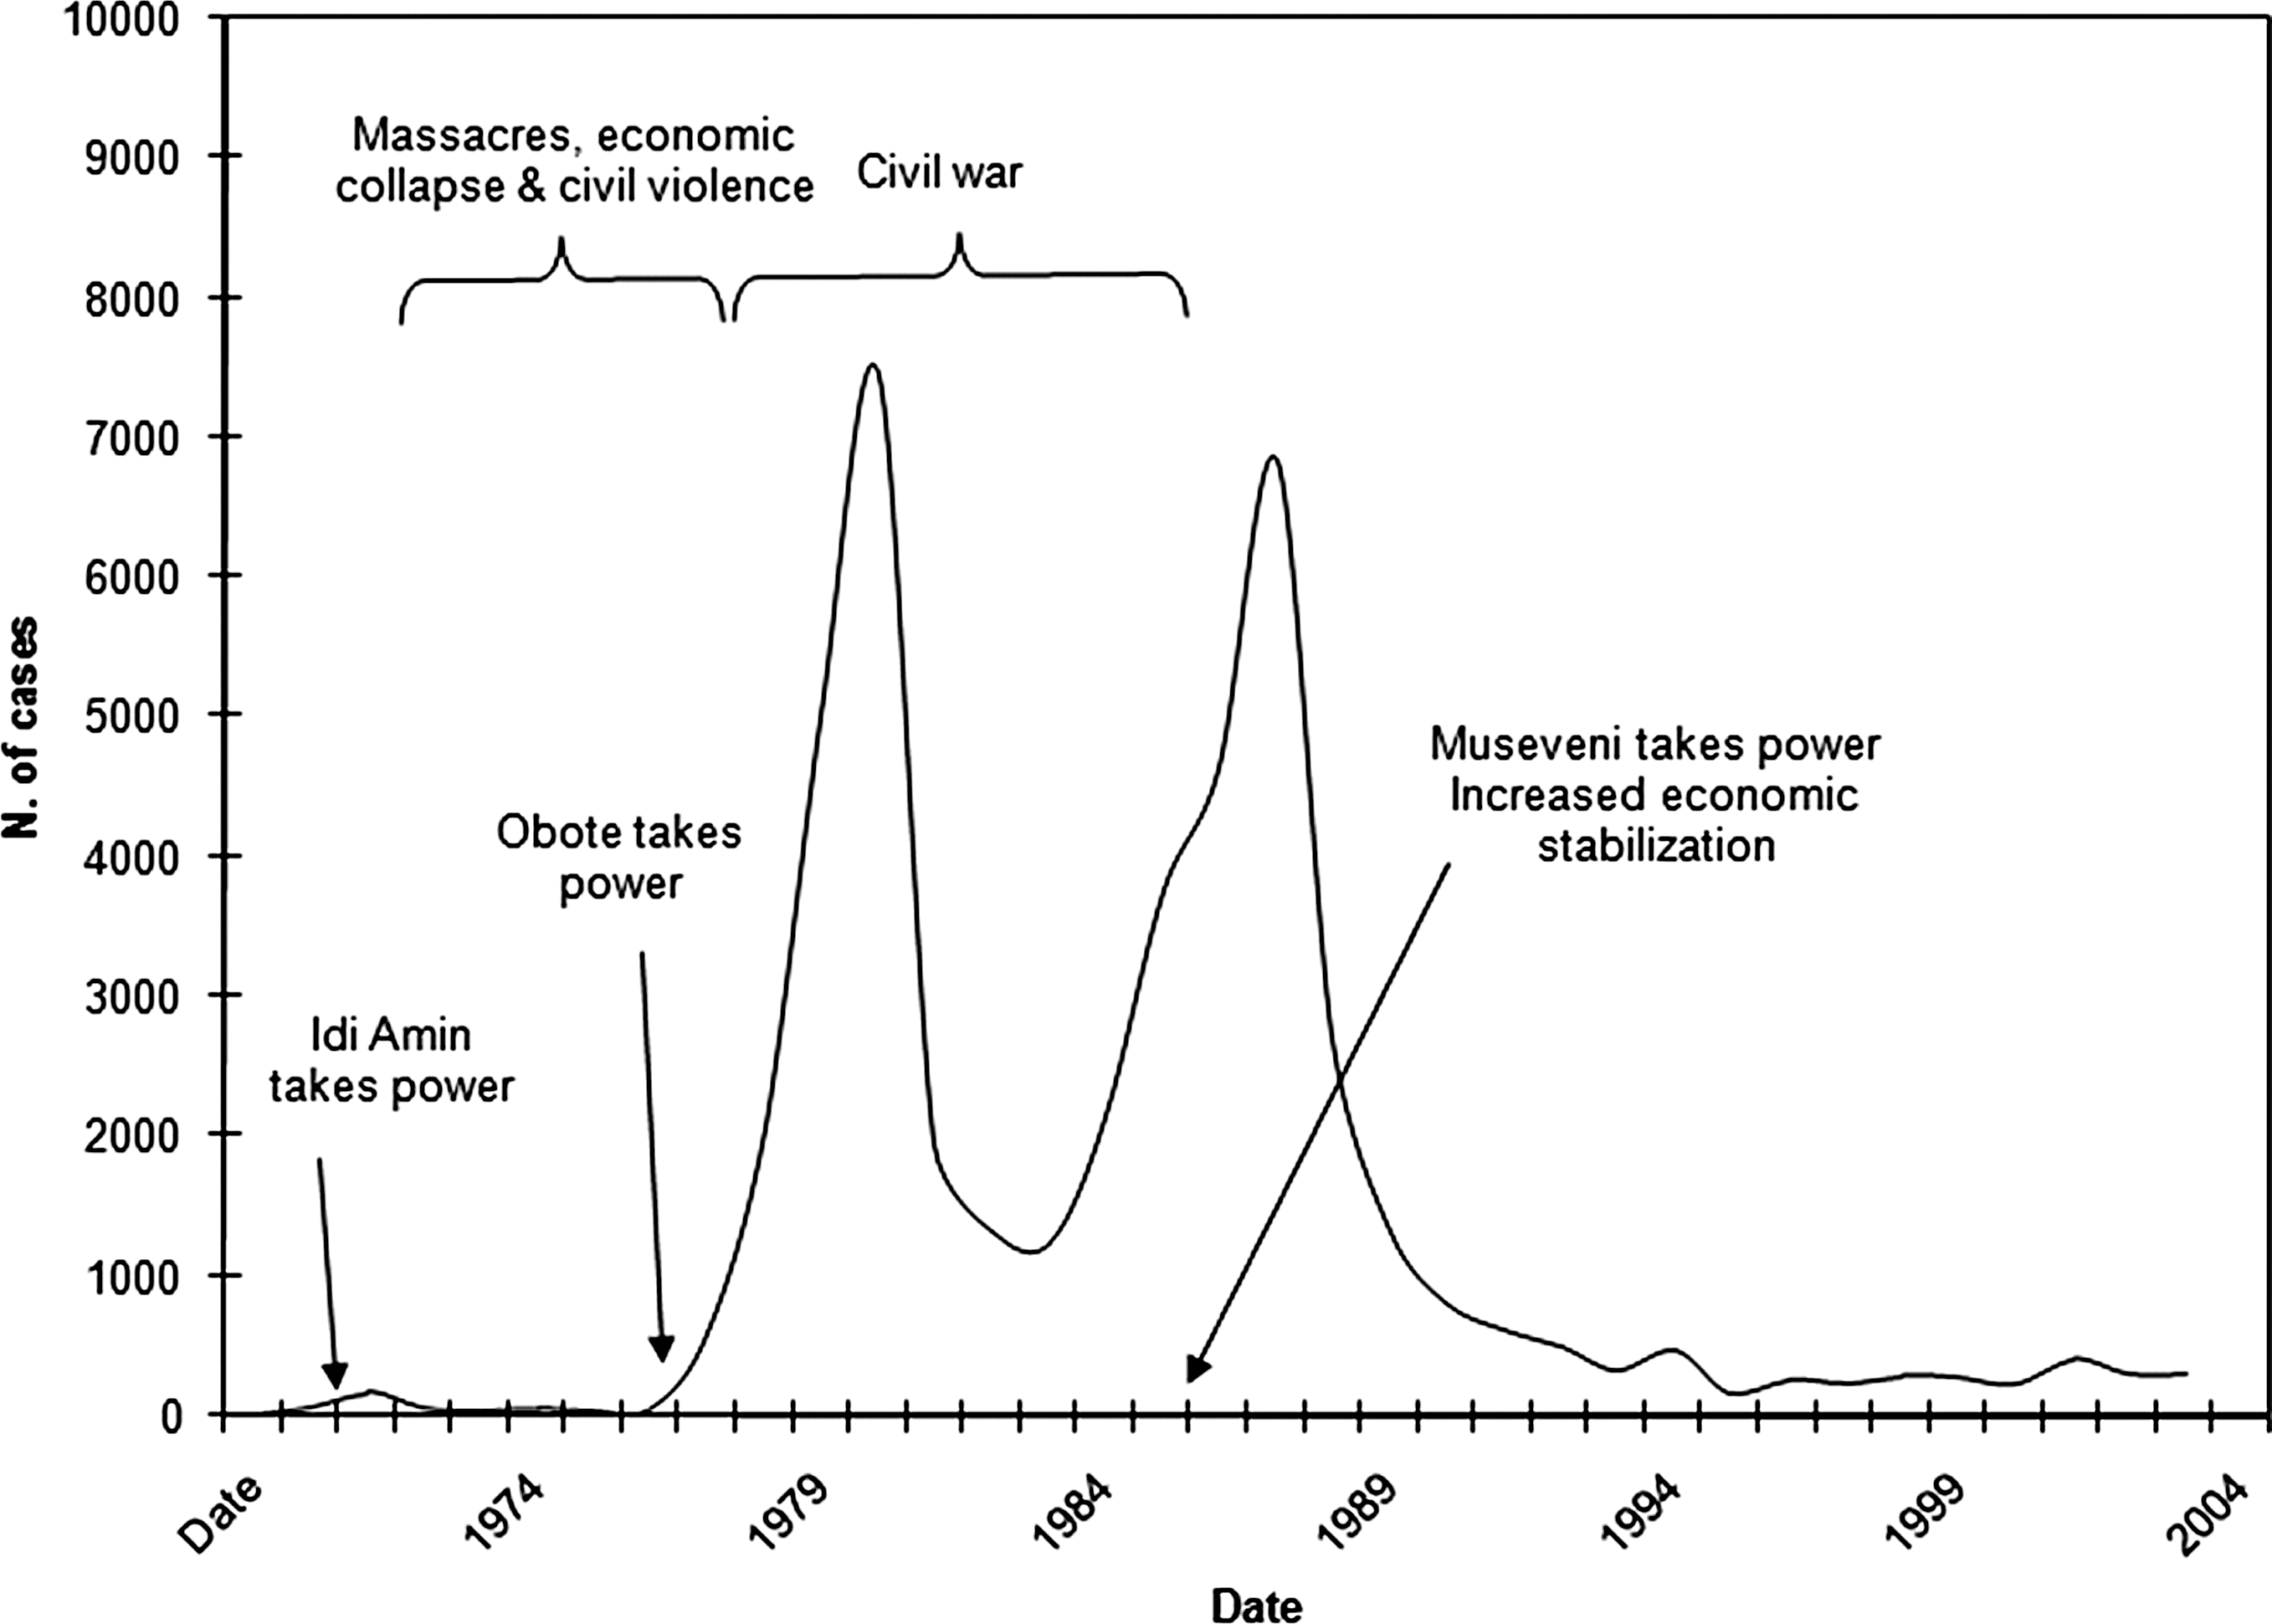
Timeline of political events and recorded sleeping sickness incidence in southeastern Uganda, 1970–2003. Sources: 1970–1971 (Mbulamberi, personal communication); 1972–1975 (Okiria 1985); and 1976–2001 (Ministry of Health 2004); political events (Kyemba 1977, Adu Boahen 1990, Kasozi 1994). See also Berrang-Ford (2007).
The spatial distribution of sleeping sickness is summarized in Figure 3. Mean epidemic incidence was highest in the districts of Iganga, Jinja, and Mayuge. Approximately 60% of the 225 subcounty observations had one or more cases from 1973 to 2003; of these affected subcounties, the mean annual case count per subcounty was six cases/year, though this number is highly conservative given the binary recording of 1970s data. The mean annual case count ranged from 3 cases/year in 1995 to as high as 77 cases/year in 1987.

Incidence of sleeping sickness in southeastern Uganda, 1970–2003. Incidence represents conservative estimates since nominal (1970–1975, presence/absence), and ordinal (1976–1979; low, medium, and high) data were adjusted to the minimum number of cases for each categorical range. Polygon observations represent subcounties. Black circle represents a significant cluster of cases in space and time for the years 1981–1988 (p < 0.01, relative risk = 37.1; using 25% temporal and spatial windows and Poisson model with 2002 population data, space-time scan statistic (Berrang-Ford et al. 2006a), SaTScan v.7.0.3). Star indicates capital city, Entebbe.
Vegetation change
The spatial distribution of vegetation density is shown in Figure 4. Vegetation densities are consistently highest in the south of the study area on the coast of Lake Victoria, and along the slopes of Mount Elgon in the east. The north of the study area, north of Lake Kyoga, represents dryer savannah regions, separated from the moist and semideciduous lakeshore by mixed savannah-forest vegetation and extensive subsistence farming (Mukiibi 2001). Mean variation in the NDVI measure was lower between subcounties than within subcounties (mean NDVI: 0.340, 0.408, 0.398, and 0.284; mean between subcounty standard deviation: 0.082, 0.069, 0.077, and 0.082; mean within subcounty standard deviation: 0.101, 0.082, 0.102, 0.102 for 1973, 1986, 1995, and 2001, respectively).

Normalized difference vegetation index (NDVI) by subcounty in southeastern Uganda during the dry season, (

From 1973 to 1986, there was a trend toward vegetation growth in southeastern Ugandan subcounties, followed by a reversal to vegetation removal from 1986 to 1995 (Table 1). The rate of vegetation removal increased between 1995 and 2001. These land cover changes likely reflect national social and political changes in the country at the time (Koerner et al. 1995, Fairhead and Leach 1996, Place and Otsuka 2000, Berrang-Ford et al. 2005, Keesstra and Universiteit 2005, Berrang-Ford 2007).
NDVI, normalized difference vegetation index.
While subcounties generally experienced vegetation growth during the period 1973–1986, those with the lowest vegetation cover experienced the highest rates of growth (Fig. 5a). This negative correlation between absolute vegetation cover (NDVI 1973) and vegetation change (% NDVI 1973–1986) was statistically significant (−0.72, p < 0.01, linear correlation/covariance). A weak negative correlation was also found for 1986–1995 (−0.15, p < 0.02, Fig. 5b). No correlation was observed for the period 1995–2001 (Fig. 5c). The reasons for a strong correlation for 1973–1986 data are unclear, though this pattern may be related to conversion of commercial agricultural cropping to subsistence agriculture or vegetation re-growth during political and economic instability in the early 1980s (Koerner et al. 1995, Mukiibi 2001, Berrang-Ford 2007). Correlations are based on linear pairwise correlation coefficients.
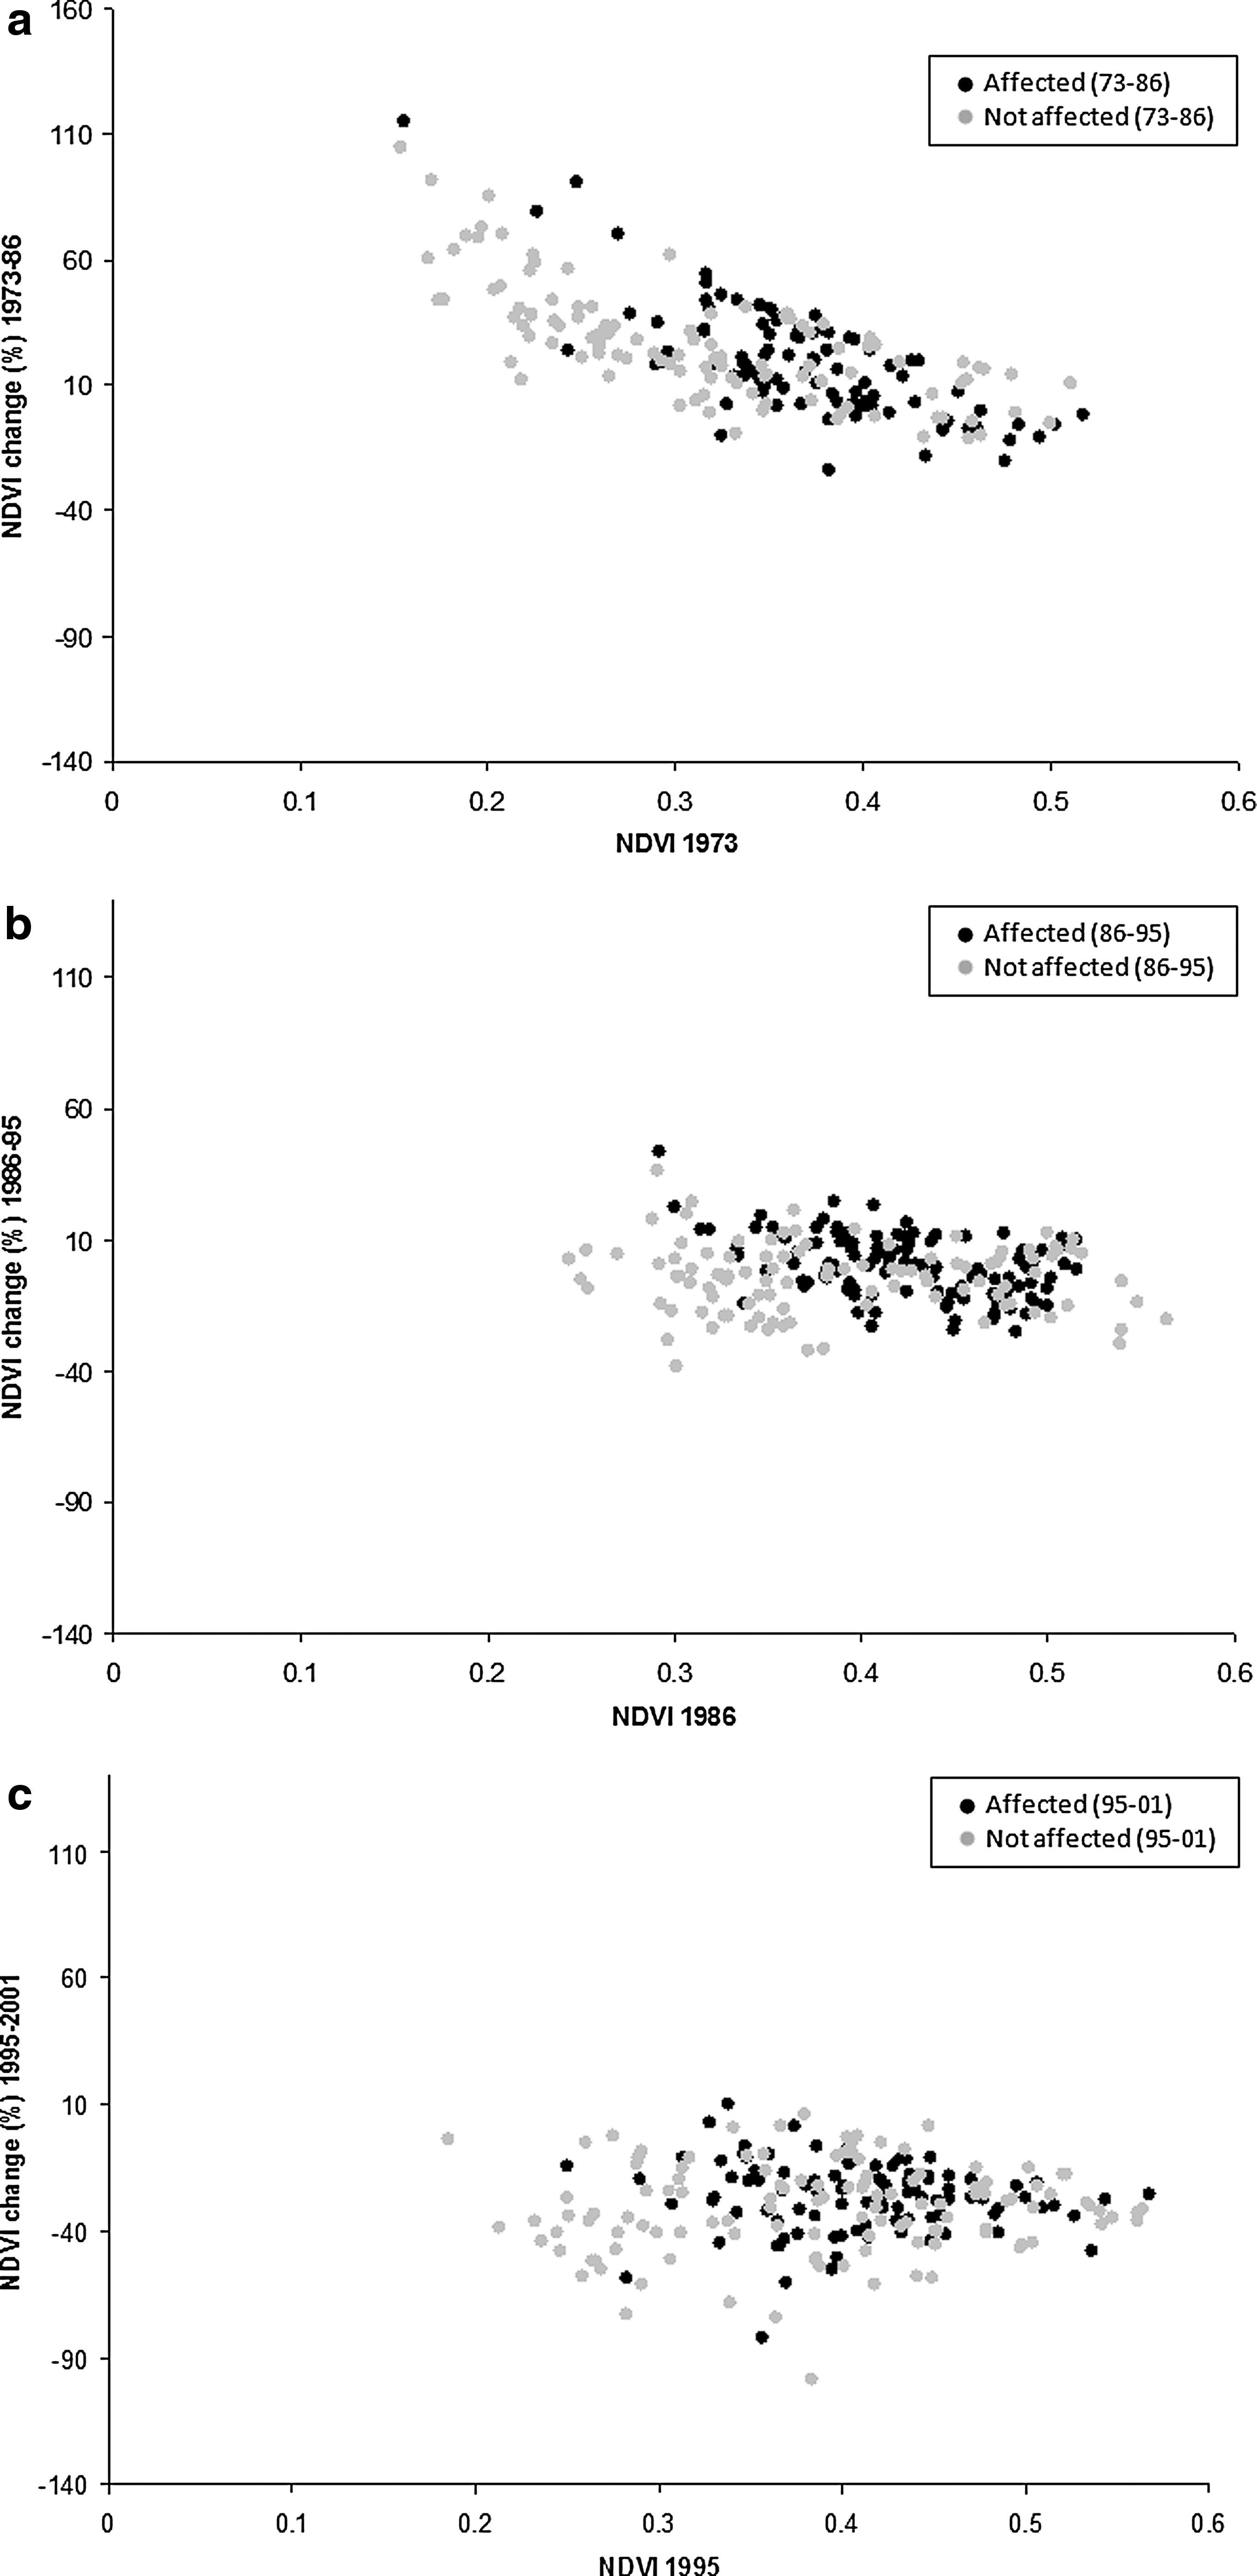
(
Predictors of sleeping sickness presence & incidence
Univariate t-test analyses identified a statistically significant difference in mean vegetation cover between affected (one or more cases over the time period) and unaffected subcounties (Table 2). In all time periods, vegetation cover was higher in counties subsequently experiencing one or more cases of sleeping sickness. Associations between sleeping sickness and vegetation change were less clear. Subcounties affected by sleeping sickness from 1973 to 1986 had significantly lower rates of vegetation growth during that period. In contrast, affected subcounties from 1986 to 1995 had significantly higher rates of growth. No significant difference was found for 1995–2001. These results suggest that absolute vegetation, rather than vegetation change, may be determining such associations, with NDVI acting as a confounder for univariate analyses of NDVI change.
Values in table represent p-values from difference in mean t-tests.
NDVI values are drawn from the beginning of the period (e.g., 1973 for the period 1973–1986).
Table 3 summarizes the results of the best-fit ZINB model for sleeping sickness. A Vuong test and likelihood test confirmed the ZI binomial model as preferable to the standard negative binomial model or a ZIP model. While spatial autocorrelation was present in the raw sleeping sickness data (Moran's I = 0.52, p < 0.01), no residual spatial autocorrelation was detected in the ZINB model (Moran's I = 0.07, p = 0.06).
The estimates are offset, or standardized, by the total population (averaged over all years) for each subcounty observation.
In zero-inflated models, the logistic component can be difficult to interpret with respect to the direction of effect. The direction of a coefficient reflects the effect of the variable on the odds of not being affected by one or more cases of sleeping sickness; this makes interpretations of the logistic component the inverse of the negative binomial component with respect to the direction of effect.
Y 2 was not a significant predictor in the trend surface analysis.
The Vuong test compares the zero-inflated negative binomial model to a standard negative binomial model.
The likelihood ratio test of alpha compares the zero-inflated negative binomial model to a zero-inflated Poisson model.
N. obs; number of observations.
Subcounties located closer to waterbodies and near to the epicenter of the epidemic in southern Iganga District were most likely to be affected during the study period. Of affected subcounties, incidence was higher in areas with moderate-high vegetation densities. The probability of observing at least one case in a given subcounty (logistic component, Table 3) was associated with distance to the nearest waterbody, as well as spatial location, based on centroid coordinates used in the trend surface analysis. The significance of location reflects the increased probability of infection in subcounties adjacent to affected subcounties with a spatial trend around southern Iganga. Subcounties closer to waterbodies have a higher probability of infection than those farther away; this is consistent with the habitat of the G. f. fuscipes vector, a riverine fly.
Of subcounties with one or more cases of sleeping sickness during the time period, those with moderate-high vegetation cover were more likely to experience a higher incidence of cases. Mean NDVI and mean NDVI2 were both significant predictors of disease magnitude; the inclusion and significance of NDVI2 indicates that disease incidence is not linearly related to NDVI and is highest within moderate NDVI ranges.
Cattle and pig densities per capita, human population density, and T. brucei prevalence were not found to be significant predictors of mean sleeping sickness presence or incidence, and were not significant confounders in the model. NDVI change did appear to be significant during modeling, though the variable was highly correlated with absolute NDVI. Centring of NDVI change did not remove correlation or improve the model. In all cases, absolute NDVI was more strongly correlated with disease incidence than NDVI change. Interaction variables were not significant and mean NDVI change was not a significant confounder of absolute NDVI. NDVI change was thus considered as an antecedent variable confounded by absolute NDVI, and excluded from the model (Dohoo et al. 2003).
A linear regression model was conducted to identify predictors of the year of first infection. This model identified only spatial variables as predictors of first infection. These included quadratic trend surface analysis variables (X, Y, XY, X 2, and Y 2), as well as location in the endemic zone (Districts of Mayuge, Bugiri, and southern Iganga). These variables explained 76% (R 2 = 0.76, p < 0.01) of the variation in year of first infection. Nonspatial predictor variables were not significant.
While sleeping sickness throughout the study period was associated with moderate-high mean NDVI, the vegetation density at which incidence peaked differed throughout the study period (Fig. 6). Maximum incidence was similar from 1973 to 1986 and 1986 to 1995, at approximately NDVI 0.4–0.5, but appears to decrease progressively in 1995–2001 (NDVI 0.3–0.4) and 2001–2003 (NDVI 0.2–0.3). This suggests that disease transmission is being supported within lower vegetation densities in recent years.
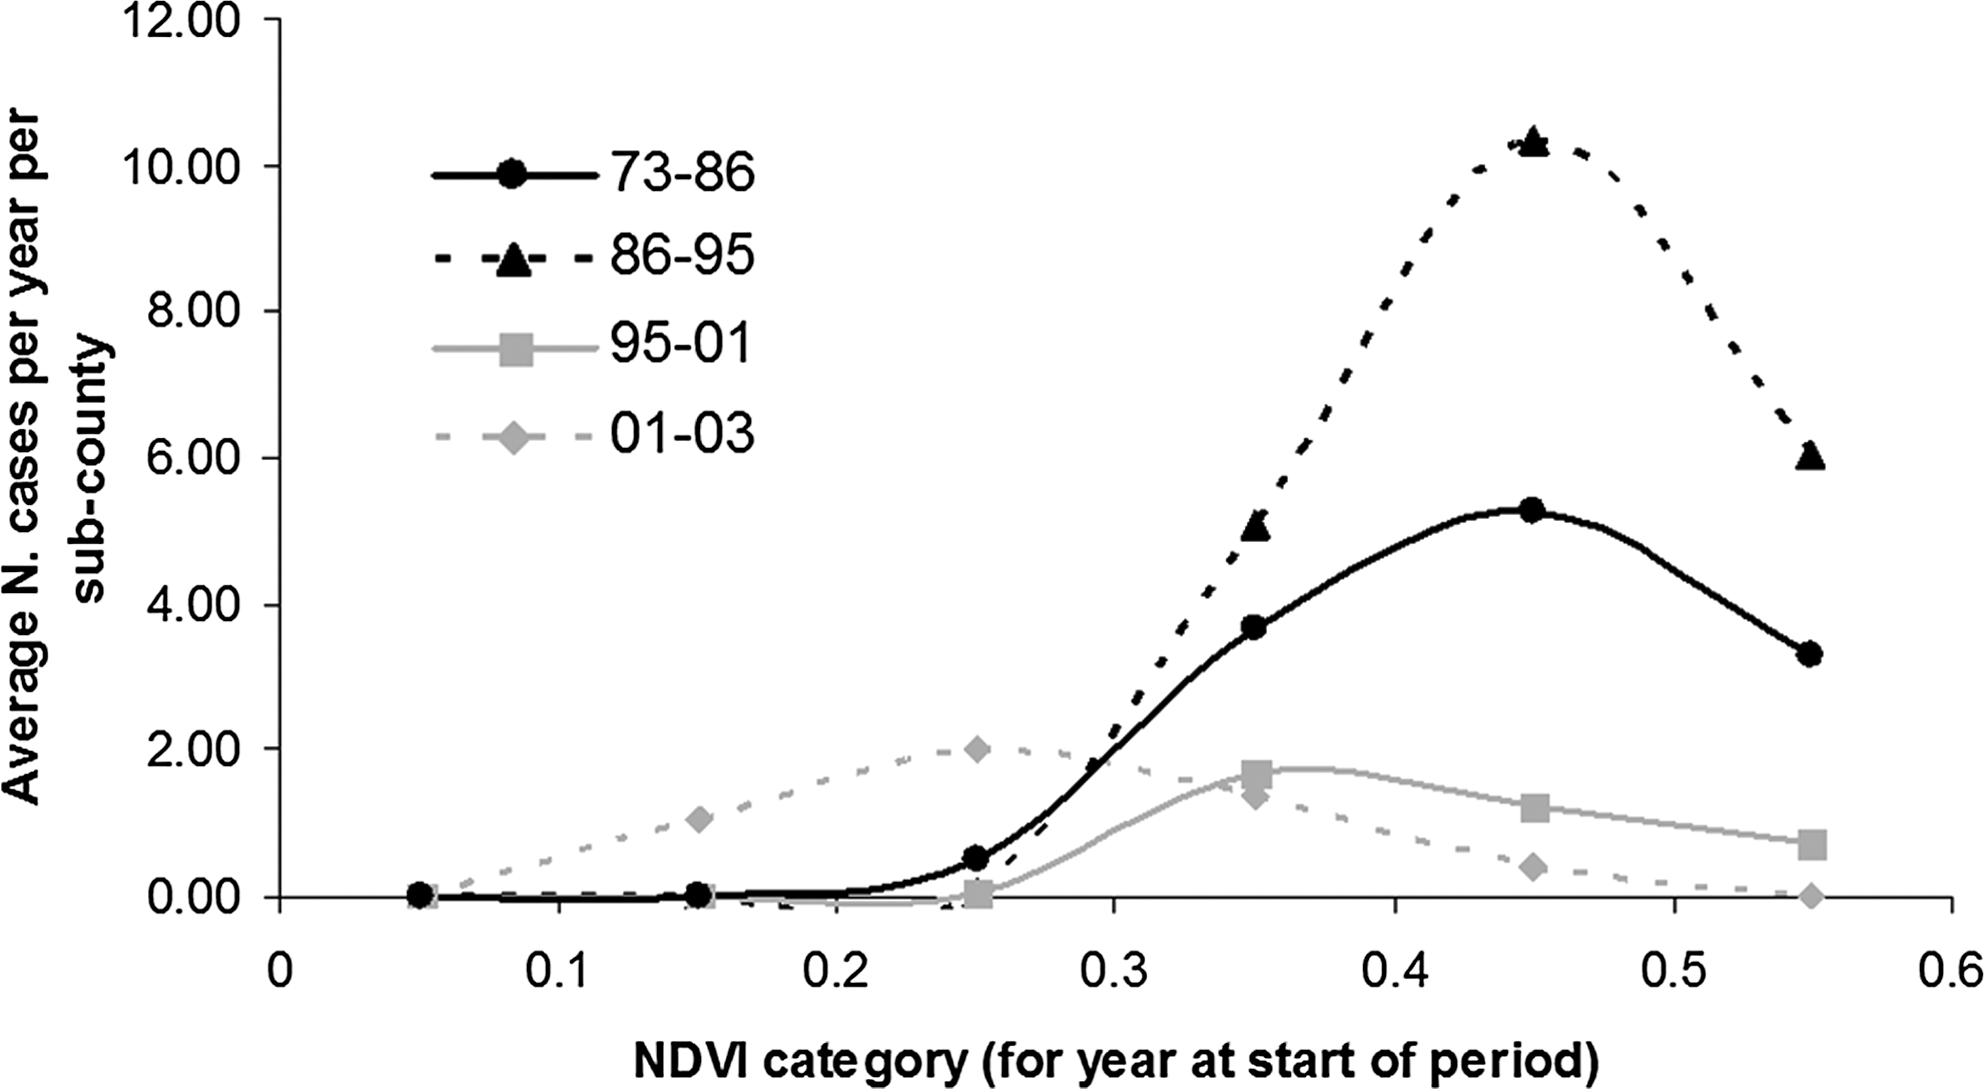
Sleeping sickness incidence by vegetation density (NDVI) for four time periods, 1973–1986, 1986–1995, 1995–2001, and 2001–2003. Data include the mean annual number of sleeping sickness cases per subcounty in the years following the available land cover image. For 1970–1980s data, ordinal sleeping sickness values are converted to case counts using the minimum of the ordinal range. This conservative calculation of 1970s case counts accounts for the lower curve for 1973–1986. The magnitude of the 1973–1986 curve should therefore not be compared to the later curves.
Discussion
The reliability of sleeping sickness data for the 1970s and 1980s is subject to detection and recording bias associated with periods of passive surveillance, missing record books, and recall bias of interviewees. The creation of additional treatment centers over the study period, and differential quality of diagnostic and treatment facilities throughout the study area may contribute to spatial bias in the data. Odiit et al. (2004a, 2004b, 2005) discuss the potential for misdiagnosis of cases, selective entry bias around treatment centers, and underdetection of sleeping sickness. Aggregation of cases by subcounty reduces the potential for clustering around individual treatment centers to some extent, and unless differential misdiagnosis occurs, it will not critically affect analyses.
The use of subcounty averages for vegetation (NDVI) results in the aggregation of intra-subcounty variation in vegetation; intra-subcounty variation was, in fact, higher than inter-subcounty variation, bringing into question the use of subcounty means as a proxy for subcounty vegetation, and suggesting that despite significant correlations at this scale, finer resolution analyses will be needed to validate the preliminary results presented here. Research by Odiit et al. (2006) at the village level has indeed shown that associations between moist vegetation and sleeping sickness incidence are observed at a finer spatial scale in southeastern Uganda. While within-subcounty variation in vegetation is high, this variation may remain within ranges appropriate for tsetse habitat, and subcounties with average vegetation levels in appropriate habitat ranges might be expected to have an increased probability of supporting tsetse populations and higher vector densities, and promoting higher transmission rates. Region-wide analyses such as those presented here allow consideration of a wider range of vegetation variation generally only observed at broad spatial scales; obtaining time-series data for this spatial scope is not feasible with finer resolution data in southeastern Uganda. As noted by Rose (2001), McMichael (1999), and Plowright et al. (2008), there may be insufficient risk factor variation at finer scaled to detect transmission risk processes occurring at the population level; in this context, an ecological approach to detecting population-level variation in vegetation and sleeping sickness incidence at the subcounty scale is appropriate for identifying processes not observable with finer resolution data or validating processes for translation across scales.
Conversion of ordinal data to minimum case counts reduces precision in the data, variation in the model, and statistical power to detect associations; this is expected to bias the model toward the null. Cattle and pig density data have unknown reliability. These variables, as well as livestock infection data, were only available for the 2000–2003 time period), precluding temporal analyses of these predictors. Livestock infection with T. brucei is not necessarily an accurate proxy for prevalence of human-infectious T.b. rhodesiense, and may be confounded by low diagnostic sensitivity and high rates of mis-classification between T. brucei and Trypanosoma vivax (Cox et al. 2005). These data reliability concerns will predominantly result in bias toward the null and reduced detection of associations. The spatial trend in the data can be considered relatively simple, reflecting a single central outbreak with radial diffusion (Berrang-Ford et al. 2006a). Analytical ability to statistically assess temporal trends in the data was constrained by inconsistent temporal data availability for predictor variables and temporal variation precluding reliable interpolation. This will bias results toward identification of predictor variables whose variation is predominantly spatial and occurring between subcounties. The data must be interpreted with caution in the context of data reliability and potential biases. Results should be considered exploratory and heuristic. The results are, however, useful for characterizing broad trends; where historical trends in processes observed are consistent with hypotheses, results can inform current and future research.
These results indicate that the highest risk of continuing sleeping sickness infection and incidence in Uganda are likely to be located in areas that have moderate vegetation cover. The results do not provide evidence to support the significant role of vegetation change as a determinant of disease presence or incidence at this scale, though it is difficult to separate the causal contributions of absolute vegetation cover and vegetation cover change given strong correlations between variables. While the results presented here do not support the significant role of vegetation change at the scales evaluated, finer-scale land cover changes occurring on the scale of months to years within localized areas may contribute to increased risk of transmission. The use of temporal land cover data at the decadal resolution necessarily provides opportunity to evaluate only broad temporal patterns and processes. These data do not capture potentially significant temporal determinants associated with seasonal or annual variation, which may be important in detecting vector habitat dynamics. This analysis, while thus sacrificing resolution, aimed explicitly to capture a period spanning the full epidemic cycle. Standardizable, comparable, and reliable historical land cover data are unavailable at finer resolutions for the years of peak incidence during this epidemic.
The results indicate temporal differences in the NDVI levels at which maximum disease incidence occurred throughout the epidemic period. These results indicate that sleeping sickness, and by extension its competent vector habitat, is supported at lower vegetation densities in more recent years. The reasons for these differences are unclear; two possible explanations are presented here. First, this may be a purely spurious spatial trend; as the disease spread northward and intervention increased (and incidence decreased) in more vegetated lakeshore regions, the recorded peak densities of remaining affected districts may have simply been skewed toward newly affected northern regions with lower NDVI values.
Alternatively, this trend could reflect real differentials in transmission risk between regions affected early and later in the study period. The results are consistent with the hypothesis proposed by Berrang-Ford et al. (2006a) that there may be two dominant processes affecting transmission risk in Uganda. In southern regions, where there is a history of infection and parasite presence, transmission was generally maintained below epidemic levels until the commencement of the epidemic in 1976. Uganda in the 1970s and 1980s experienced extensive internal displacement of the rural population, illegal human and cattle movements, abandonment of cotton and coffee plantations, and collapse of sleeping sickness prevention and control activities (Matovu 1982, Abaru 1985, Mbulamberi 1989, Berrang-Ford 2007). These events likely contributed to increased human–vector contact and sleeping sickness transmission in southern lakeshore districts. In these areas, where there is already a well-established presence of vectors, parasites, and an infected cattle reservoir, higher vegetation densities and tsetse populations may be required to promote incidence increase. In contrast, more recent incidence has been recorded in northern districts where vegetation densities are generally lower than the lakeshore (Fèvre et al. 2001, Berrang-Ford et al. 2006a, WHO 2006). The introduction of the parasite into Soroti District, for example, has been linked to cattle restocking from affected southern districts (Fèvre et al. 2001). In these regions, introduction of the parasite into competent vector habitat—moderate vegetation densities—combined with negligible population experience with infection control and occurrence of civil conflict, may have been sufficient to promote transmission. If true, this hypothesis would suggest that the optimal vegetation density required for sleeping sickness transmission is, in fact, lower than indicated by the 1970s and 1980s curves in Figure 6. The range of optimal vegetation densities that could support transmission would thus need to be considered within the regional context with respect to previous and existing parasite presence, challenge, and intervention. The occurrence of transmission in northern, less vegetated regions of Uganda raises the potential for wider spread of disease well beyond the highly vegetated lakeshore region; this potential is supported by recent publication of archival sleeping sickness data from 1900 to 1920 identifying extensive spatial distribution of infection within the country (Berrang-Ford et al. 2006b).
It is difficult to predict the implication of these results for Uganda's unaffected districts; negligible data are available for these areas on cattle infection and cattle densities. No large-scale tsetse mapping has been conducted for the whole country since 1969; current tsetse maps for Uganda are based on models integrating 1969 tsetse maps and satellite-derived vegetation indices (Department of Lands and Surveys 1971, Robinson, personal communication). There are unconfirmed reports of tsetse spread and re-invasion through much of Uganda (Luyimbazi, personal communication), though no widespread mapping is available to confirm this. Sleeping sickness and trypanosomiasis projects have predominantly focused on the southeastern districts south of Lake Kyoga (Fig. 1). These areas, however, have experienced on-going decline in incidence, while increased spread has been observed in Soroti and surrounding north-central districts (Berrang-Ford et al. 2006a). Given this trend, Uganda's central districts on the current border of spread, including Kumi, Lira, Apac, and Katakwi may be at particular risk of new infection. Southern Apac and much of Kumi, in particular, have relatively high vegetation cover. These conclusions are supported by reports of outbreaks in Kaberamaido, Kumi, and Lira Districts, and continuing recent spread into central Ugandan districts (WHO 2006, Ministry of Health 2008).
Footnotes
Acknowledgments
This work was supported by a grant from the International Development Research Centre (IDRC), Ottawa, Canada, and by the National Science and Engineering Research Council of Canada (NSERC). We thank Dr. Martin Odiit (formerly Ministry of Health, Uganda), Dr. Dawson Mbulamberi and Dr. Abbas Kakembo (Ministry of Health, Uganda), Dr. Faustine Maiso (formerly World Health Organization, Kampala), Dr. Freddie Kansiime and Mr. Albert Mugenyi (Coordinating Office for the Control of Trypanosomisis in Uganda), Mr. Fred Luyimbazi (Ministry of Agriculture, Animal Industry and Fisheries), and Dr. Miriam Nanyunja (formerly World Health Organization, Kampala) for research contributions and support; Glen Green (CIPEC) for remote sensing support; and the late Dr. Thomas Gitau for early research development.
Disclosure Statement
No competing financial interests exist.