




Abstract
To assess the potential impact of oral rabies vaccination (ORV) on the occurrence of raccoon rabies in the mid-Atlantic region, temporal and seasonal trends of raccoon rabies cases reported in West Virginia from 1990 to 2007 were identified with both descriptive statistical analysis and exploratory time series analysis. Raccoon rabies cases in the non-ORV region maintain an enzootic pattern and increase over time; a bimodal seasonal pattern is observed with a large peak in April and a smaller peak in August. The results of the model indicate that the effect of the ORV intervention to control raccoon rabies was statistically significant. ORV should be attempted in other enzootic raccoon rabies areas.
Introduction
Raccoons were first implicated as a rabies reservoir species in Florida in 1947 (Scatterday et al. 1960). Rabies spread slowly in the southeastern United States before the translocation of infected raccoons into the mid-Atlantic states in the late 1970s (Nettles et al. 1979). Once established in this naive population, rabies spread northward and westward rapidly at about 40 km per year, becoming enzootic throughout most of the eastern United States by 1995 (Rupprecht and Smith 1994, Blanton et al. 2007). In addition, significant spillover of the raccoon rabies virus variant to other mammals occurs (Bacon 1985). A strong association between risks of rabies virus spillover to cats and the temporal dynamics of raccoon rabies has been identified (Gordon et al. 2004). The increase of raccoon rabies and the spillover of raccoon rabies to other species have raised major public health concerns about an increased risk for rabies virus transmission to the human population because raccoons are well adapted to living in urban and suburban environments (Hoffman and Gottschang 1977, Rosatte et al. 1992).
Since 1997, Wildlife Services, the U.S. Department of Agriculture, has been working cooperatively with local, state, and federal governments to manage rabies in wild carnivores. In response to the spread of raccoon rabies, an oral rabies vaccination (ORV) zone has been established from Maine to Alabama in an attempt to prevent the westward spread of raccoon rabies and to control its spread to humans, domestic animals, and other wildlife. As part of a nationwide cooperative effort focused upon the Appalachian Ridge region, the West Virginia ORV program was initiated during September 2001. From 2001 to 2007, more than 10 million ORV baits containing vaccinia-rabies glycoprotein vaccine were distributed by air via fixed-wing aircraft and by hand via ground operation in this area (Table 1). The temporal dynamics of raccoon rabies in the central counties within the ORV zone experienced preepizootic and epizootic stages before the initiation of the ORV program, while raccoon rabies in the eastern counties outside the ORV zone was enzootic throughout this period. These data from the West Virginia counties provided a unique opportunity to compare raccoon rabies temporal patterns between areas with and without ORV intervention, as well as before and after ORV intervention, within the vaccination zone.
To gain insights into the spatial-temporal occurrence of rabies in the mid-Atlantic region, raccoon rabies cases reported in West Virginia from 1990 to 2007 were analyzed with descriptive statistics and exploratory time series analysis. The objectives of this study were to (1) compare raccoon rabies temporal patterns between areas with and without ORV intervention; (2) detect long time-scale temporal trends and 12-month seasonal periodicity in the raccoon rabies time series; (3) develop a model for forecasting future trends of raccoon rabies in the West Virginia eastern counties without ORV intervention; and (4) statistically test the effect of ORV intervention to contain raccoon rabies. The rationale for this study was an attempt to provide statistical support for developing cost-effective strategies for the prevention and control of raccoon rabies via ORV.
Materials and Methods
Surveillance data
The National Notifiable Disease Surveillance System has consistently collected animal rabies data from individual counties within each state in the United States for more than 50 years. Human and animal rabies cases are reportable in all states in the United States (Childs et al. 2007). Each state submits monthly results of laboratory tests for rabies to the Centers for Disease Control and Prevention (CDC). Electronic data were available starting in 1990. Available data included date of occurrence, monthly count data for every county, laboratory test results, and species. This study examines only rabies reported in raccoons from 1990 to 2007 in West Virginia. Spatial distribution of raccoon rabies (average number of raccoon rabies cases per year by county) in West Virginia during the period of 1990–1997, 1998–2002, and 2003–2007 is shown in Figure 1.
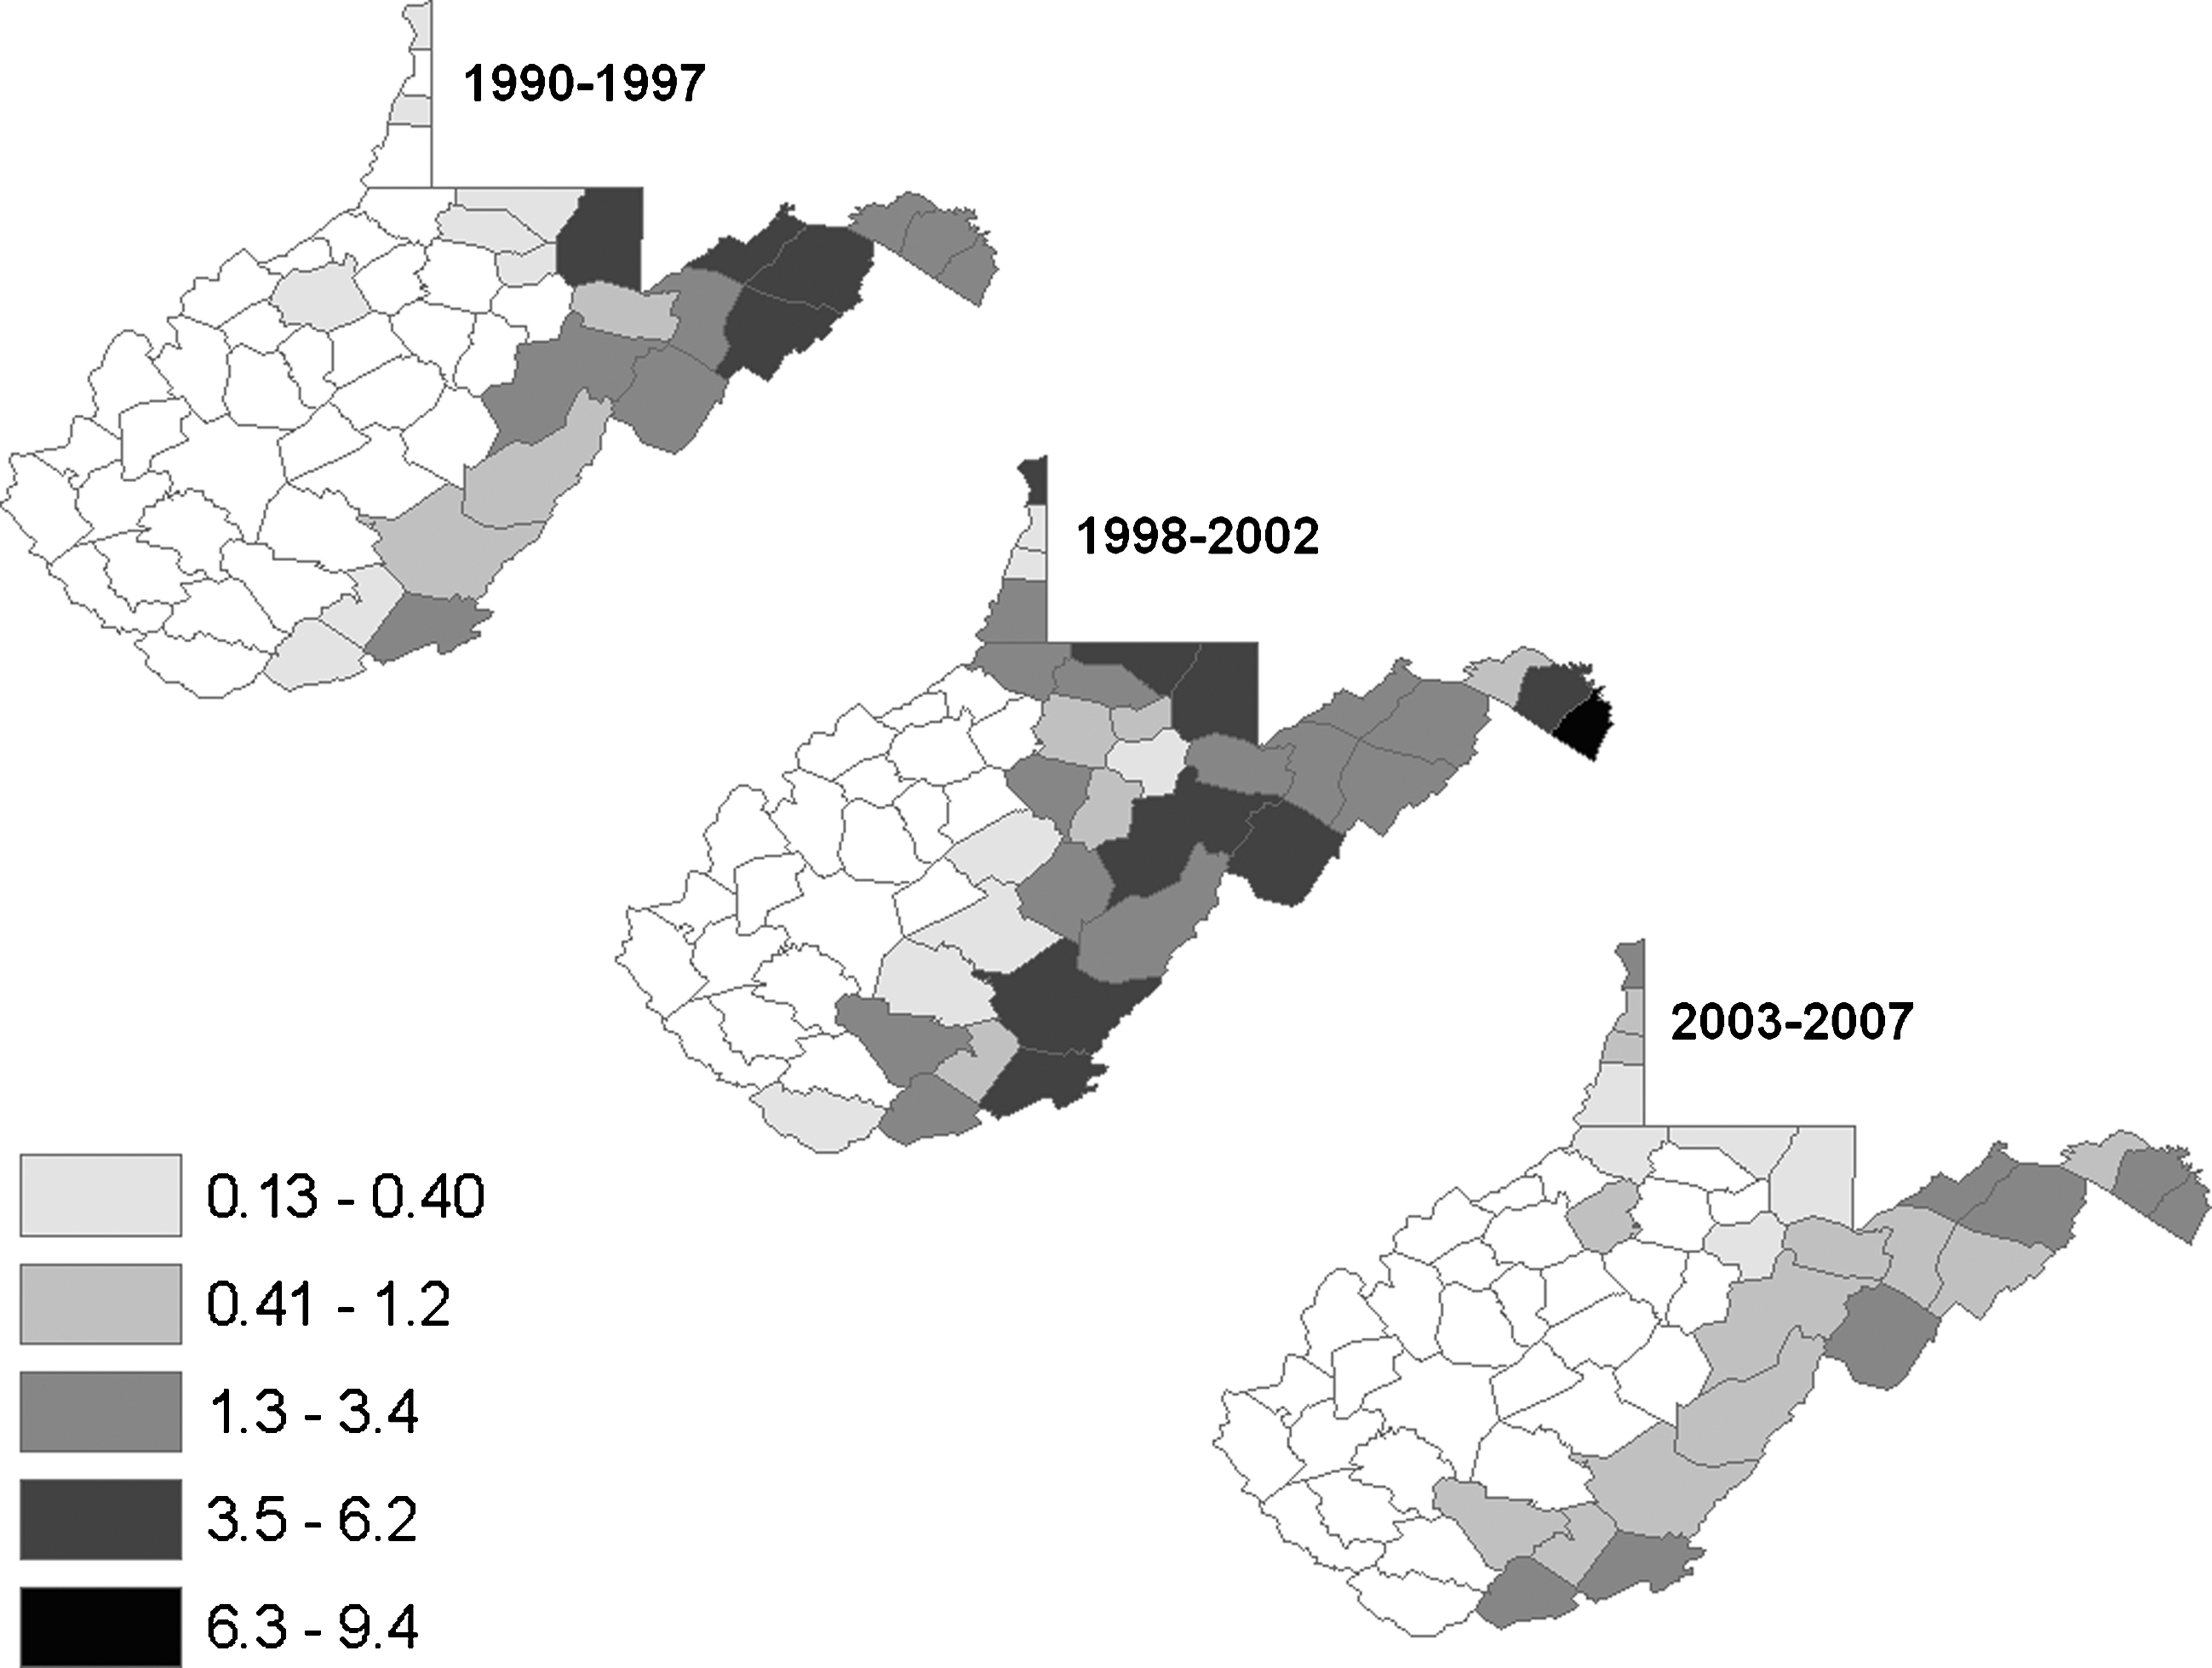
Spatial distribution of raccoon rabies (average number of raccoon rabies cases per year by county) in West Virginia during 1990–1997, 1998–2002, and 2003–2007.
Study area
In West Virginia, raccoon rabies cases were first reported during the late 1970s in the eastern portion of the state, presumably due to the first translocation of rabid raccoons into the mid-Atlantic states. To contain raccoon rabies and stop the westward spread of this disease into unaffected regions, an ORV program was initiated during September 2001 in several central West Virginia counties.
Data from 55 counties in West Virginia were reviewed for this study. From 2001 to 2007, ORV was used in 27 central counties where raccoon rabies cases were reported, 16 of which were completely in the ORV zone during the period of 2002–2007. Fifteen eastern affected counties and 13 western counties that remained free of raccoon rabies were not included in the ORV zone. Both Tucker and Randolph counties are at the edge of the ORV zone and have very small area within the ORV zone; thus, they were grouped into the 15 eastern affected non-ORV counties. The 13 western counties where no raccoon rabies was reported and 11 central affected counties that were only partially exposed to ORV were excluded from this study (Fig. 2).
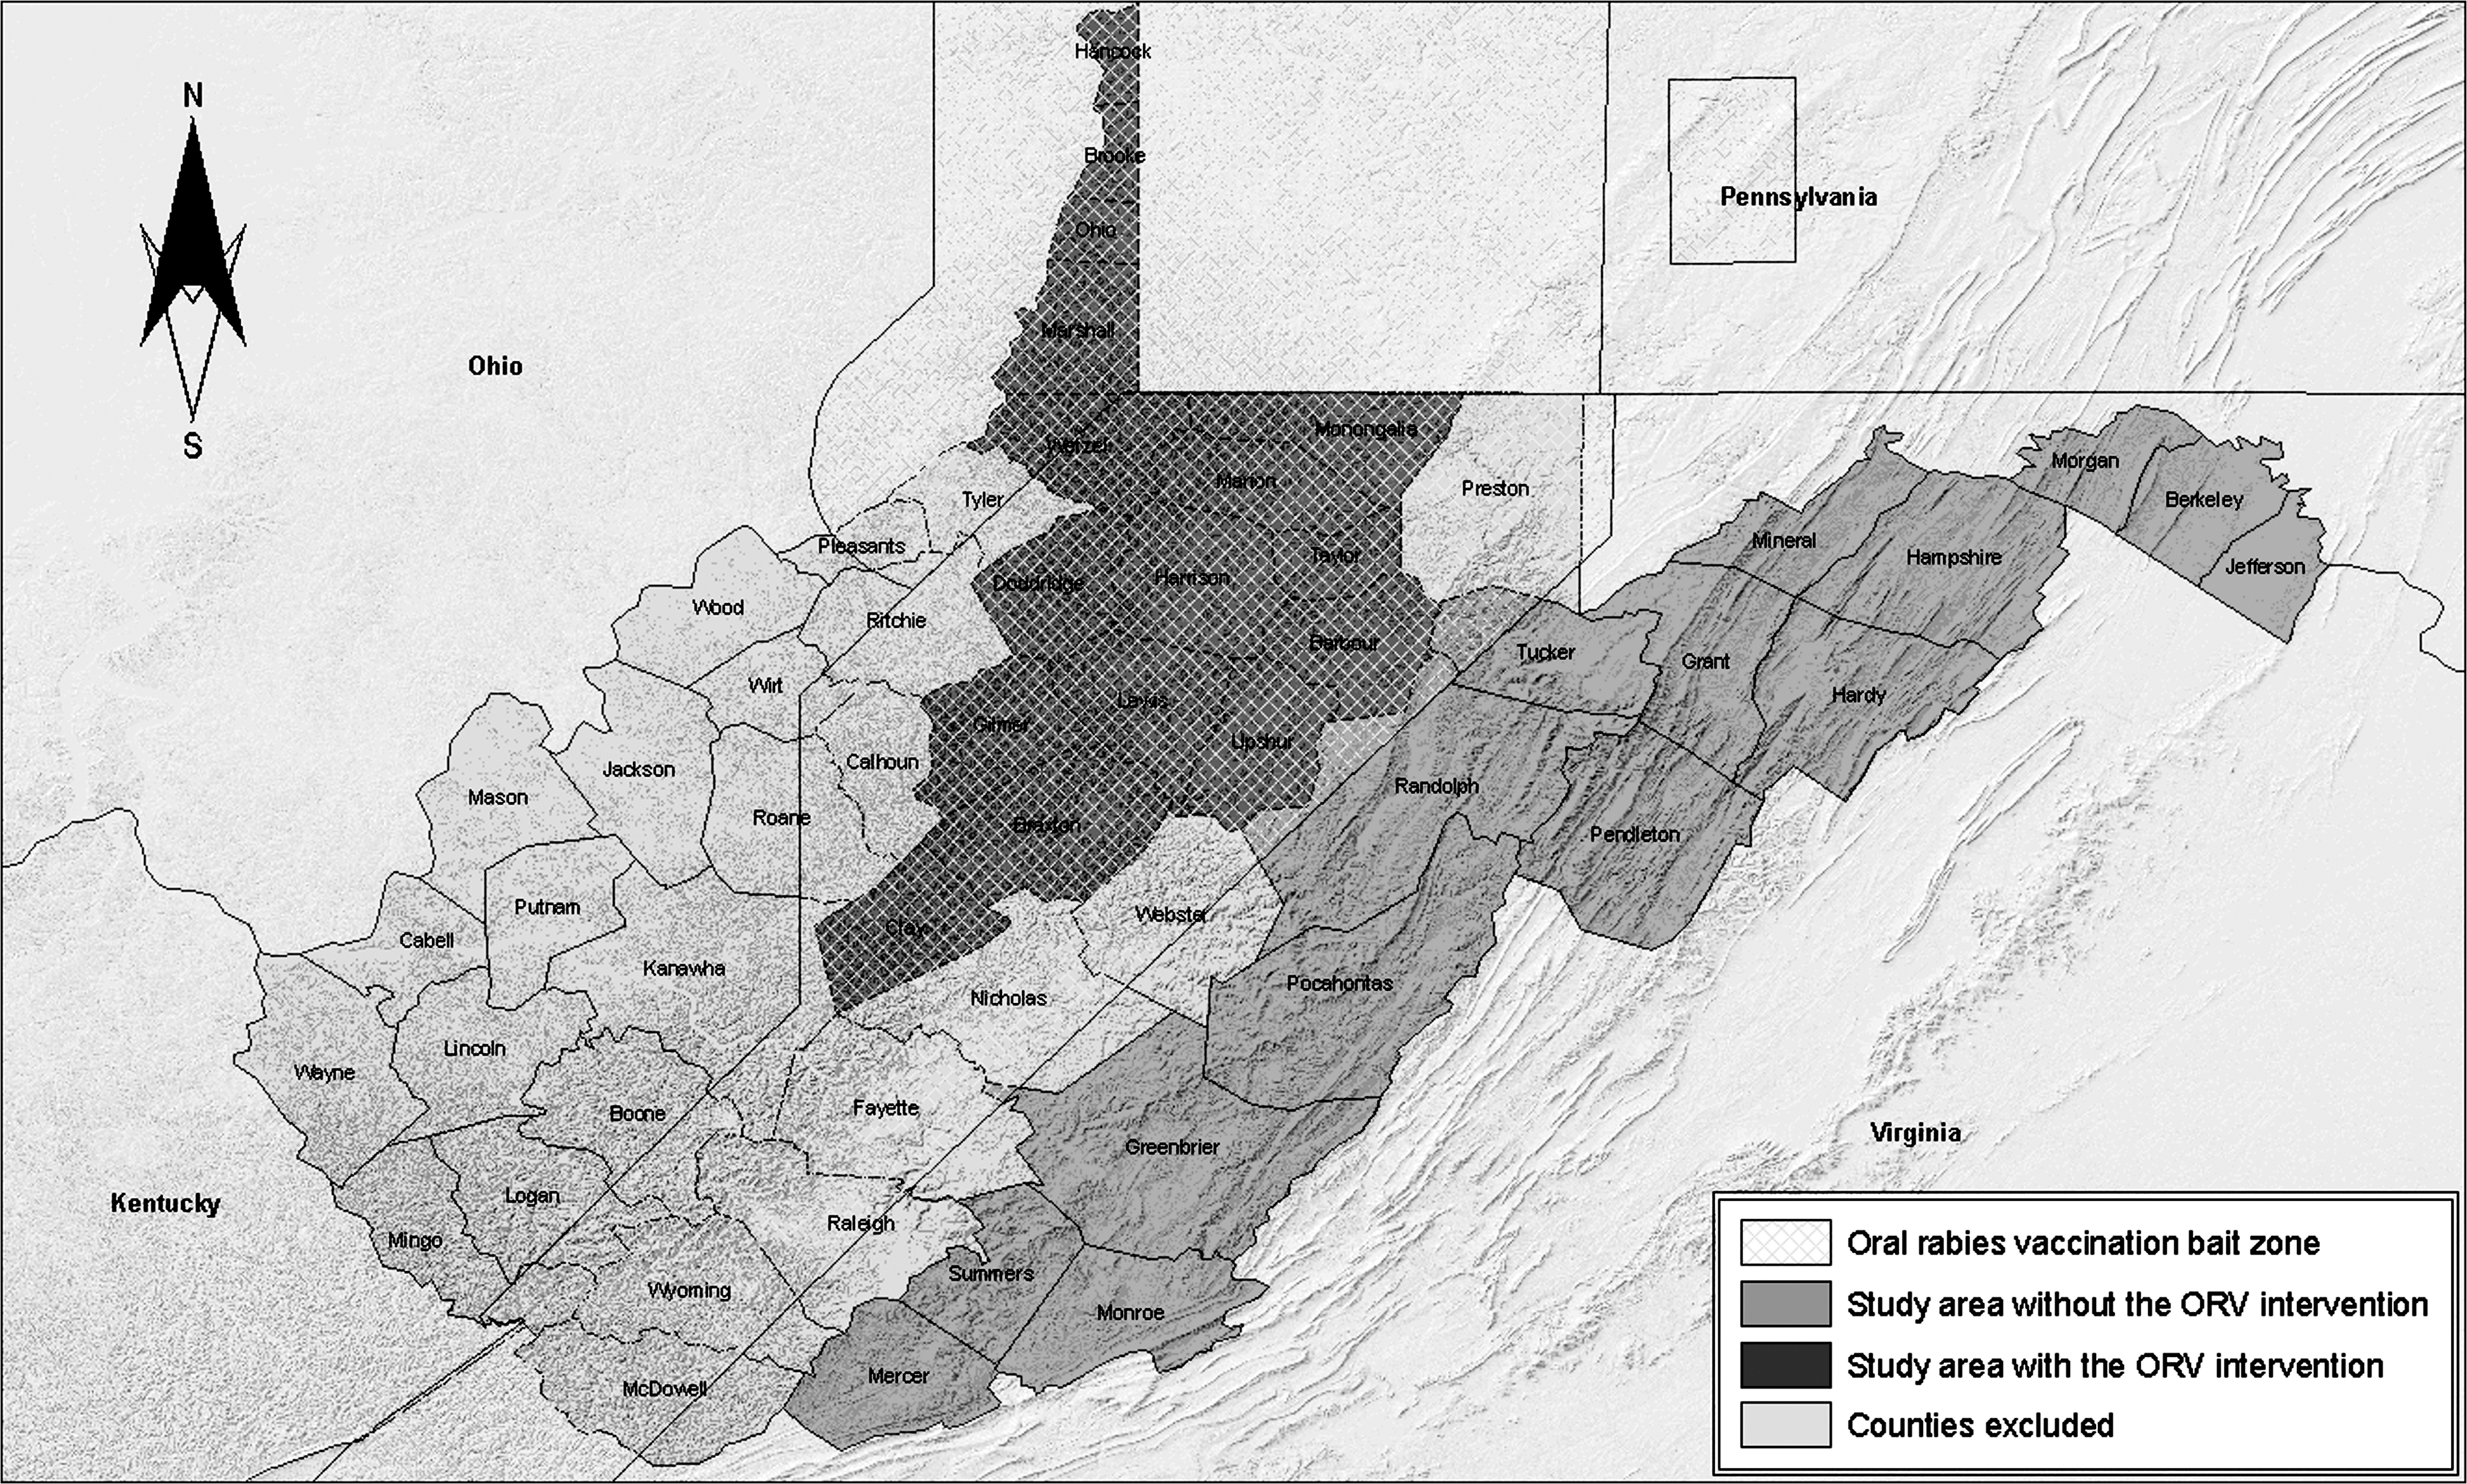
Oral rabies vaccination (ORV) baits zones (2004) and study areas in West Virginia.
Data from the 16 central affected counties within the ORV zone (hereafter, named as the ORV area, 12,538 km2) and the 15 eastern affected non-ORV counties (hereafter, named as the non-ORV area, 21,209 km2) were used to examine the potential effect of the ORV program and in an attempt to predict future trends of raccoon rabies.
Descriptive analysis
The monthly rabies cases time series consisted of two components: a deterministic component including temporal trends and 12-month seasonal periodicity, and random error. The temporal trend and the seasonal periodicity for the time series were identified using descriptive analysis. The annual average number of cases per month in year i was calculated by
Time series analysis
To further explore long-term trends and seasonal variation, and to forecast future occurrence of raccoon rabies, the following autoregressive moving-average (ARMA) models were fit to the data that were assumed to be stationary time series:
For the monthly rabies case time series from the non-ORV area, the mean cases may have a linear trend over time and depend on the month of the year (Fig. 3a). The deterministic component {μ
t
} was described as
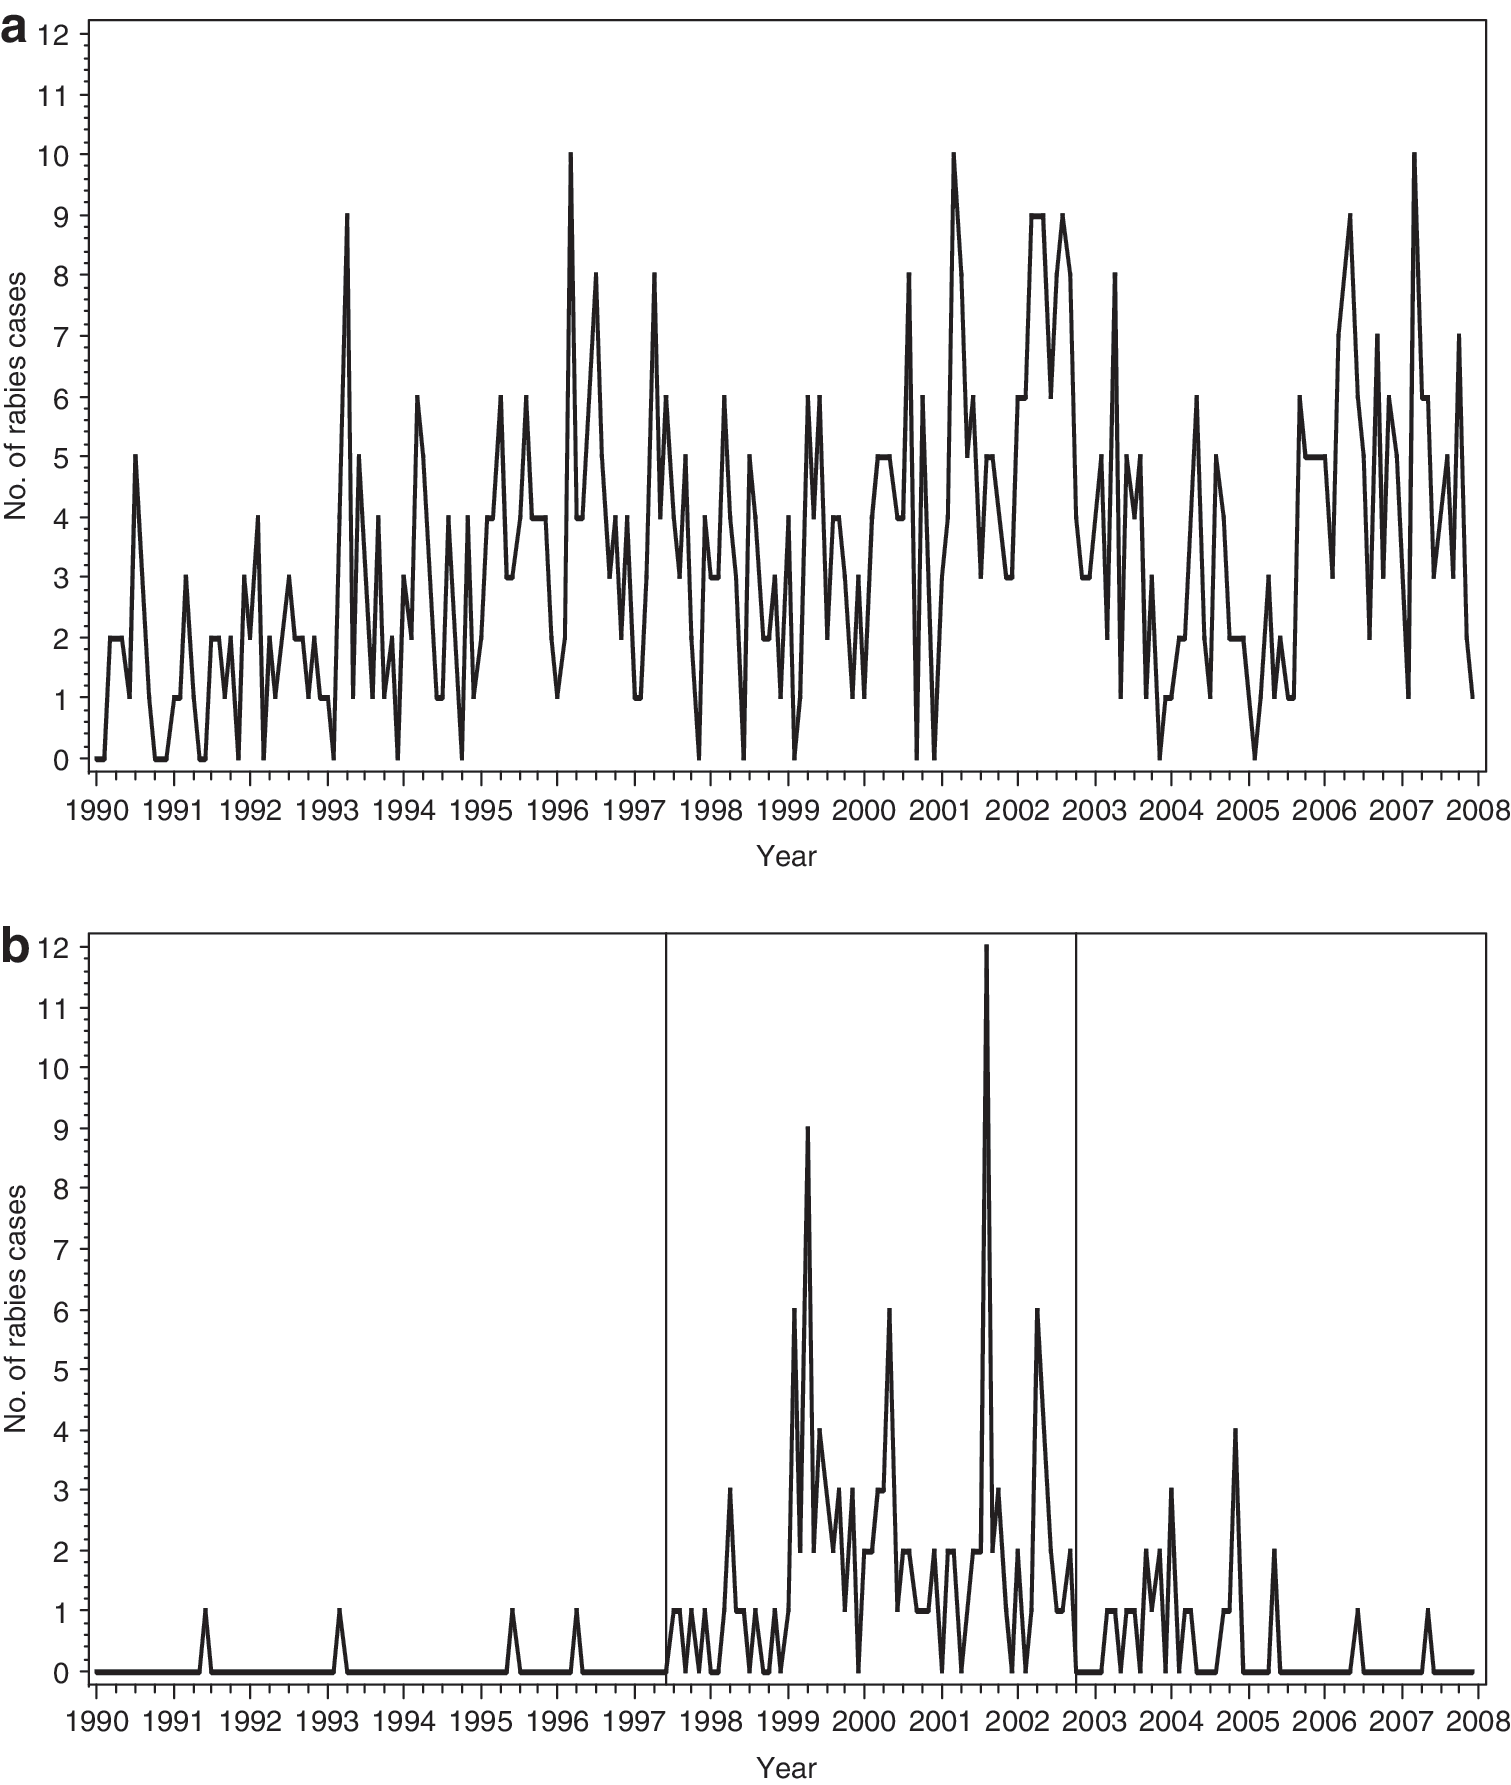
Monthly number of raccoon rabies cases in the 15 eastern counties without the ORV intervention
For the rabies case time series of the ORV area, the same modeling approach was used for intervention analysis. The ORV intervention affected the linear trend, and the deterministic component had the following regression form:
Maximum likelihood estimation method was applied when searching the appropriate p and q and estimating parameters (SAS Institute Inc. 2004) of the models for these two areas. The resulting model for the non-ORV area was used to forecast the monthly number of raccoon rabies cases in that area during the period of 2008–2009.
Results
Temporal trends
Raccoon rabies cases were reported early in the non-ORV area. In this area, 735 raccoon rabies cases were reported during 1990–2007 and the monthly number of raccoon rabies cases maintained an enzootic pattern over the entire period (Fig. 3a). The annual number of raccoon rabies cases first peaked in 1996 with a total of 53 cases (4.4 cases per month), followed by a decrease in 1997 and 1998, before increasing again to a second and highest peak in 2002 with a total of 80 cases (6.7 cases per month). After decreasing over the period of 2003–2005, raccoon rabies reached the third peak in 2006 with a total 66 cases (5.5 cases per month) (Fig. 4).
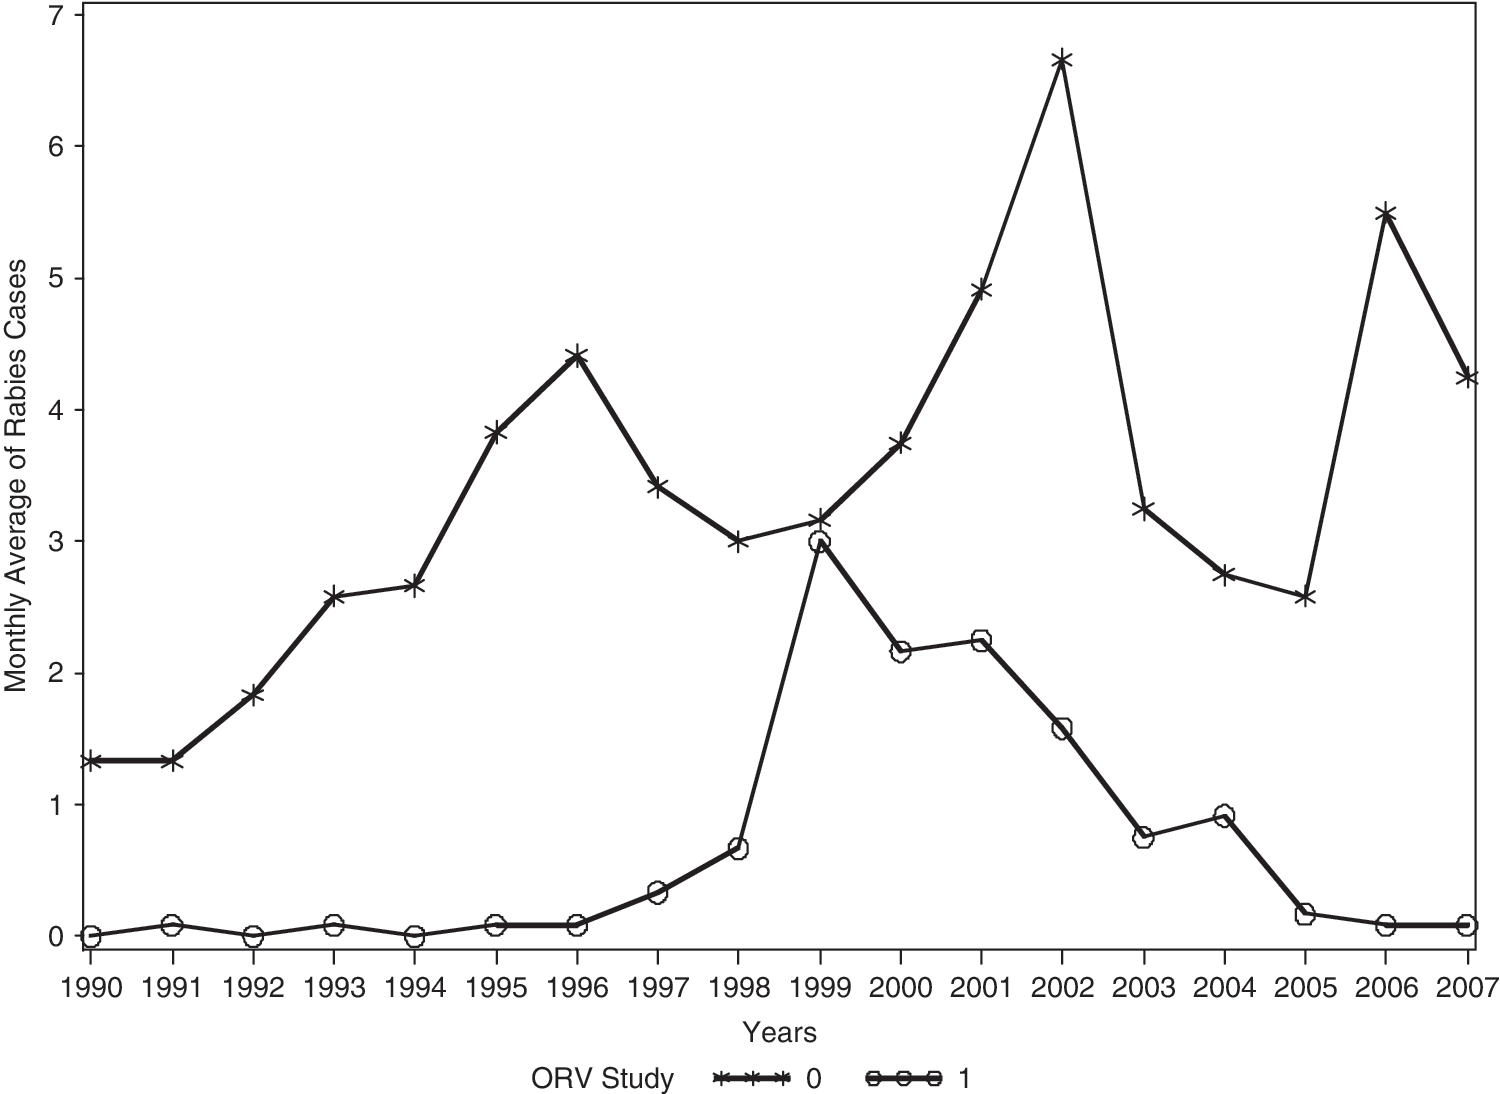
Annual mean of raccoon rabies cases per month in each year for the 16 central counties in the ORV zone (1) and for the 15 eastern counties without the ORV intervention (0) in West Virginia, 1990–2007.
In the ORV area, 148 raccoon rabies cases were reported during 1990–2007. The temporal course of monthly raccoon rabies in this area was divided into the preepizootic, epizootic, and ORV bait distribution subperiods (Fig. 3b). The preepizootic subperiod extended from January 1990 through June 1997, in which only sporadic cases of raccoon rabies occurred with a total of four raccoon rabies cases or approximately 0.5 cases per year. The epizootic subperiod began on July 1997 and continued until September 2002, when ORV intervention was intensively applied. During this epizootic period, the occurrence of rabies rapidly increased to a peak in 1999 with 36 cases (approximately equivalent the eastern region in that year). The total number of raccoon rabies cases was 120 in that period or approximately 23 cases per year, nearly 46 times the average yearly number of cases in the preepizootic period. The ORV bait distribution subperiod extended from October 2002 to December 2007, in which the prevalence of raccoon rabies dropped with a total of only 24 raccoon rabies cases or approximately 5 cases per year. In the last 2 years of ORV intervention (2006–2007), raccoon rabies showed almost the same temporal pattern as that in the preepizootic period.
Seasonal trends
For the non-ORV area, average monthly raccoon rabies cases were calculated over the entire period of 01/1990–12/2007. In this area, the largest number of raccoon rabies was reported during April. Raccoon rabies also reached a smaller secondary peak in August (Fig. 5).
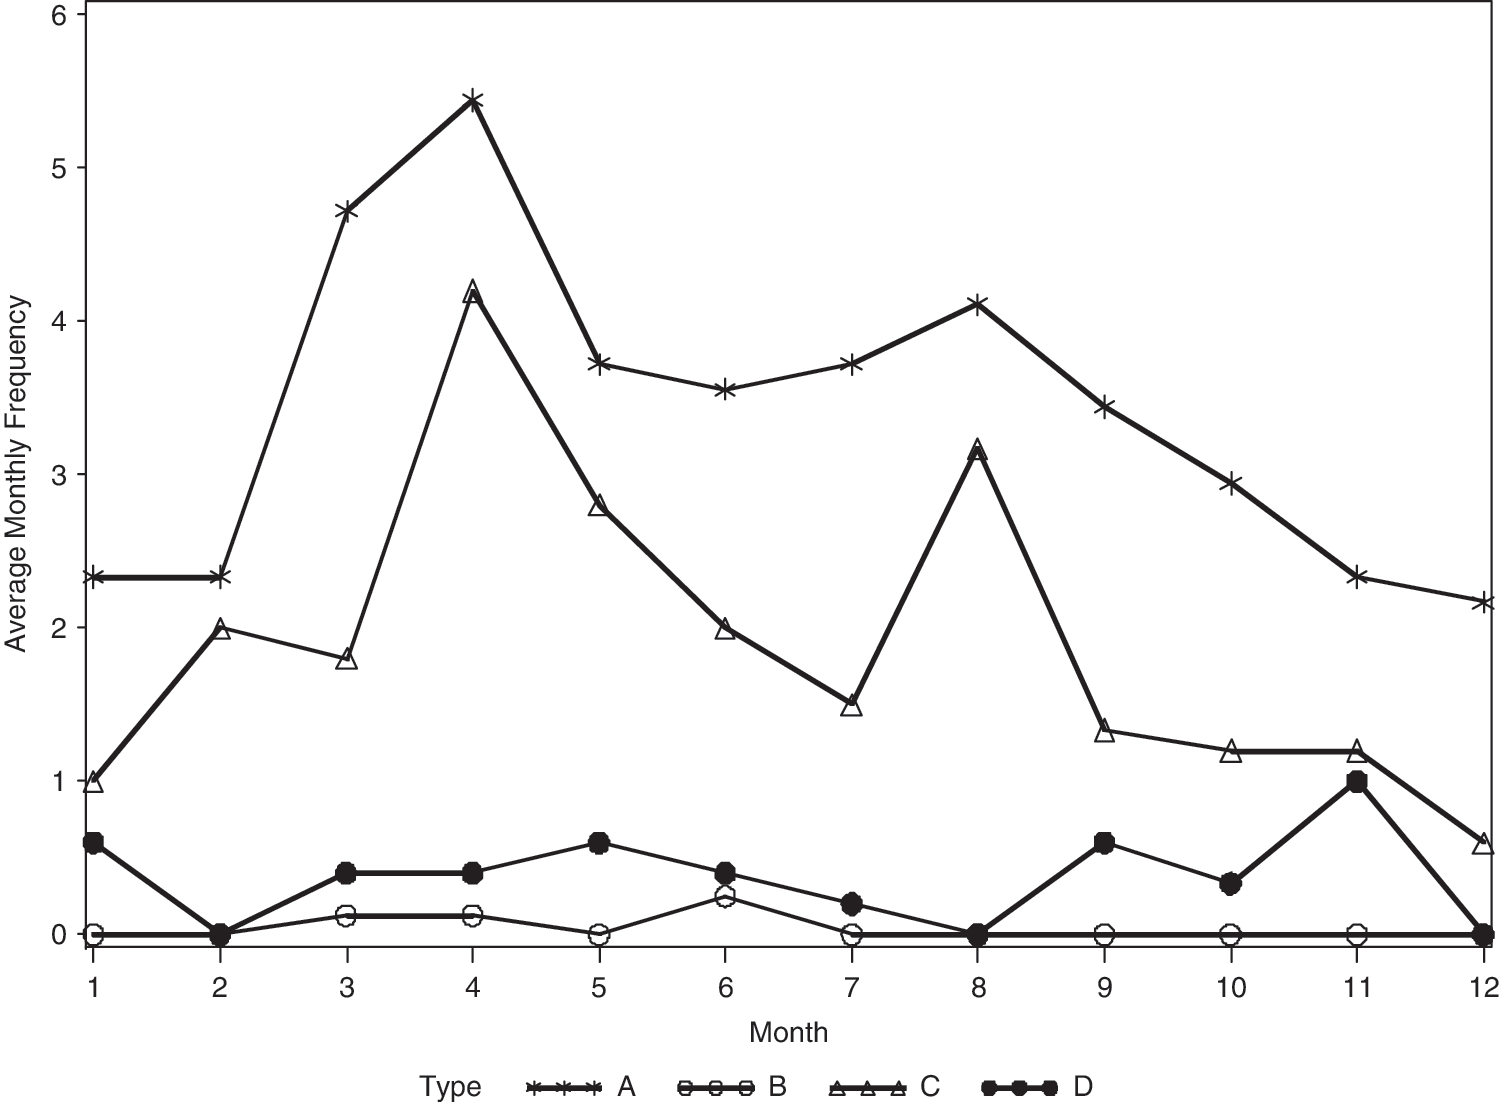
Trends of mean monthly raccoon rabies cases in the 15 eastern counties without the ORV intervention in the period of 01/1990–12/2007 (type A) and in the 16 central counties in the ORV zone in the preepizootic (01/1990–06/1997), epizootic (07/1997–09/2002), and ORV baits distribution (10/2002–12/2007) subperiods (type B, C, and D, respectively).
For the ORV area, average monthly raccoon rabies cases were calculated over each of the preepizootic, epizootic, and the ORV baits distribution subperiods. During the epizootic subperiod, raccoon rabies exhibited similar seasonality pattern as the non-ORV area with a large peak in April and a smaller peak in August. During the ORV baits distribution subperiod there were no peaks of raccoon rabies in this central area, and the seasonal pattern was similar to that in the preepizootic subperiod, with few cases of raccoon rabies reported (Fig. 5).
Time series analysis for the non-ORV area, 1997–2007
Plots of autocorrelations and partial autocorrelations revealed that an AR (2) model defined as an ARMA with p = 2 and q = 0 should fit the data for monthly raccoon rabies cases in the non-ORV area. To assess the impact of seasonal variation in rabies cases, the fit of model (2) was compared to the fit of a reduced model where dummy variables for all months were dropped from the model. A likelihood-ratio test indicated that there was a significant seasonal pattern (χ2 = 62.848, d.f. = 12, and p < 0.0001).
Maximum likelihood estimates of model parameters together with their standard errors are presented in Table 2. The positive autoregressive coefficients indicated that the number of rabies cases in a given month depended positively on the number of cases in the previous 2 months. Moreover, the rabies prevalence increased by an estimated 0.0129 cases per month. Finally, the seasonal terms indicated that peak rabies cases occurred during April and August.
All autocorrelations and partial autocorrelations of the model residuals were inside or very close to the 95% white noise bounds, and the residuals were considered as white noise, as expected if the model was adequate. The fitted model was used to forecast the monthly number of raccoon rabies cases during 2008 and 2009 (Fig. 6).
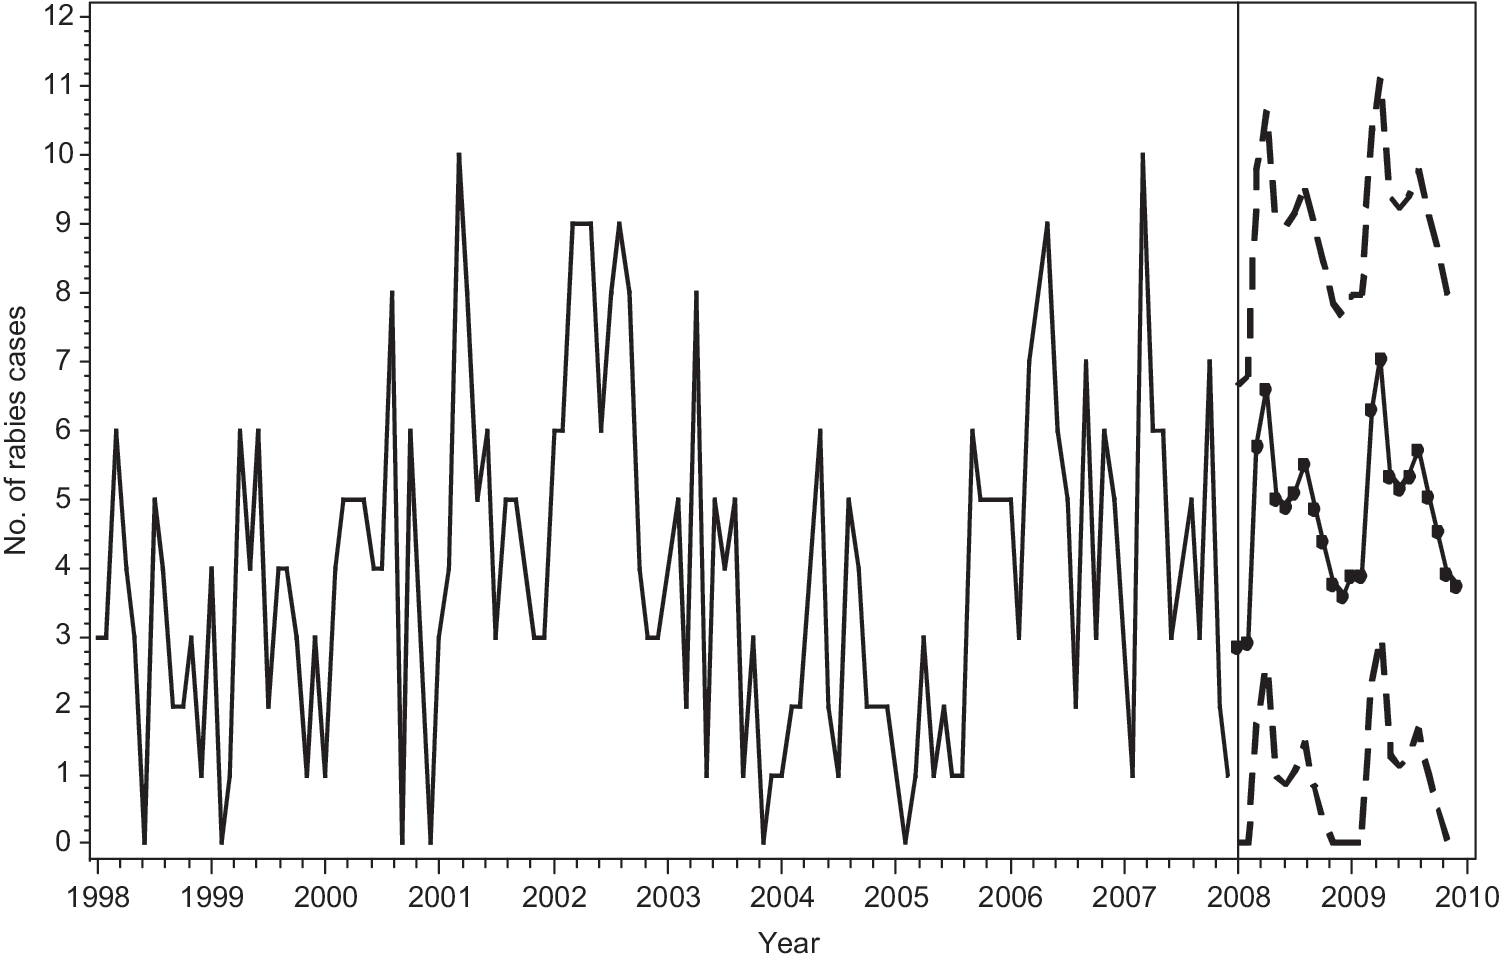
Forecast and 95% prediction intervals for raccoon rabies cases of each month of 2008–2009 in the 15 eastern counties without the ORV intervention in West Virginia.
Time series analysis for the ORV area, 1997–2007
In the ORV area, raccoon rabies during the epizootic subperiod exhibited similar patterns as the non-ORV area. Thus, model (2) with an AR (2) autocorrelation structure as for the non-ORV area was also fitted for this epizootic subperiod in the ORV area. With the fitted model, the monthly number of raccoon rabies cases in the next 48 months was forecast in this area, assuming no ORV intervention.
Based on the model, the monthly number of raccoon rabies in the ORV area would have increased over time if the ORV intervention had not occurred (Fig. 7). After the initiation of the ORV program, the monthly number of raccoon rabies decreased, suggesting that the ORV intervention decreased effectively the incidence of raccoon rabies in this area.
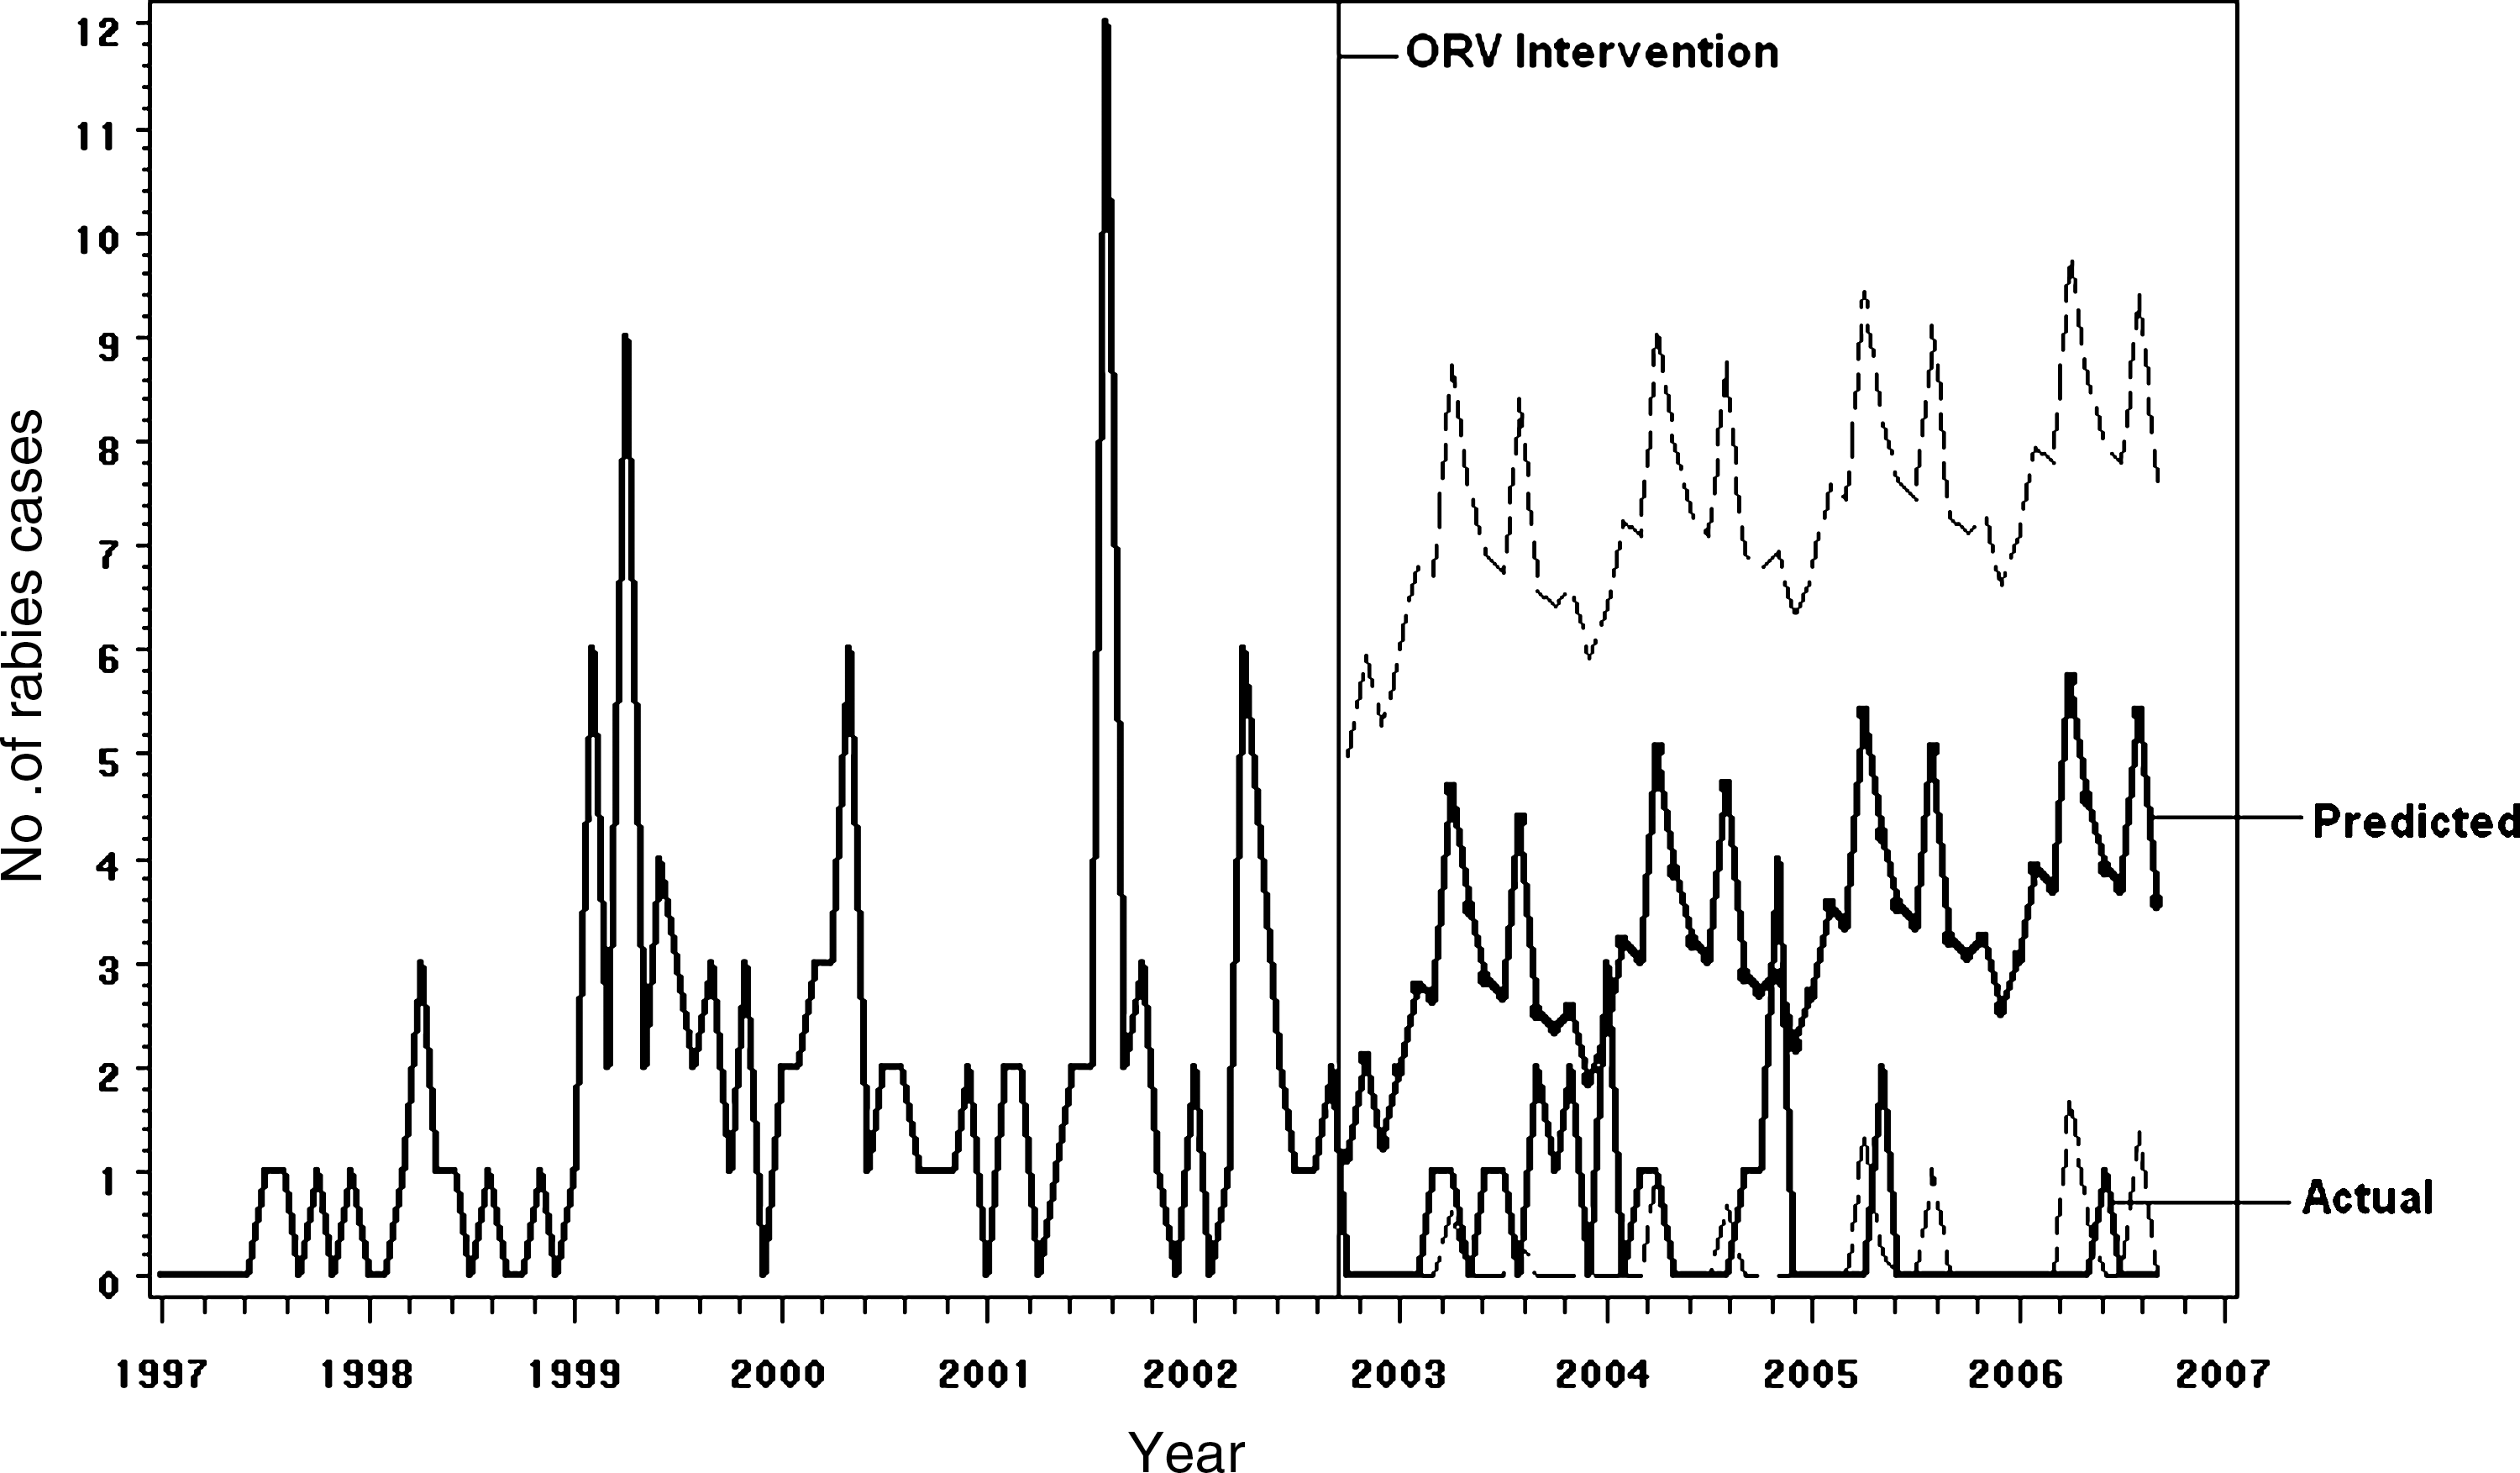
Forecasts and 95% prediction intervals for raccoon rabies cases of each month from 10/2002–10/2006, assuming no ORV intervention, and actual observed rabies cases in the 16 central counties in the ORV zone in West Virginia.
To test whether the ORV intervention was statistically significant, the intervention model (3) with an AR (2) autocorrelation structure was fitted to the data from the epizootic and ORV bait distribution subperiods. The positive autoregressive coefficients indicated that the number of rabies cases in a given month depended positively on the number of cases in the second preceding month (Table 3). The rabies prevalence increased by an estimated 0.0282 cases per month before ORV intervention. After ORV intervention, the rabies cases decreased at 0.004 cases per month.
All autocorrelations and partial autocorrelations of the residuals from the fitted model were inside or close to the 95% white noise bounds, and the residuals were considered to be white noise, suggesting that the model is adequate. These forecasts demonstrated the seasonal trend as well as a continued increase in rabies activity.
Discussion
The analysis indicated that monthly number of raccoon rabies cases had strong linear temporal trends in the non-ORV and ORV intervention areas. Raccoon rabies cases in the non-ORV area significantly increased over time (p = 0.0006; Table 2) at an estimated rate of 0.0129 cases per month (SE = 0.0037). The forecasted monthly number of rabies cases from the fitted model also suggested that raccoon rabies cases in this area would increase over time (Fig. 6). In the ORV area, raccoon rabies cases linearly increased over the epizootic subperiod (p = 0.0206; Table 3) at an estimated rate of 0.0282 cases per month (SE = 0.0122). However, raccoon rabies cases decreased with time during the ORV bait distribution subperiod at an estimated rate of −0.0040 cases per month (SE = 0.0054).
Raccoon rabies cases in the non-ORV area maintained an enzootic pattern throughout the study period. In the ORV area, after the incursion of raccoon rabies in 1997, the prevalence of raccoon rabies rapidly increased to a peak in 1999, before declining after the ORV intervention (Fig. 4). The peak of raccoon rabies in the central counties followed behind the first peak in the eastern counties by approximately 3 years. This temporal peak relationship implies that raccoon rabies spread from the east to the west in West Virginia. Spatial distribution of raccoon rabies cases also confirmed this westward spread of the disease (Fig. 1). During the 8-year period after the epizootic in 1999, the central counties with ORV intervention did not experience any epizootic of raccoon rabies. During the same period, however, the reported raccoon rabies in eastern area without ORV intervention continued to show epizootic peaks including the highest peak in the study period. The temporal pattern in the non-ORV area was compatible with previous studies (Childs et al. 2000, Gordon et al. 2004), indicating that a second epizootic typically occurs within a period of 4–6 years after the initial epizootic of raccoon rabies.
Both descriptive analysis and time series analysis demonstrated the 12-month seasonal periodicity. For the non-ORV area, the parameter estimates of the model show the peak rabies occurrence during April and August (Table 2 and Fig. 5). This variation is possibly attributable to the elevated number of contacts between raccoons during periods of mating and dispersal. The number of raccoon rabies cases in a given month depended strongly on the number of cases in the second preceding month more than on the number of cases in the preceding month. This finding is suggestive of previous studies that found a 5–6-week incubation period of raccoon rabies in eastern Ontario (Tinline et al. 2002).
The model developed for the non-ORV area adequately described the linearly increasing temporal trend and a 12-month seasonal periodicity and autocorrelated errors. Both the descriptive analysis and the modeling approach indicated that raccoon rabies cases in the non-ORV area maintained an enzootic pattern and varied considerably among months, with a large peak during April and a smaller peak during August. One advantage of this modeling approach was that it provided a formal statistical method for determining the significance of temporal and seasonal trends. Further, the resulting model could be used to forecast raccoon rabies in this area. Comparing the forecasted with the observed raccoon rabies could identify unusual peaks for potential public health communication and more targeted interventions.
The model developed for the ORV area indicated that the temporal trend was altered by ORV intervention from a linearly increasing to a linearly decreasing number of cases. The number of raccoon rabies cases increased over the epizootic period. During the ORV bait distribution period, however, raccoon rabies decreased over time, leading to a significant reduction of raccoon rabies cases. The effect of the ORV intervention to contain raccoon rabies in this application was statistically significant. The absence of raccoon rabies cases west of the ORV barriers since intervention began also provided evidence in support of the ORV intervention. Based upon this preliminary model, statistical evaluation of other ORV programs should be attempted in enzootic raccoon rabies areas where ORV is ongoing to evaluate effectiveness of the interventions and to provide objective support for the continuation of such programs.
This study has focused attention on the understanding of temporal patterns of raccoon rabies reported in the ORV and non-ORV areas, with exploratory time series analysis. This approach ignored spatial distribution of raccoon rabies cases and information on the population density of raccoons. Reliable population density information that can be extrapolated to the whole study areas is not available in the current study. Such information would strengthen analysis, but would require a spatial model of a predicted raccoon population to extrapolate to an area as large as the one presented in this study. With more information available, spatial-temporal models will be developed in the future study to gain a better understanding of raccoon rabies patterns on both spatial and temporal scales.
Footnotes
Acknowledgments
We thank the West Virginia health and agriculture departments and laboratories for their contributions of rabies surveillance data, as well as to our colleagues in the Wildlife Services, U.S. Department of Agriculture, for their continued efforts in wildlife rabies prevention and control. We extend special thanks to Dr. David Henzler, Jane Rooney, and Susan Stowers for their diligence collecting and maintaining rabies surveillance data. We thank Dustyn Palmer for his assistance with mapping. We are grateful to the anonymous reviewers for their helpful comments on the article. This research was supported in part by an appointment to the Research Participation Program at the CDC administered by the Oak Ridge Institute for Science and Education through an interagency agreement between the U.S. Department of Energy and CDC.
Disclaimer
The findings and conclusions of this report are those of the authors and do not necessarily represent the views of the CDC.
Disclosure Statement
No competing financial interests exist.