
Abstract
Background:
The two most reported mosquito-borne diseases in Queensland, a northern state of Australia, are Ross River virus (RRV) disease and Barmah Forest virus (BFV) disease. Both diseases are endemic in Queensland and have similar clinical symptoms and comparable transmission cycles involving a complex inter-relationship between human hosts, various mosquito vectors, and a range of nonhuman vertebrate hosts, including marsupial mammals that are unique to the Australasian region. Although these viruses are thought to share similar vectors and vertebrate hosts, RRV is four times more prevalent than BFV in Queensland.
Methods:
We performed a retrospective analysis of BFV and RRV human disease notification data collected from 1995 to 2007 in Queensland to ascertain whether there were differences in the incidence patterns of RRV and BFV disease. In particular, we compared the temporal incidence and spatial distribution of both diseases and considered the relationship between their disease dynamics. We also investigated whether a peak in BFV incidence during spring was indicative of the following RRV and BFV transmission season incidence levels.
Results:
Although there were large differences in the notification rates of the two diseases, they had similar annual temporal patterns, but there were regional variations between the length and magnitude of the transmission seasons. During periods of increased disease activity, however, there was no association between the dynamics of the two diseases.
Conclusions:
The results from this study suggest that while RRV and BFV share similar mosquito vectors, there are significant differences in the ecology of these viruses that result in different epidemic patterns of disease incidence. Further investigation is required into the ecology of each virus to determine which factors are important in promoting RRV and BFV disease outbreaks.
Introduction
RRV was first isolated from Aedes vigilax (Skuse) in North Queensland in 1959 (Doherty et al. 1963), almost 15 years before BFV had been isolated in Queensland and Victoria from Culex annulirostris (Doherty et al. 1979, Marshall et al. 1982). Since then, RRV has been isolated from 42 mosquito species, with Ae. vigilax, Aedes camptorhynchus (Thomson), and Cx. annulirostris (Skuse) considered the main vectors (Harley et al. 2001, Russell 2002). Ae. vigilax is also a confirmed vector of BFV in coastal areas (Lindsay et al. 1995, Doggett et al. 1999, Ryan et al. 2000), having high vector competence (Boyd and Kay 1999, Ryan and Kay 1999) and a tendency to broadly feed on mammalian hosts, including humans (Lee et al. 1984, Kay et al. 2007). However, the vectors of BFV in inland areas in Queensland are unknown. Although Aedes procax (Skuse) and Aedes notoscriptus (Skuse) are competent laboratory vectors, further field investigations are required to define their actual involvement in the BFV transmission cycle.
Although there have been numerous reports describing general differences in the epidemiology of RRV and BFV diseases (Kelly-Hope et al. 2002, Passmore et al. 2002, Owen et al. 2007), investigations to delineate whether there are significant differences in the spatial-temporal patterns of disease incidence have not been undertaken. As the ecology of BFV is poorly understood, we investigated the relationships between the spatial-temporal incidence patterns of BFV disease and compared this with RRV disease. An understanding of the similarities and differences in the prevalence, spatial distribution, and temporal patterns of human RRV and BFV cases may help to define environmental precursors to epidemic transmission, and help focus future studies to define the important vectors and vertebrate hosts.
Materials and Methods
Study location
Before 2008, Queensland, with a population of over 4 million people (Australian Bureau of Statistics 2008), was partitioned into 125 administrative local government areas (LGAs), with populations ranging from 270 to 992,176 persons. Neighboring LGAs with similar rainfall and temperature data were grouped into six contiguous regions (Fig. 1) (Gatton et al. 2005). The populations of the regions ranged from 48,985 to 2,275,813.

Map of designated regional assignments in Queensland. Regions are formed using spatial, rainfall, and temperature information.
Notification data
Notification data for RRV and BFV disease cases with a reported illness onset date between 01/01/1995 and 31/12/2007 were obtained from Queensland Health. Each notification represented a serologically confirmed case and contained information about the patient's age group, sex, LGA of residence, and week of disease onset.
Population data
Queensland population data were obtained from the Australian Bureau of Statistics (2007). These data contained annual population estimates for each sex/age group in each LGA.
Analysis of disease incidence rates
For each disease, direct standardization was used to compute each LGA's age/sex-standardized incidence rates (IRs) over the 13-year study period. The total Queensland population from 1995 to 2007 was used as the standard population. The Moran's I statistic was used to assess spatial autocorrelation across LGAs for each disease, and Spearman's rank correlation was used to investigate the correlation between diseases within LGAs.
For some LGAs, particularly those with small populations, the weekly notifications were sporadic. To reduce this variability but maintain detailed temporal information, notification data were combined to create 4-week moving windows. These moving windows represented the number of notifications for a selected week plus the number of notifications during the 3 previous weeks. Weeks are labeled according to the first day of the reference week with each representing a 7-day period except week 52 (December 23–31).
For each of the six regions in Queensland, an IR was calculated for RRV and BFV disease. IRs were also computed for each 4-week moving window using only data from the corresponding window in the 13 years included in this study. The IR was estimated using either the crude IR or the trimmed IR. The crude IRs were calculated as the total number of notifications in the region (1995–2007) for the specific 4-week window divided by the regional population. The trimmed IR was calculated similarly after the years with the highest and lowest IRs were excluded. The crude IR was used to represent the long-term 4-weekly IR if the maximum number of notifications in the 4-week moving window was 5 or less, or if
Otherwise, the trimmed IR was used to represent the long-term 4-weekly IR.
To compare the dynamics of RRV and BFV notifications, the natural logarithm of the ratio of each 4-weekly IR to the long-term 4-weekly IR was calculated for each disease and region. The ratio was used to normalize the 4-weekly IRs between diseases and identify periods of high disease activity with an arbitrary value greater than +1 natural logarithms, indicating increased disease activity. For each disease, periods when the ratio crossed this threshold were identified in each region and categorized as concordant (both RRV and BFV diseases above threshold) or discordant (only one disease above threshold).
To determine whether the IR of BFV during the nontransmission season (spring) was an indicator of the incidence in the following transmission season (summer/autumn), logistic regression was performed. The nontransmission season variables were obtained by summing the IRs for BFV from week 36 to 48 and then calculating the ratio of the summed IRs to the summed long-term IR. Data for the transmission season were obtained by summing BFV IR from week 3 to 28 and normalized against the long-term IRs for each year, season, and disease. The transmission season ratios were classified into two groups: those with a ratio below 1 and those with a ratio of 1 and above. These binary variables were used as the dependent variable and the previous nontransmission season ratios as the independent variable in the binary logistic regression.
SPSS Version 15.0 for Windows (SPSS, Chicago, IL) was used to graphically analyze the IR data and perform binary logistic regression. ArcView GIS Version 9.2 (Environmental Systems Research Institute, Redlands, CA) was used to map the IRs for each LGA and compare BFV and RRV IR patterns across LGAs and regions.
Results
There were 27,532 RRV disease notifications and 7,266 BFV disease notifications representing state-wide IRs of 57.9 per 100,000 person years and 15.3 per 100,000 person years for RRV and BFV, respectively. Fourteen of the notifications were missing sex classifications and 17 were missing LGA information. The missing sex cases were excluded from the age/sex standardized analysis and the missing LGA cases were excluded from analyses at the LGA and regional levels.
Age/sex distributions
There were slightly more notifications from men than women for BFV disease (52.5% vs. 47.5% respectively), whereas 47.5% of RRV disease notifications came from men and 52.5% from women. The age distributions of the notifications were similar between diseases (Fig. 2).
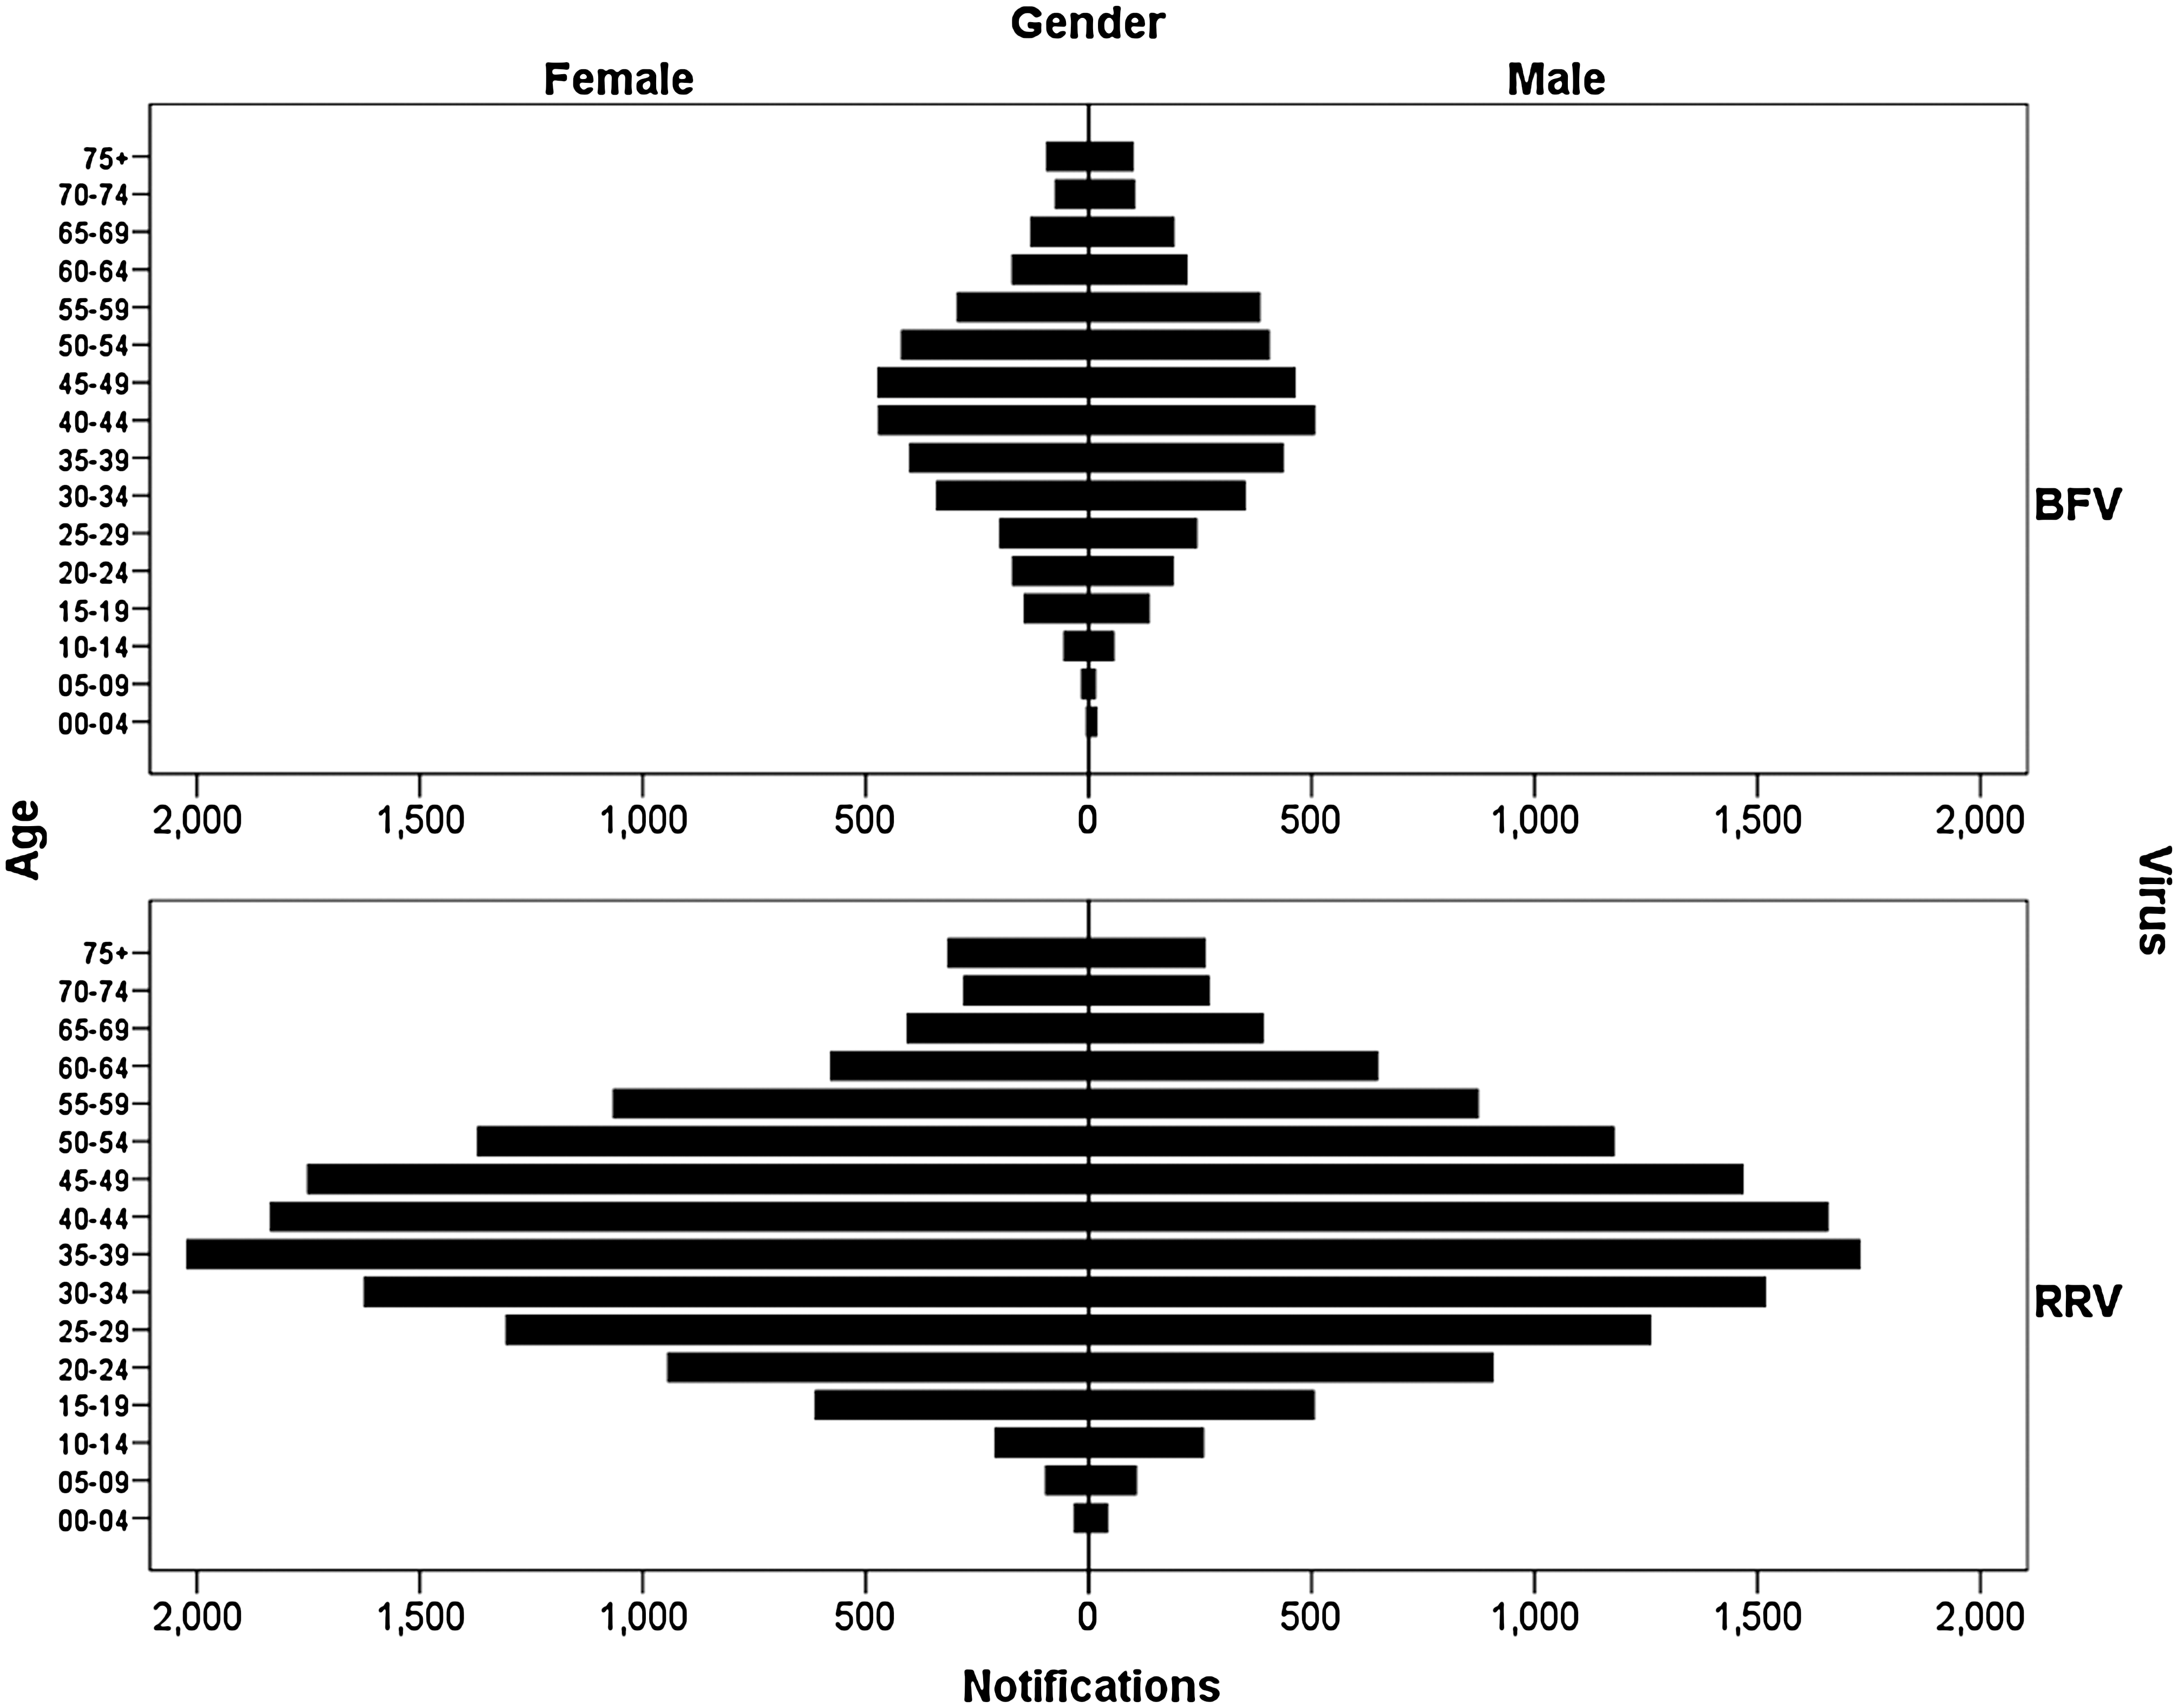
Age distributions of RRV and BFV disease notifications by sex. RRV, Ross River virus; BFV, Barmah Forest virus.
Geographic distribution
There was positive spatial autocorrelation between the LGA-specific IRs for both RRV and BFV diseases (Moran's I statistic = 0.15, p < 0.01 for both diseases). Visual representations of the LGA-specific IRs for each LGA (Fig. 3) clearly showed that LGAs in the south-eastern corner of Queensland had the lowest age/sex standardized IRs for both diseases. No single region was identified as having high age/sex standardized IRs (Fig. 3).
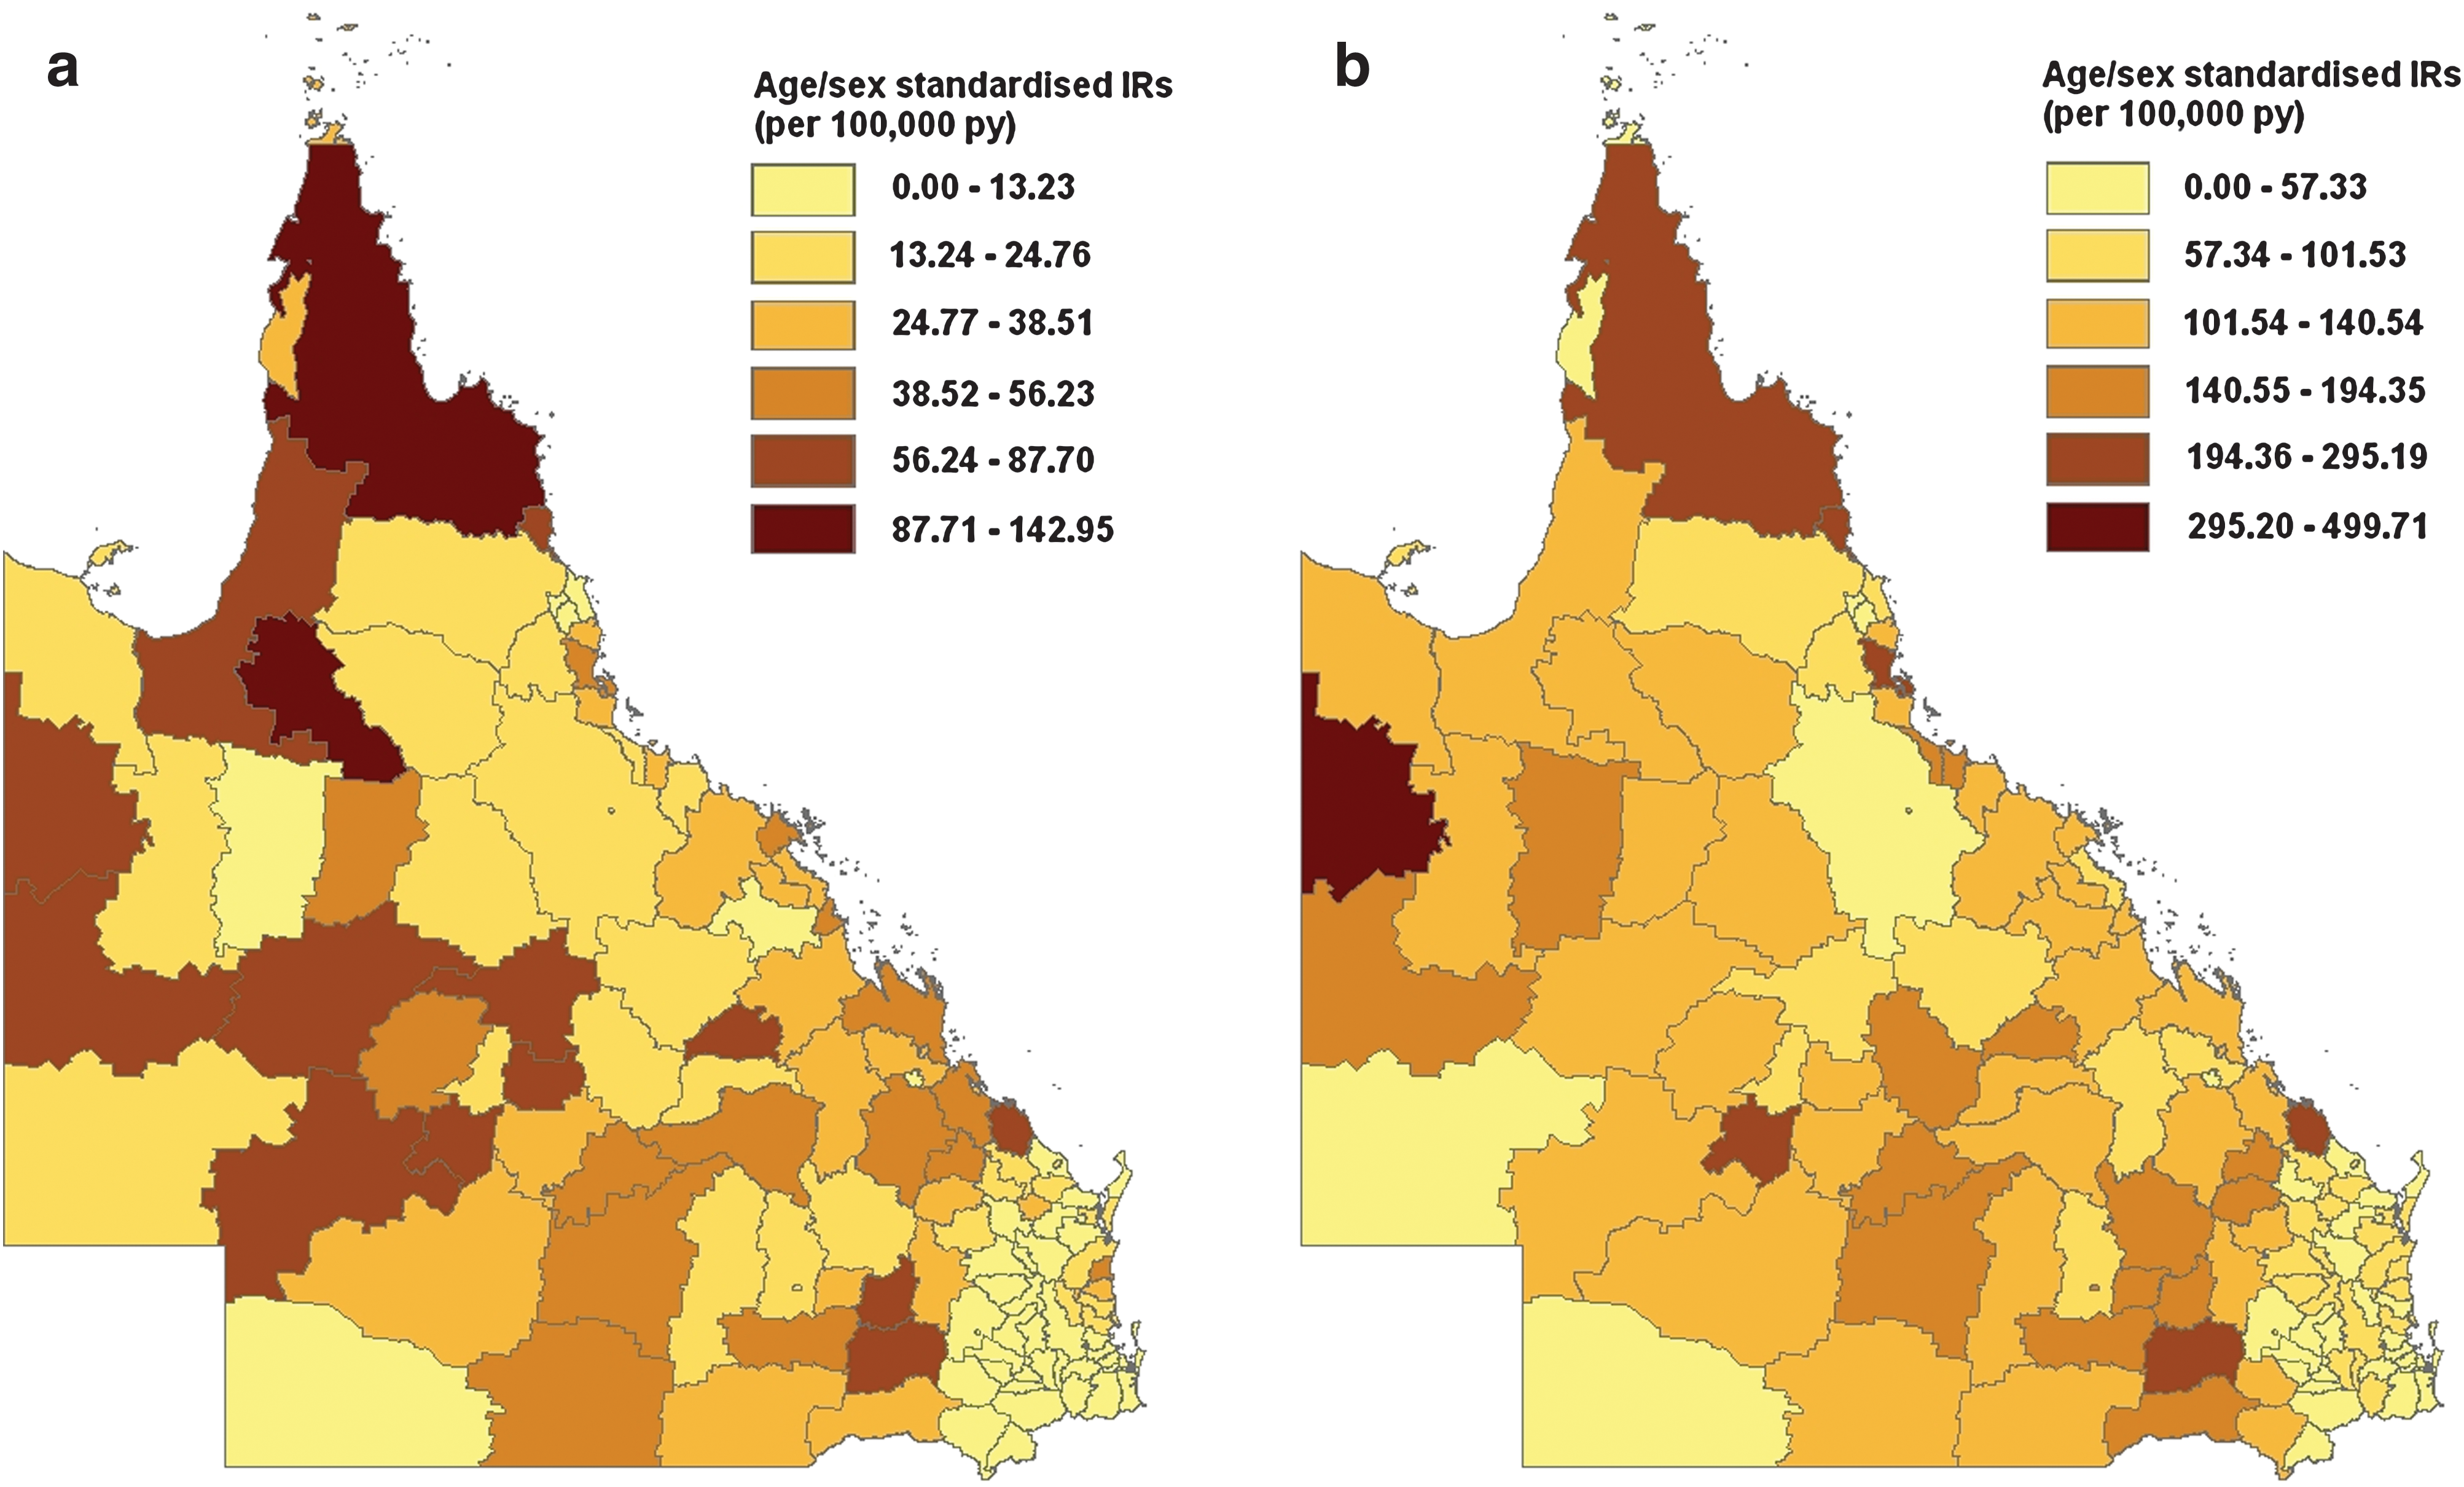
Age/sex standardized IRs for
Seasonality
Overall, the main transmission season for BFV and RRV diseases was typically from early/mid-summer to mid winter (Fig. 4), although notifications were received throughout the entire year. The beginning of the transmission season was defined as the first of 4 consecutive increasing weeks leading up to the peak number of notifications. The end of the transmission season was the last of 4 consecutive decreasing weeks following the peak number of notifications. Applying this definition, the typical RRV disease transmission season started at week 51 (December 17) and ended at the completion of week 27 (July 7). It peaked at week 14 (April 2–8) with an IR of 170.56 per 100,000 person years. About 87.4% of the notifications occurred within this transmission season.
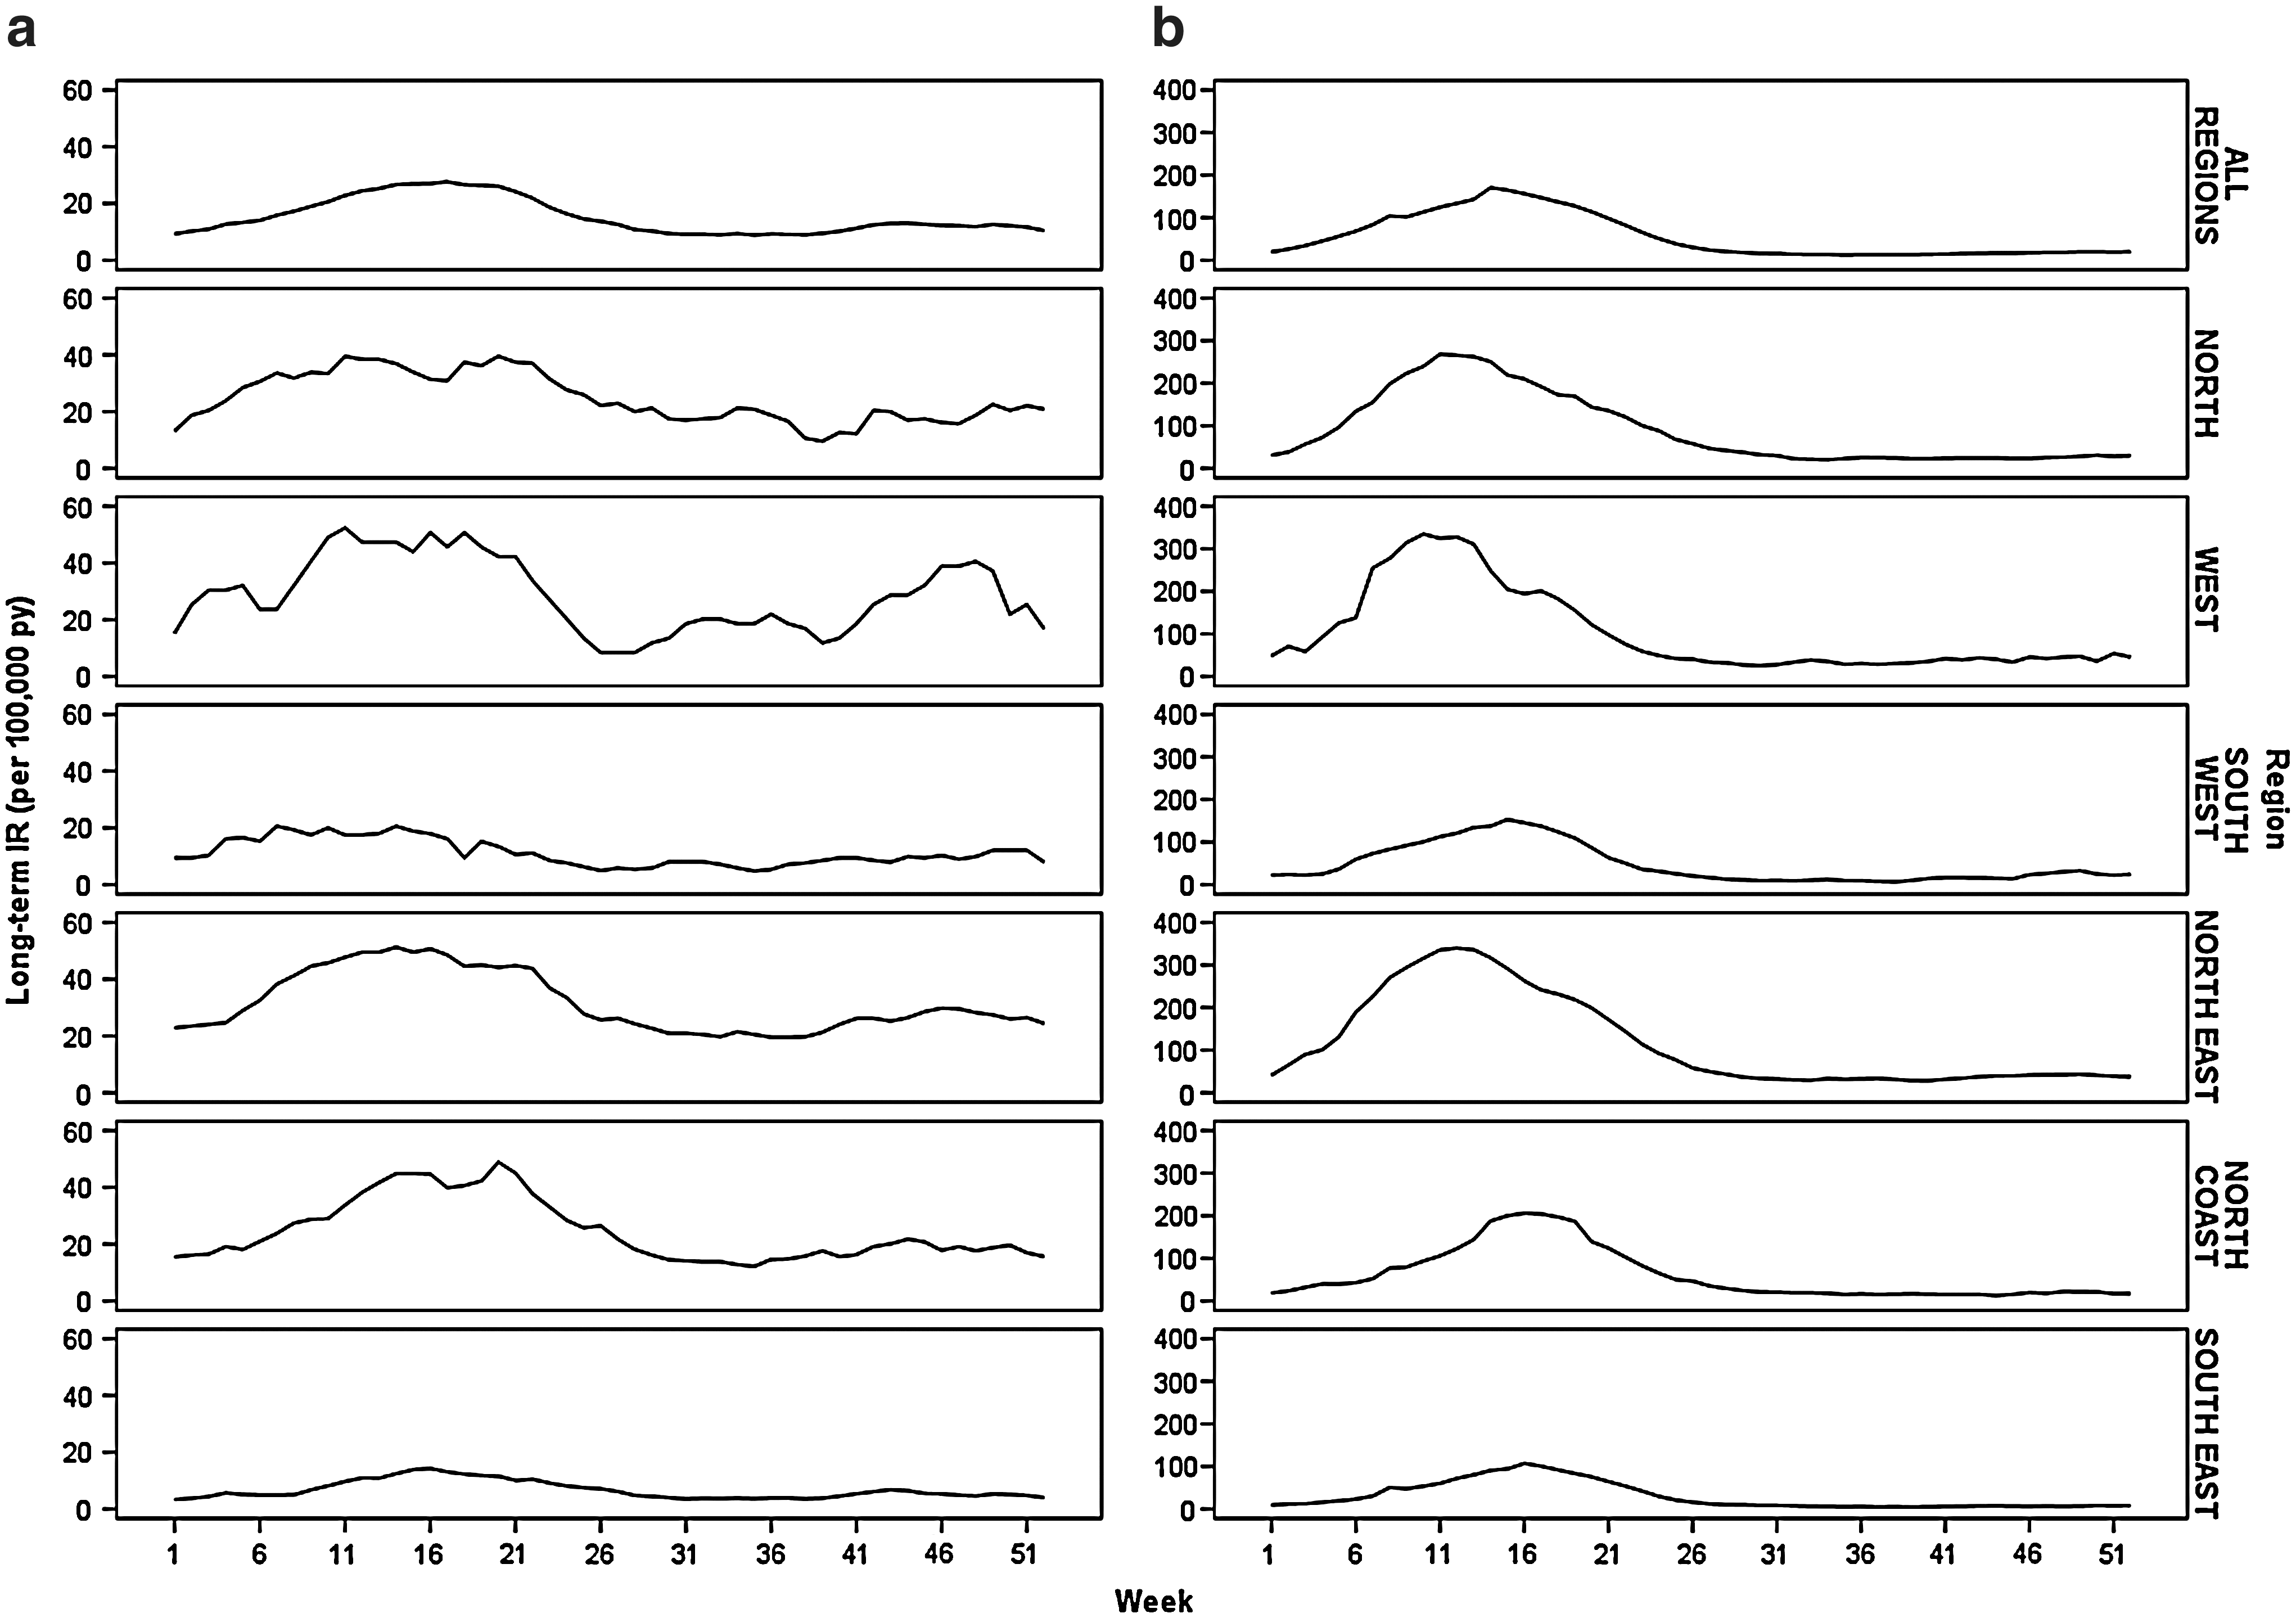
Long-term IR of (
The transmission season for BFV disease ran from week 3 (January 15) to the end of week 28 (July 15), peaking at week 15 (April 9–15) with an IR of 27.63 per 100,000 person years. About 64.2% of the notifications occurred within this period. Although the peak disease incidence of RRV was more than six times that of BFV disease, the IRs outside of the transmission season were similar (Fig. 4).
There were regional variations between the length and magnitude of the transmission seasons (Fig. 4). For RRV disease, the South-East, South-West, and North Coast regions had lower long-term IRs that peaked later than the North, West, and North-East regions. The BFV disease transmission season was approximately the same for all regions, but the long-term IRs were lower for the South-East and South-West regions compared to the remainder of the state.
Annual variability
For both BFV and RRV diseases, there were large variations in the IRs between years (Fig. 5). The annual IR for BFV disease varied approximately threefold, ranging from 8.79 per 100,000 person years in 1999 to 23.39 per 100,000 person years in 2006. RRV disease notifications showed a similar variation in incidence ranging from 24.13 per 100,000 person years in 2002 to 146.06 per 100,000 person years in 1996. There was no apparent trend over time in either data set and no apparent patterns in years preceding those with high IRs.
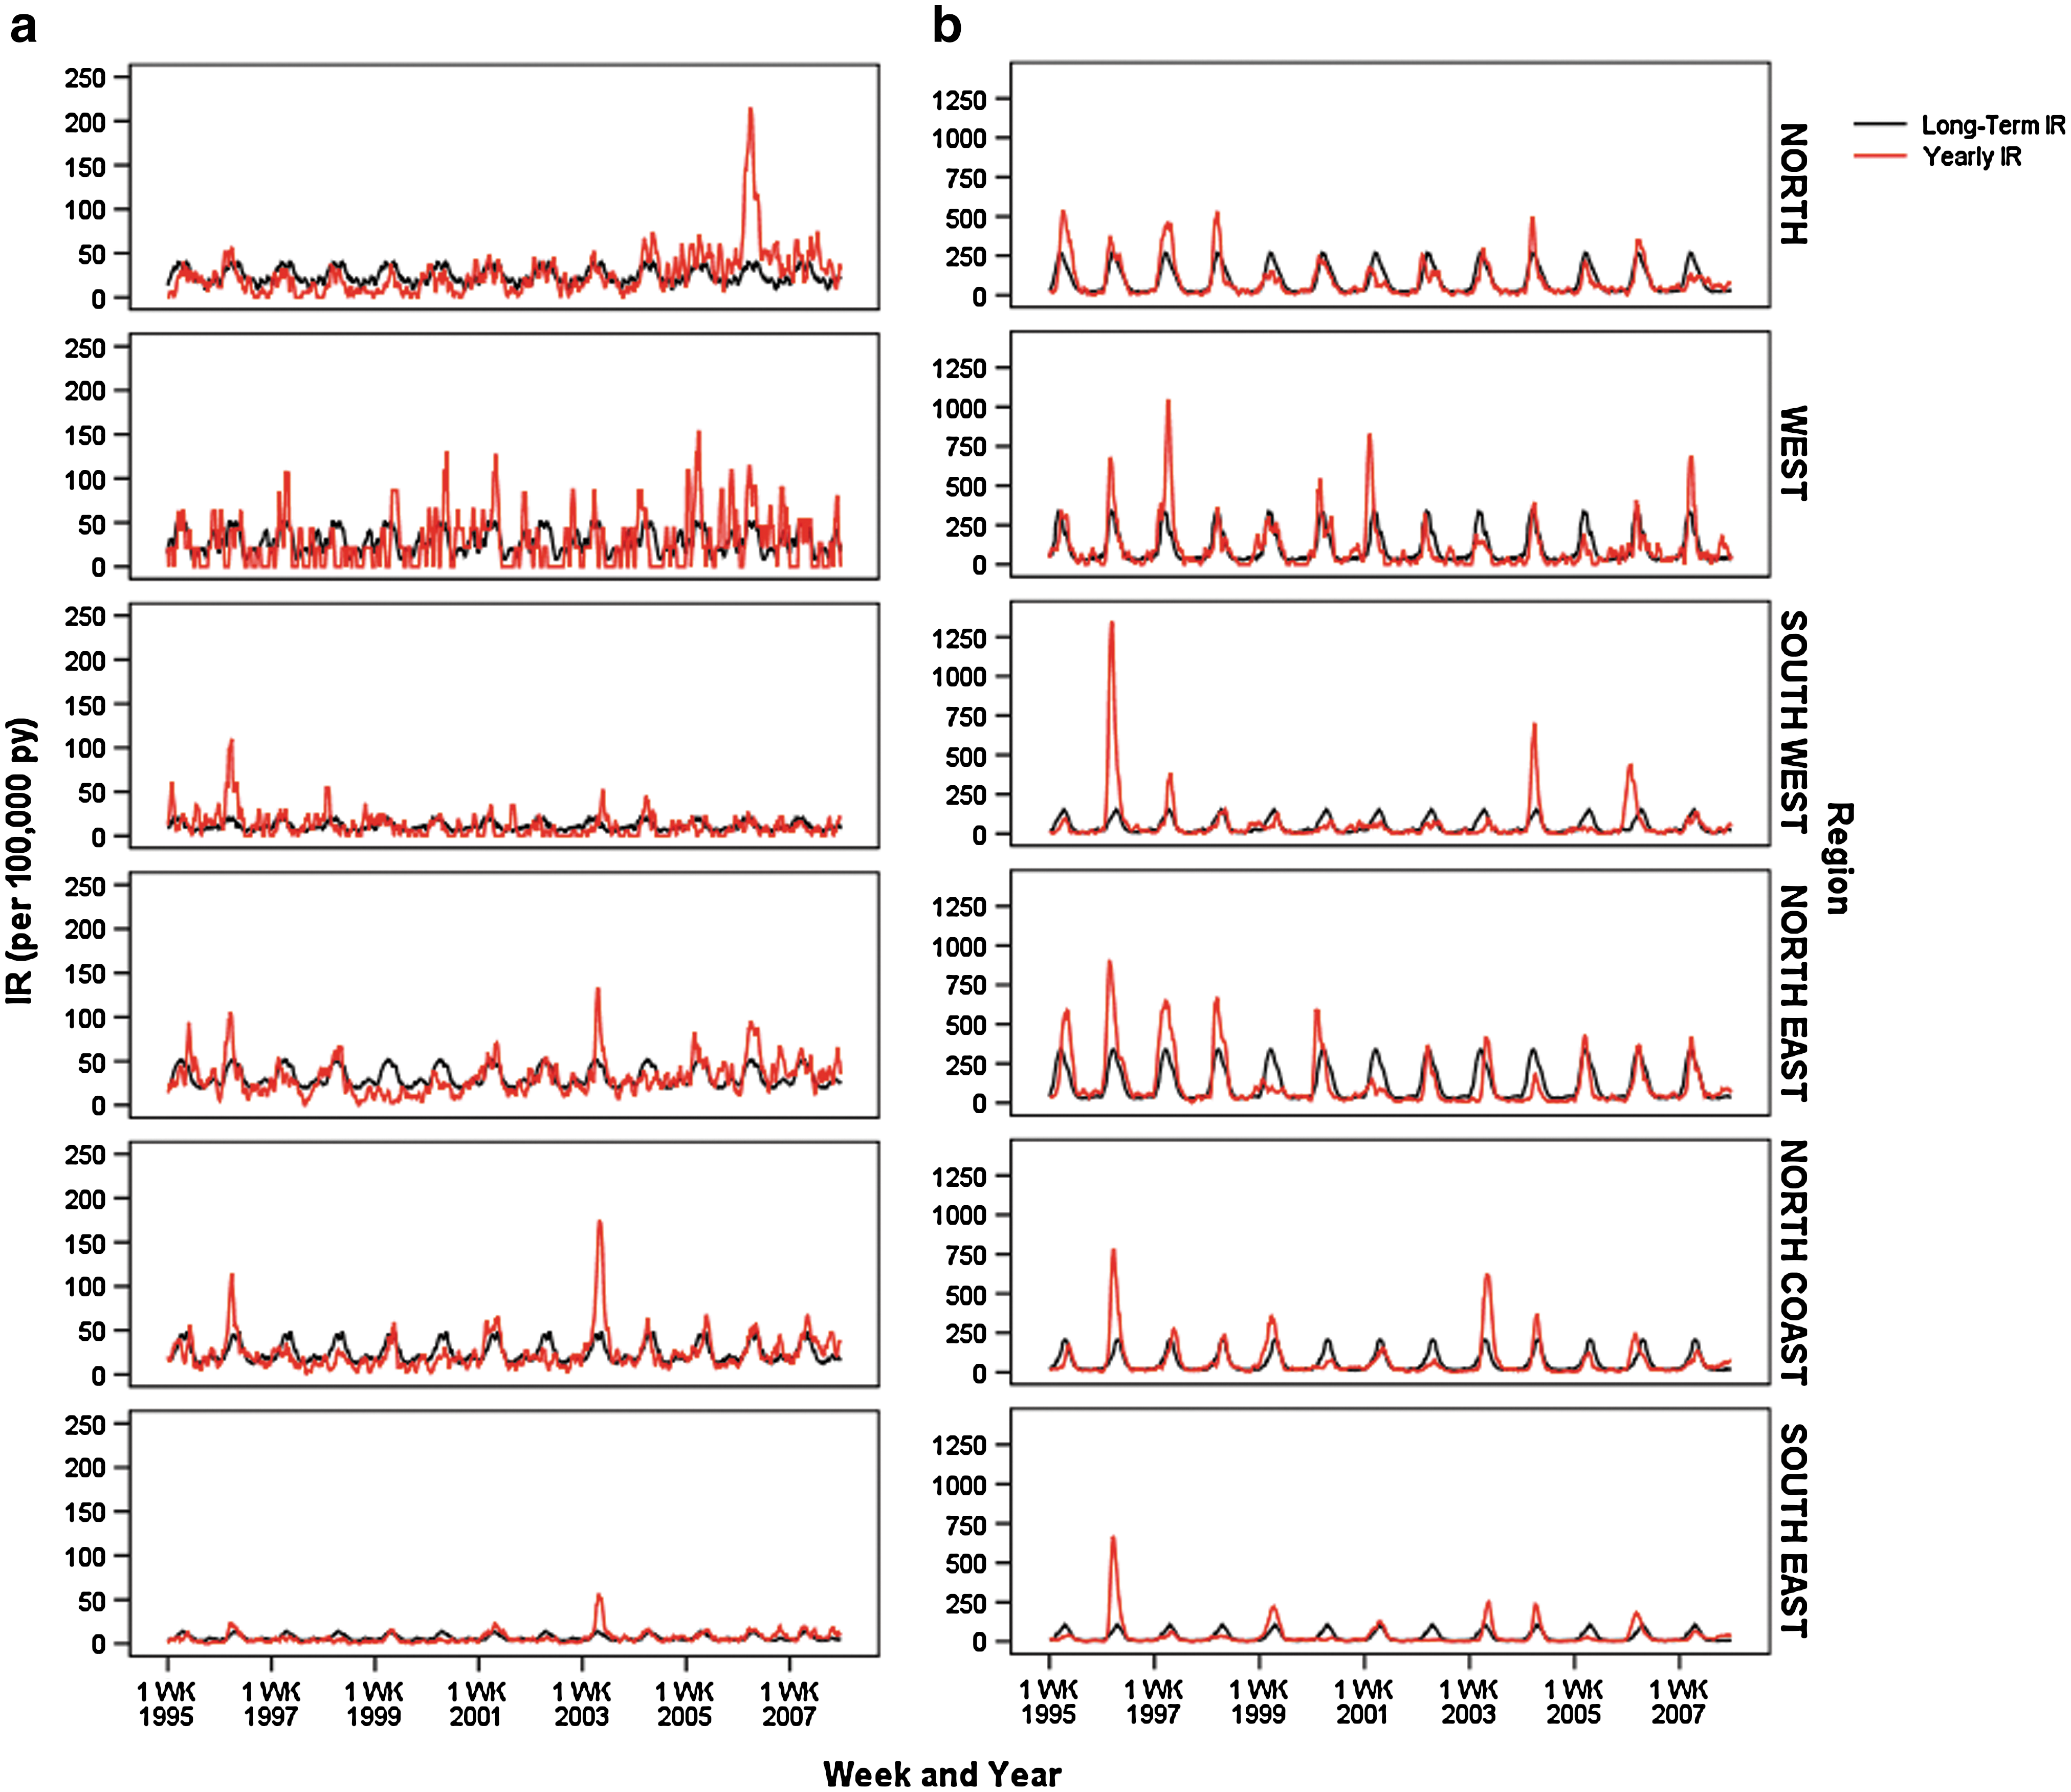
Queensland regional long-term 4-week IRs and actual 4-week IRs of (
Comparison of the IRs between regions revealed both geographically widespread and localized virus activity (Fig. 5). For some years, regions collectively experienced a higher than average IR (e.g., 1996). In other years, virus activity varied between regions or was localized to one or two regions. For example, West Queensland was the only region to have high RRV disease activity levels in 2001.
Comparison of RRV and BFV disease patterns
Over the 13-year study period there were 30 occurrences of increased disease activity in the six regions (Table 1). These occurred at 17 individual time points (Table 1). Overall, 76.7% of the occurrences were categorized as discordant with the frequency of increased RRV disease and not BFV disease being more than double that of the reverse situation (i.e., increased BFV disease without increased RRV disease). Due to the small number of events in each region it was not possible to statistically analyze the regional patterns, but there appeared to be a propensity for the North East, North Coast, and South-East regions to have increased RRV disease without increased BFV, while the North and West regions appeared more prone to increased BFV disease without corresponding increases in RRV (Table 1).
Concordant result: natural logarithm of actual to yearly IR ratios >1 for both RRV and BFV. Discordant result: natural logarithm of actual to yearly IR ratios >1 for one disease only (either RRV or BFV). Natural logarithm of actual to yearly IR ratio exceeded one at 17 different time periods, indicated in chronological order from a to q.
RRV, Ross River virus; BFV, Barmah Forest virus; IR, incidence rate.
BFV spring peak
Using BFV disease notifications we tested whether the size of the spring peak was predictive of disease incidence in the subsequent transmission season. No significant model could be developed (p > 0.05), suggesting that the number of BFV disease notifications in spring was not indicative of the IR in the following transmission season.
Discussion
Our spatial-temporal analyses of RRV and BFV disease incidence in Queensland over a 13-year period have highlighted some clear differences in the patterns of notified cases of human disease. Although the seasonality of reported cases at the state level was similar for both diseases, there were clear differences in the seasonality of BFV disease at the regional level. The most notable of these was in the Western Queensland region where there was a clear, secondary peak in reported BFV disease cases in spring, in contrast to the uniformly low numbers of reported RRV disease cases during this period. Differences in the seasonality of RRV and BFV diseases have been reported from other areas, including New South Wales, where reported numbers of BFV and RRV cases both peaked in late summer to autumn, although BFV started and peaked slightly earlier than RRV (Muscatello and McAnulty 2000). In Darwin, January and February were found to have the largest RRV disease incidence (Jacups et al. 2008).
In terms of the relative levels of virus transmission, nonhuman vertebrate serological data suggest that RRV exposure is three to six times higher than that for BFV (Kay et al. 2007). The human notification data used in this study showed a similar ratio of exposure causing disease with the number of RRV cases being 3.8 times greater than BFV cases between 1995 and 2007.
As with all mosquito-borne diseases, climate variability plays a role in RRV and BFV transmission. Many studies have identified rainfall, temperature, and tidal levels as influential factors in RRV transmission (Tong et al. 2002, Kelly-Hope et al. 2004a, 2004b). It is still not known which of these factors are important in BFV transmission, although it has been suggested that BFV is less susceptible to weather variations than RRV (Kelly-Hope et al. 2002, Naish et al. 2006). From our analysis, RRV and BFV disease notifications in the south-eastern corner of Queensland were lower and occurred later than the remainder of the state. The North Coast and South-West regions for BFV disease followed this pattern to a lesser extent. It should be noted that many LGAs in the south-eastern region have mosquito control programs that may impact on the transmission and spread of disease.
BFV and RRV disease shared similarities in the spatial distribution of their age/sex-standardized IRs across Queensland. There was also a significant correlation between the long-term IRs of both diseases when compared by LGA. Hence, LGAs that had low RRV disease IRs also tended to have low BFV disease IRs and vice versa. This positive correlation may indicate that BFV and RRV diseases may generally be responsive to similar environmental and ecological factors, although further studies are required to confirm this.
Given the similarities between the timing of transmission season and shared mosquito vectors, we expected that both diseases would have similar dynamics around the long-term IRs. However, this was not the case with only 23% of occurrences of increased disease activity involving increased cases in both diseases simultaneously. There was a tendency for increased RRV disease to occur independent of BFV, although this pattern was not constant across the regions. On occasions, BFV notifications surpassed the number of RRV notifications. This pattern has been previously reported during a BFV outbreak in the south-west of Western Australia (Lindsay et al. 1995) and also in Victoria when it was assumed that the larger numbers of BFV cases were related to uncommonly high numbers of Ae. camptorhynchus (Passmore et al. 2002). Our data highlight that although both diseases shared many similarities, there are factors, presumably related to the mosquito vector or disease ecology, that may impact on the prevalence of one disease but not the other. An improved understanding of these differences may assist with predicting disease outbreaks and focus interventions during outbreaks.
The failure of the BFV disease spring peak to predict the magnitude of the following transmission season suggests that virus transmission events in the peak season may be derived from different conditions to that of the BFV spring peak. The spring climate conditions such as temperature and rainfall may drive a different ecological pathway to obtain increased numbers of BFV disease cases compared to the main transmission season during summer and continuing into winter.
The retrospective analysis conducted in this study was subject to several limitations. It was assumed that the LGA of residence was the location where the person was infected. It was possible that some cases were contracted outside the LGA of residence. Another concern was that the data were grouped by LGA then amalgamated into regions. In both cases, the spatial boundaries were arbitrary administrative boundaries that could possibly split natural ecosystems, diluting the effect of localized patterns. This was particularly true for the regional analysis since the regions covered large geographic areas. Also, by having such large areas, localized effects were overlooked. However, a previous study of RRV disease notification data in Queensland that used the LGA as the unit of analysis indicated positive spatial autocorrelation in both the IRs and occurrence of outbreaks (Gatton et al. 2004). Further, cluster analysis of temporal LGA outbreak data tended to group LGAs into geographical clusters, suggesting limited intraregion variation, at least in the south-east corner of the state (Gatton et al. 2004). One other point of interest is that because the study period was long, the reporting of the diseases may have changed since the beginning of the study, particularly with increasing awareness of the diseases. Although we did not observe any prominent deviations in reporting or trends, it is an important point to consider.
In this study we examined the incidence patterns of BFV and RRV diseases in Queensland, Australia. Although BFV disease had considerably less notifications than RRV disease, the relative geographic distributions of BFV and RRV disease cases were similar. However, in terms of the spatio-temporal patterns of concordance of disease outbreaks, there were clear differences. This implies that ecological and environmental factors may play a part in baseline BFV and RRV disease transmission levels, but factors leading to disease outbreaks may differ between the two viruses. It is important to determine which factors are responsible for the differences in IRs and disease dynamics observed. By achieving this, we can better understand the ecology of each disease and potentially use this information to focus interventions specifically targeted to these diseases.
Footnotes
Acknowledgment
This work was supported by an Australian National Health and Medical Research Council Program Grant no. 496601.
Disclosure Statement
No competing financial interests exist for any author.