
Abstract
Leishmaniosis caused by Leishmania infantum is a widespread zoonotic disease that is endemic in the Mediterranean basin. Based on prior point abundance data for the two sand fly vectors of leishmaniosis in the Madrid region (Phlebotomus perniciosus and Phlebotomus ariasi), models were constructed to predict the spatial distribution patterns of these vectors. The models were obtained by negative binomial regression of several environmental variables and then used to map vector distributions. To validate the maps, we used serological prevalence data of Leishmania infection in dogs and incidence data were obtained through questionnaires completed by veterinarians in the region. Seropositive dogs and veterinary clinics registering a higher incidence of canine leishmaniosis appeared closer to our modeled vector foci. In the face of climate change, we simulated the future distributions of the sand flies for each third of the 21st century and predicted their spread in the region.
Introduction
Interest in this disease has been rekindled by a proposed, yet disputed, risk of reintroduction of leishmaniosis in Europe (Dujardin et al. 2008, Ready 2010) fuelled by the idea that climate and environmental factors determine the current geographical distribution range of its vectors. However, this zoonosis (Chargui et al. 2007, Antoniou et al. 2009, Martín-Sánchez et al. 2009, Gálvez et al. 2010b, Mazeris et al. 2010) and its vectors (Maroli et al. 2008, Gálvez et al. 2010a) have proved particularly challenging in terms of predicting their trends, and it is thought that new tools such as remote sensing and geographic information system (GIS) could help predict the spread of leishmaniosis according to changing human activities and environmental conditions (Ready 2008). Mapping disease occurrence based on explanatory variables, or predicting its future distribution based on expected climate changes, could serve to identify potential risk areas for human infection in both space and time (Kitron 1998, 2000).
The first studies to apply these tools in leishmaniosis vector epidemiology emerged in the late 1990s. A model of Phlebotomus papatasi distribution was developed in Southwest Asia based on weather and a so-called normalized difference vegetation index (Cross et al. 1996). Thus, a 1°C–5°C rise in ambient temperature was linked to the expansion of P. papatasi in this region (Cross and Hyams 1996). Also, through a logistic regression approach, a risk map was created for the presence of Phlebotomus orientalis in Sudan based on soil type, mean annual daily maximum temperature, and rainfall (Thomson et al. 1999).
More recently, several leishmaniosis risk maps based on environmental factors have been developed (Elnaiem et al. 2003, Gebre-Michael et al. 2004, King et al. 2004, Chamaille et al. 2010) and vector–reservoir distribution forecasts have been made under the premise of pending climate change (Peterson and Shaw 2003, González et al. 2010).
The objectives of this study were to construct vector distribution maps for the Madrid Autonomous Region, Spain, based on environmental variables and then to project these distributions to future climate scenarios for each third of the 21st century. These maps will provide useful information on the ecology of the leishmaniosis sand fly vectors in the Madrid region, on which to base the design of appropriate and focused control measures.
Materials and Methods
Study site
The study was conducted under the EDEN project (

Geocoded locations of dogs, vectors, meteorological stations, and veterinary clinics. Color images available online at
Entomological records
A cross-sectional survey was conducted in July 2006 and 2007 across a band spanning northeast to southwest of the Madrid region, where canine leishmaniosis (CanL) is endemic (Amela et al. 1995, Miró et al. 2007, Gálvez et al. 2010b). The area selected included a mountain range (Sistema Central) and its foothills and plateau region. The widely varying altitude (440–2414 m) of the study area determines both broad climate and vegetation ranges, influencing sand fly distributions. A description of this survey has been published elsewhere (Gálvez et al. 2010a). In brief, 123 sampling sites were set up evenly distributed across a 60-square grid (5 min each side) in the study area, and geocoded using a GPS (Fig. 1). Moran's I test revealed no spatial autocorrelation of the entomological data (p = 0.394). Ten to 20 sticky traps (A5-size paper coated with castor oil) were set for 4 days at each sampling site. The traps were mainly placed inside the holes used to drain embankments or containment walls alongside roads. These sites provide the microclimate required by sand flies for diurnal rest (Rioux et al. 1982). However, as only a low number of P. ariasi specimens were observed, the data used for model constructions were the densities of P. pernicious plus P. ariasi calculated as the number of sand flies per trap square meter recovered from the 123 sampling sites.
Environmental and meteorological variables
Using GIS software ArcGis v.9.2 (ESRI, Redlands, CA), each sampling site was assigned a set of meteorological and environmental variables including mean rainfall recorded over the four seasons of a year; minimum, maximum, and mean temperatures for the four seasons; altitude; aspect; land cover; distance to urban settlement; distance to nearest livestock farm (cows, goats, pigs, horses, and sheep); and distance to nearest poultry farm (quails, pheasants, chickens, geese, pigeons, ducks, turkeys, partridges, guinea fowl, or ratites).
Daily temperature and precipitation data were provided by the Spanish Meteorological Agency (AEMet). Each sampling site was assigned data from the closest meteorological station in the study area (n = 38) using the spatial join-and-relate tool of the GIS software. The maximum distance between a sampling site and the nearest meteorological station was less than 5 km. Temperature and precipitation values were those recorded from September to November, December to February, and March to May of the year before the sampling date and during the summer (June to August) when the field work was conducted. Using the Spatial Analyst Application (SAA) of the GIS software, we then extracted corresponding values for the topographical variables (altitude and aspect) from a Shuttle Radar Topography Mission (SRTM) 90 m resolution digital elevation model “Copyright DLR <2000>.” A 300-m resolution land cover layer based on MERIS satellite imagery from January 2005 to June 2006 provided by the European Space Agency was used to define the following land use categories: cultivated areas, forest and shrubland, sparse vegetation, urban areas, and water bodies. Through SAA, land cover values for each sampling site were obtained by (1) corresponding land cover extractions (model 1), or (2) percentages of land cover categories in 250- and 500-m buffer zones around each sampling site (model 2), a distance equivalent to estimated reach of sand fly flight (Rioux et al. 1979, Killick-Kendrick et al. 1984). Using the SAA tool of the GIS software, a 250-m resolution raster was created by calculating the straight-line distance from each cell to the urban settlement feature layer of the Madrid region. From each record, a corresponding value was extracted from this raster layer. Data for the 11,238 livestock and 1142 poultry farms in the study area were supplied by the Spanish Ministry of the Environment and Rural and Marine Affairs. Each sampling site was also assigned a value corresponding to its distance from the closest livestock and poultry farm using the spatial join-and-relate tool of the GIS software.
Modeling sand fly vector distributions
Two statistical approaches were used to predict the geographic distributions of the leishmaniosis vectors in the Madrid region. These models estimated vector densities as a count response regression, in which environmental and meteorological factors were used as explanatory variables. Both models assumed an overdispersed Poisson distribution of the data, which means that a negative binomial distribution was used instead of a Poisson distribution (Hilbe 2007). The first model included corresponding land cover extractions and the second included percentages of land cover categories in a buffer zone. The remaining environmental and meteorological variables were the same in both models. The model building strategy was, first, all factors were analyzed by bivariate analysis and then, starting with all variables showing a p-value lower than 0.2 in the bivariate analysis, multivariate backward stepwise regression was conducted. The likelihood ratio test was used to compare nested models and the Bayesian information criterion (BIC) was used to select the best models. To assess the predictive performance of the model, bootstrapping was performed with 1000 replicates to predict point values and class values (using Jenks' natural breaks classification scheme) (Jenks and Caspall 1971) of apparent density (AD): number of sand flies per trap square meter. R-squared was used to compare observed versus expected point values and the kappa statistic was then used to assess agreement after classifying the data in five groups. All statistical analyses were performed using Stata v.10.1 software (StataCorp LP, College Station, Texas). The level of significance was set at a p-value lower than 0.05.
Predictive maps for the Madrid region were drawn using the Raster Calculator of the GIS software through modeling on chartable raster layers. Models were constructed based on distance (250-m resolution straight-line distances), digital elevation model (90-m resolution), land use (500-m resolution forest and shrubland percentage), and climatic layers (200-m resolution rainfall and temperature). The latter were created and provided free by the Autonomous University of Barcelona (
Validating predictive maps
Over the years 2006 and 2007 in a survey of 1076 dogs from 32 villages in the Madrid region, anti-Leishmania-specific antibodies were detected in 87 dogs using an indirect immunofluorescence antibody test and a cutoff of 1/80 (Gálvez et al. 2010b). Moreover, 760 questionnaires designed for the EDEN-LEI project were sent to veterinary practitioners in December 2006 and March 2007. The questionnaire was designed to obtain data regarding the number of dogs examined in the past year at the veterinary clinic and the number of probable cases of CanL. One hundred sixty-six of these questionnaires were completed and returned, and the proportion of infected or sick dogs was calculated for each clinic. The locations of individual dogs and veterinary clinics were geocoded using the Geocoding tool of the GIS software on a street map layer for the Madrid province updated in 2004.
Predictive sand fly distributions were categorized into five classes using Jenks' natural breaks classification scheme. Outlier values of sand fly distribution were classified as “not present” for the extreme minimum (1% of cases) and “maximum density” for the extreme maximum (1% of cases). Distances from dog reservoirs (1076) and clinics (166) to each one of the classes were assigned using the spatial join-and-relate tool of the GIS software. Associations between infected dogs or proportions of infected dogs and distance to vector foci (or classes) were used to validate predictive maps.
Climate projections
Future climate projections were estimated from the seasonal mean temperature and precipitation data expected for the center of the Iberian Peninsula in each third of the 21st century (de Castro et al. 2005). We considered the results provided by an ensemble of six models (CCGM, CSIRO, HadCM3, NIES2, ECHAM4, and GFDL) called Atmosphere-Ocean General Circulation Model using the two most used emission scenarios A2 and B2 (IPCC 2007). In A2, greenhouse gas emissions and sulfate aerosols are predicted to rise at a more rapid rate than in B2. Maps of future sand fly distributions on the premise of the climate change scenarios were modeled, incorporating future climate projections.
Results
Model outputs under current climate
Using two different but similar models, sand fly distributions were estimated by negative binomial regression using the data collected from the sampling sites.
Model 1 revealed that the variables distance to urban settlement (US), altitude, and distance to nearest livestock farm (NLF) had an effect on vector densities (Table 1). The AD throughout the Madrid region was predicted by the Equation 1:
Model 2 indicated that the AD for the Madrid area could be predicted from a linear combination of the variables (Table 1): mean spring rainfall, mean autumn temperature, distance to US, percentage of forest and shrubland in a 500-m buffer, and distance to NLF, according to Equation 2:
Percentage of forest and shrubland in a 500-m buffer, distance to nearest livestock farm, mean spring rainfall, and altitude were negatively correlated with vector density, such that the higher the value of the factor (e.g., the greater the distance to the nearest farm), the lower will be the density of the vectors. In contrast, mean autumn temperature and distance to urban settlement were positively correlated with vector density.
The exponentiated coefficients of the models are interpreted as sand fly vector density ratios (DR), which means that for every unit increase in the value of a factor (e.g., a one-degree increase in mean autumn temperature), the vector density will increase by 25.9%.
Bootstrap values indicated that model 2 (R-squared = 0.45; 95% confidence interval: 0.23–0.73) was better at predicting point values of AD than model 1 (R-squared = 0.37; 95% confidence interval: 0.19–0.71). Moreover, for model 2, observed agreement (79.7%) was significant (p = 0.0068), although expected agreement was also high (75.3%) when AD was classified into five classes using Jenks' natural breaks scheme.
We then constructed two 500-m resolution maps to predict the distributions of the leishmaniosis vectors in the Madrid region, using the environmental and meteorological risk factors identified in the models mentioned above. As shown in Figure 2, the maps are fairly similar, although class values are slightly lower for model 1. High vector density areas can be seen in the southeast, southwest, and center of the Madrid region.
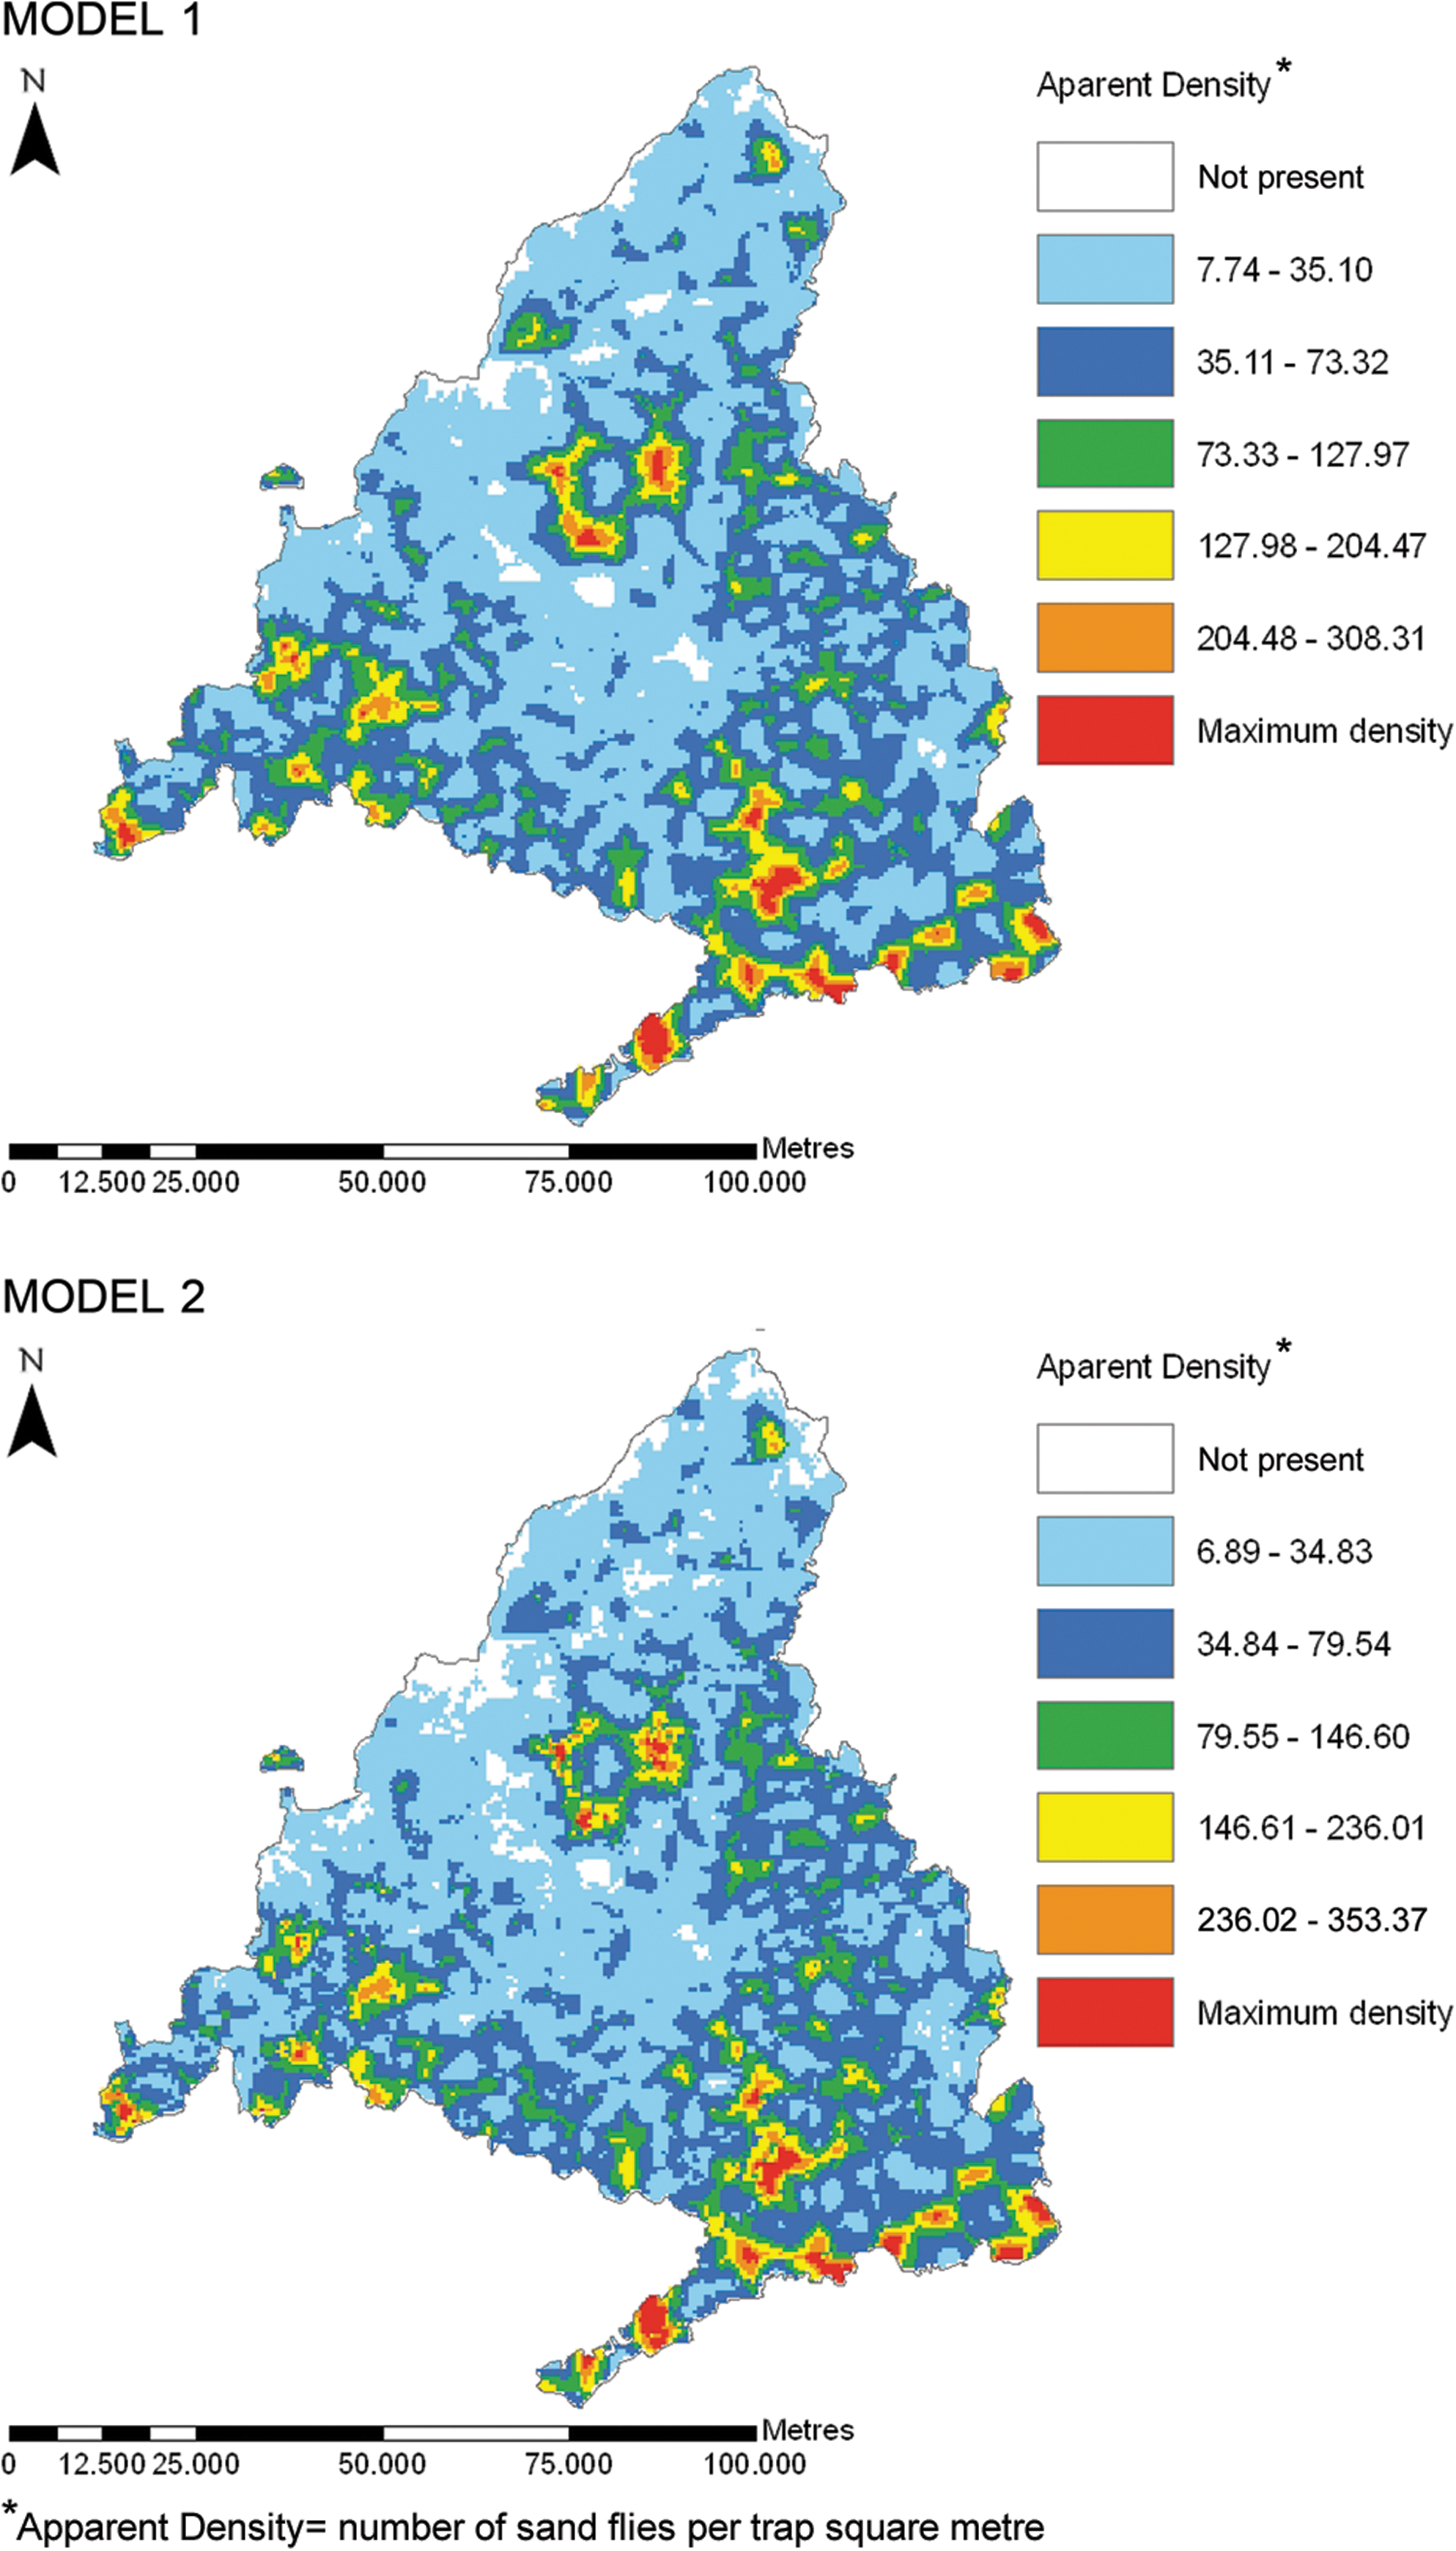
Spatial distributions of the leishmaniosis vectors predicted by models 1 and 2. Color images available online at
The two maps were validated by considering means of distances from individual dogs and veterinary clinics to each of the five different classes used to classify vector density. As the results for both maps were similar, only those for model 2 are shown. Thus, dogs seropositive for CanL appeared closer (p = 0.048) to the zones of higher ADs (>79.55). The clinics reporting a higher incidence of CanL were also correlated (p = 0.0308) with the areas showing higher ADs (>79.55). As no association was found below this point, it may be stated that, according to model 2, areas with an AD greater than 79.55 are considered vector foci.
Predicted climate change effects
Through the six-model Atmosphere-Ocean General Circulation Model ensemble, the predicted spread of AD was computed using the GIS software for each third of the 21st century under the two emission scenarios A2 and B2 (Table 2). Distribution and abundance vector forecasts were based only on climate shifts. Although other risk factors such as land use will obviously intervene, these are hard to predict with much confidence and the complex methods needed are beyond the scope of this study. Thus, although both models behaved similarly, only model 2 was used for the simulations because it includes variables based on climate. Simulated climate change predicted increased vector densities and affected areas (Fig. 3). The risk of spread is greater for the A2 than the B2 scenario and is especially high for the last part of the century compared with the current situation.
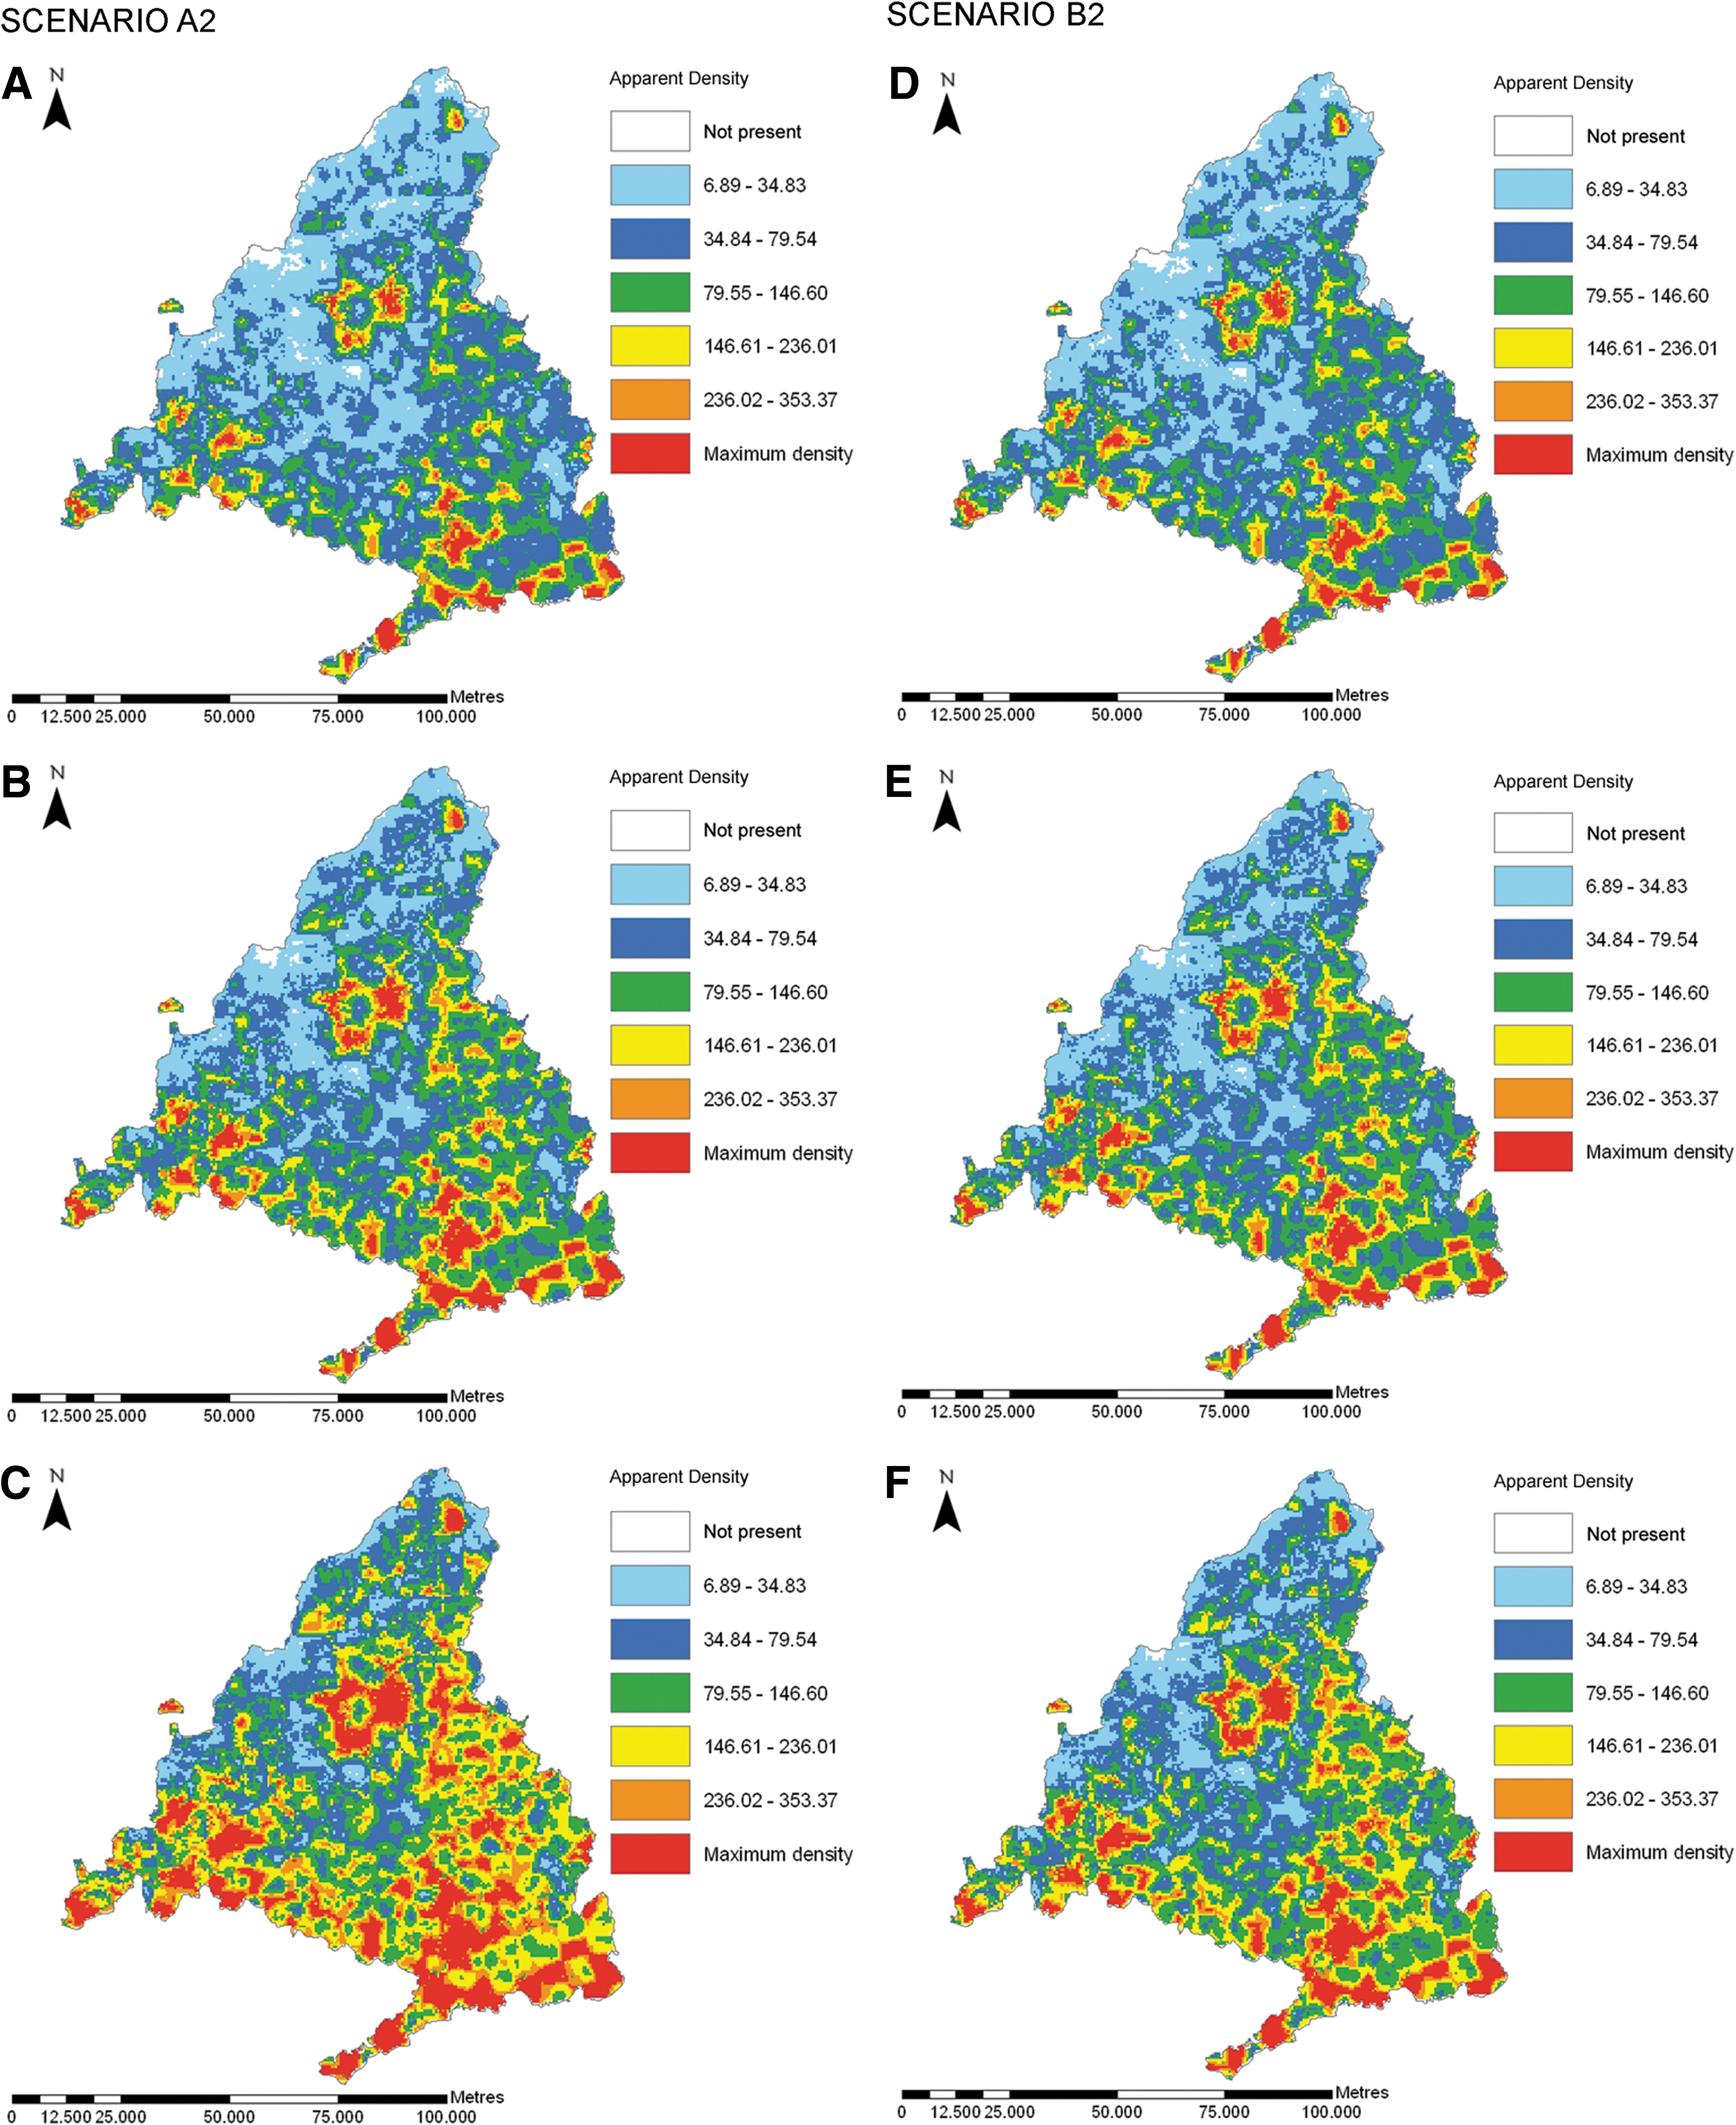
Predicted future distributions by the Atmosphere-Ocean General Circulation Model ensemble of the leishmaniosis vectors for each third of the 21st century under the A2 emission scenario:
Discussion
To understand sand fly vectorial capacities, knowledge of their specific environmental requirements is essential. In this study, we explored the effects of chartable environmental and meteorological variables on vector densities to map their predicted current distribution in the Madrid region. The environmental and meteorological factors considered have been previously observed to affect vector distributions in this region (Gálvez et al. 2010a).
Model 1 was based on altitude rather than the land cover (percentage of forest and shrubland) and meteorological variables used in model 2, indicating that altitude encompasses the effects of both climate and vegetation factors. Thus, model 2 may be considered more appropriate from an ecological standpoint, stressing the importance of taking into account vector spread using buffers (model 2) instead of point extractions (model 1). Although our models could be improved, environmental and meteorological factors emerged as decisive for modeling sand fly distributions. As we did not include animal reservoir, Leishmania parasite, and/or leishmaniosis disease data in the models, the maps do not reflect the distribution of the disease. Notwithstanding, in a recent study, the average prevalence of CanL was estimated to have increased from 5.25% to 8.1% in the last 15 years among the nonstray dogs in the Madrid region (Gálvez et al. 2010b). Moreover, the spatial association detected between infected dogs and the proportion of infected dogs to modeled vector foci determines that vector density could be used as an indicator of infection risk in a given area.
The percentage of forest and shrubland around each site was the factor least correlated with vector densities, probably because these sand flies seem to show a preference for more anthropogenic environments. Conversely, higher vector densities were recorded at sites far from very urban settlements. Thus, it seems that a balance between anthropogenic (urban settlements) and wild (forest and shrubland) environments (e.g., residential areas) maintains these parasite vectors in peak condition. A nearby livestock farm usually leads to increased vector densities. In a study performed in Brazil, the proximity of livestock, pigpens, or hen houses significantly increased the risk of CanL (Moreira et al. 2003). In the present study, mean rainfall recorded in the preceding spring was negatively correlated with vector densities, probably because, as other authors have suggested, high rainfall conditions could damage larval habitat and reduce phlebotomine abundances (Ghosh et al. 1999, Rossi et al. 2008). Higher mean temperatures in the preceding autumn gave rise to higher vector densities. Thus, mild weather in autumn could delay the beginning of diapause, increasing the larval population that reaches the fourth instar. Altitude was negatively correlated with vector densities. As altitude increases, vegetation changes, temperature decreases (according to the thermal gradient at a rate of −0.6°C per 100 m), and precipitation increases. Thus, an increased altitude will provide a more hostile environment for sand fly survival. In Sudan, it has been determined through map modeling that average rainfall and altitude are the best predictors of the incidence of leishmaniosis (Elnaiem et al. 2003).
In recent years, several leishmaniosis risk maps have been produced, based on environmental factors such as altitude and rainfall (Elnaiem et al. 2003), normalized difference vegetation index and land surface temperature (LST) (Gebre-Michael et al. 2004), or altitude and land use (King et al. 2004). Recently, the first risk map for CanL in France was created, based on environmental variables and human–dog densities (Chamaille et al. 2010).
In central Spain (mainly in the Madrid region), vector densities a few years ago were significantly higher than densities reported 17 years earlier (Gálvez et al. 2010a). In Spain, the past 30 years have definitely seen a generalized temperature rise, whereas precipitation has shown no clearly defined trend (de Castro et al. 2005, Bladé et al. 2010). This suggests that vector densities could continue to rise, and by examining the effects of climate change we should be able to confirm this trend.
The climate change simulated returned enhanced vector densities and expansion of their distribution range. The risk of spread was greater for the A2 scenario than for the B2 scenario, because of the higher estimated anthropogenic emissions of the former. The expansion of suitable sand fly habitats was predicted. In addition, simulated climate change predicted a threefold increase in apparent vector densities over the period 2070–2100 under scenario A2, compared with the current situation. As vector, host, and pathogen populations intersect within a permissive environment to enable pathogen transmission (Reisen 2010), if conditions for one of these, such as the vector, improve as predicted by our data, this could lead to improved disease transmission in the region. Predicted leishmaniosis vector–reservoir spread under the premise of climate change (IPCC 2007) has been reported for three Lutzomyia species in south Brazil for 2040–2069 (Peterson and Shaw 2003) and northward for two Lutzomyia and four reservoir species in the United States in 2020, 2050, and 2080 (González et al. 2010). Global change, including the development of new areas, changing agricultural practices, changing land uses, and climate change, contributes to the spread of leishmaniosis (Ready 2008).
In the interest of public health, there is a need for research targeted at the prediction, prevention, diagnosis, treatment, and prevention of leishmaniosis. Information on the prevalence and geographical distribution of infection is required for the installation of control measures and their surveillance thereafter. GIS and remote sensing technology are useful tools for analyzing spatial and temporal landscape features that will help identify target populations and also serve to address the behavior of the disease and its vectors so that effective control measurements may be implemented.
The vector distribution maps and predictive models established in this study provide information on the ecology of the leishmaniosis vectors in the Madrid region, on which to base appropriate and focused control measures against human and canine leishmaniosis infection.
Footnotes
Acknowledgments
The authors thank the Spanish Ministry of the Environment and Rural and Marine Affairs for providing meteorological data through the Spanish Meteorological Agency (AEMet) and data on the livestock and poultry farms registered in the study area. The authors also thank the Madrid Veterinary Association (AMVAC) for sending the questionnaires to its members and veterinarians who kindly answered the questionnaires. The authors thank Paul Ready, Jonathan Cox, and Clive Davies for formulating the general approach to EDEN-LEI project and advising on some practical aspects of samplings and analysis. Jorge Barón helped with the design of the figures. This work was supported by the Instituto de Salud Carlos III and the EU FP6 project “EDEN” (GOCE-2003-010284), Subproject EDEN-LEI, cataloged by the EDEN Steering Committee as EDEN0233 (
Disclaimer
The contents of this manuscript are the sole responsibility of the authors and do not necessarily reflect the views of the European Commission.
Disclosure Statement
No competing financial interests exist.