
Abstract
Serum from 226 free-ranging white-tailed deer (Odocoileus virginianus) was screened for Eastern Equine Encephalitis Virus (EEEV) antibodies using plaque reduction neutralization tests. EEEV antibodies were detected in 7.1% of samples. This is the first time EEEV antibodies have been detected in O. virginianus populations in the state of Maine (ME). The highest percentage of EEEV positive sera was in Somerset County (19%) in central ME, and this is the first time that EEEV activity has been detected in that County. EEEV RNA was not detected in any of the 150 harvested deer brain samples submitted to the ME Department of Inland Fisheries and Wildlife as a part of screening for Chronic Wasting Disease. This suggests that screening deer brains is not an efficient method to detect EEEV activity. For each serum sample tested, the geographic location in which the deer was harvested was recorded. Significant spatial clustering of antibody-positive sera samples was not detected. Relative to seronegative deer, seropositive deer were slightly more likely to be harvested in nonforested areas compared with forested areas. Results indicate that screening of free-ranging deer sera can be a useful tool for detecting EEEV activity in ME and other parts of North America.
Introduction
The state of ME, in northeastern US, is on the northern extremity of the distribution range of EEEV in North America. The recorded history for EEEV in ME is very short. To our knowledge, EEEV was first detected in a dead American goldfinch in South Berwick, York County, in 2001. The first EEEV detections reported to the Centers for Disease Control and Prevention (Centers for Disease Control and Prevention 2009) were in 2005 and were derived from 10 dead birds from York County, two dead birds from Cumberland County, two equine cases, and a positive mosquito pool from York County (Centers for Disease Control and Prevention 2009). A positive mosquito pool (Cs. inornata) and a horse case from York County were reported to the Center for Disease Control (CDC) in 2008. In 2009, EEEV was detected 21 times in 15 horses, 1 llama, 3 flocks of pheasants, and 2 mosquito pools (Centers for Disease Control and Prevention 2009). Although no human cases have ever been reported in ME residents, in recent years, neighboring NH has reported 12 confirmed cases of the disease in people from 2001 through 2009. Human cases have consistently been reported in Rockingham County, NH adjacent to ME (Centers for Disease Control and Prevention 2009); thus, there is a possibility of human disease extending into ME. In 2009, EEEV activity was reported for the first time in Waldo, Penobscot, and Kennebec Counties, much further north of the known distribution range of EEEV in that state. The EEEV epizootic in 2009 exposed our lack of knowledge about the current distribution range of EEEV in ME. It became clear that the potential range of EEEV transmission had expanded beyond its previously described limits (Morris 1988), and the extent of expansion is currently not known.
In the fall of 2009, the CDC, the ME CDC, and ME Medical Center Research Institute initiated an investigation into the distribution of EEEV in the state of ME by conducting sero-surveys of white-tailed deer (Odocoileus virginianus). This species was selected as a sentinel for several reasons. First, several previous studies in the US (Hoff et al. 1973, Bigler et al. 1975, Tate et al. 2005, Schmitt et al. 2007) have reported EEEV antibody-positive sera among populations of free-ranging O. virginianus, demonstrating that deer frequently become infected with EEEV. Second, white-tailed deer form a significant proportion of the blood meals of EEEV bridge vectors, particularly Cq. perturbans and Ae. canadensis (Molaei et al. 2008), suggesting frequent contact between deer and the EEEV bridge vectors in nature. Third, the home range of O. virginianus typically does not exceed a 1.6 km (one mile) radius (Marchinton and Hirth 1984, DeNicola et al. 2000), with the greatest degree of activity at dawn and dusk (Beier and McCullough 1990). Thus, we can assume that transmission occurs within this home range and that the spatial precision of the estimates of where transmission occurs is adequate for assessing the spatial distribution of EEEV at a state-wide scale. Fourth, blood samples collected during seasonal deer harvest when hunters bring the deer carcasses for registration can reduce the cost and effort involved in sampling. In this article, we describe and discuss the results of a preliminary survey designed to evaluate the effectiveness of deer sero-surveys for detecting EEEV activity in the state of ME.
Materials and Methods
Blood sample collection
Blood samples were collected from O. virginianus carcasses at 18 deer tagging stations: Bridgton, Gray, Sebago, and Windham in Cumberland County; Ashland in Aroostook County; Benton, Windsor, Albion, and Sidney in Kennebec County; Newport and Plymouth in Penobscot County; Dover-Foxcroft in Piscataquis County; Freedom and Troy in Waldo County; Pittsfield in Somerset County; Acton, North, Berwick, and Wells in York County; and Hope in Knox County. These stations were targeted, because large numbers of deer had consistently been registered at these stations and EEEV activity had been reported in the vicinity of most of these tagging stations. We started sampling on 31 October 2009 (the beginning of the firearm hunting season) and continued through January 2010. Whole blood was collected either from the heart or from blood pools in body cavities of the disemboweled carcasses by two different methods: (1) using sterile syringes and 5 mL vacutainer tubes and/or (2) using Nobuto Blood Sampling Paper Strips (Cole and Palmer, Vernon Hills, Illinois). In the field, vacutainer tubes were kept on ice in Styrofoam chests and transported on ice to the lab at the end of the day. In the lab, the vacutainer tubes were centrifuged at 3000 rpm for 5–10 min to separate serum from the blood clot and stored frozen at −20°C. Nobuto strips were air dried and stored in manila envelopes at room temperature. Deer tag numbers were used as ID numbers, and the approximate age of deer was estimated and reported as juvenile or adult using teeth wear (Cain 2010). The approximate locations where the deer were killed were pointed out and marked on high-resolution area maps by the hunters. At all times during the blood collection process, standard universal precautions against potential blood-borne pathogens were taken.
Serologic tests
Deer serum samples diluted 1:10 were screened for EEE-neutralizing antibodies by plaque-reduction neutralization assay (Beaty et al. 1995). Any positive specimens were retested and titrated in duplicate for confirmation. Serum samples were considered positive for EEE antibodies if they neutralized 80% of a challenge dose of ≈100 plaque-forming units of EEE-Sindbis chimeric virus (Wang et al. 2007).
Deer brains
The ME Department of Inland Fish and Wildlife (IFW) routinely collects brain samples from harvested deer killed during the hunting season and screens these for Chronic Wasting Disease (CWD). In 2009, IFW shipped 150 deer brain samples to the CDC in Fort Collins, CO, and these samples were screened for EEEV RNA using real time-polymerase chain reaction (RT-PCR). The deer brain samples were collected from fourteen counties: Oxford (27), Androscoggin (5), Cumberland (18), Franklin (3), Hancock (2), Kennebec (15), Knox (1), Lincoln (1), Penobscot (18), Piscataquis (6), Somerset (13), Waldo (9), Washington (1), and York (31). Briefly, deer brains (∼700 μL samples) were triturated in 2.0 mL tubes containing 1.0 mL BA1 buffer and copper-coated, steel bead (Copperhead, East Bloomingfield, NY) by using a laboratory tissue grinder MM 200 Mixer Mill MM 301 (Retsch Inc., Newtown, PA). The tubes were briefly centrifuged, and RNA was extracted from the supernatant using a QIamp Virus BioRobot 9604 Kit (Cat. No. 965662; Qiagen, Valencia, CA) and a QIAmp Virus BioRobot 9604 Instrument (Valencia, CA). The RNA extracts were assayed by a TaqMan RT-PCR using a QuantiTect Probe RT-PCR Kit (Cat. No. 204445; Qiagen, Valencia, CA) and an iCycler iQ RT-PCR System (Biorad, Hercules, CA). The primers and probes: forward primer 5″ ACACCGCACCCTGATTTTACA, reverse primer 5″ CTTCCAAGTGACCTGGTCGTC, and FAM/TAMRA probe 5″ TGCACCCGGACCATCCGACCT were previously described by Lambert et al. (2003).
Spatial analyses
Each deer collection site identified by hunters was geocoded and imported into a geographic information system (GIS) (ArcGIS 9.3, ESRI Redlands, CA). Results of the plaque reduction neutralization tests (PRNT) were recorded as an attribute associated with the deer collection site. Moran's I statistic was used to determine whether samples were randomly distributed with regard to PRNT results. To determine whether seropositive samples were associated with landscape or climatic variables, for each deer collection site, we collected data on the following variables: (1) 2 km resolution climatic variables, including precipitation, heating degree days, cooling degree days, maximum temperature, minimum temperature, and relative humidity (The Climate Source, 30 year averages, 1961–1990)(Climate Source Inc. 2010); (2) Land use/Land Cover (USGS, GAP Analysis Project, 1998); (3) elevation, 30 m resolution (ESRI, National Elevation Data Set, 2006); and (4) distance to water, 10 m (ESRI, Spatial Analyst). Values for each of these variables were compared between seropositive and seronegative groups using Wilcoxon Rank-Sums tests with χ2 approximation tests or contingency table analyses.
Results
Two hundred and twenty-six deer sera samples were collected from 10 ME counties (Table 1). Of the 226 deer serum samples collected, 16 (7.1%) were positive for EEEV antibodies by PRNT (Tables 1 and 2). The highest proportions of antibody-positive serum samples were in Somerset (19%) followed by Penobscot (12.5%), Cumberland (9.4%), Waldo (7.9%), Kennebec (3.8%), and York (5%) counties. EEEV antibodies were not detected in sera collected in four counties: Knox, Androscoggin, Lincoln, and Oxford (Table 1, Fig. 1). However, sample sizes were very limited in these counties, and sampling included very small areas of these counties (Table 1, Fig. 1). EEEV RNA was not detected in any of the 150 deer brain samples screened, suggesting that none of the deer submitted for CWD testing had an active EEEV infection in the brain tissue.
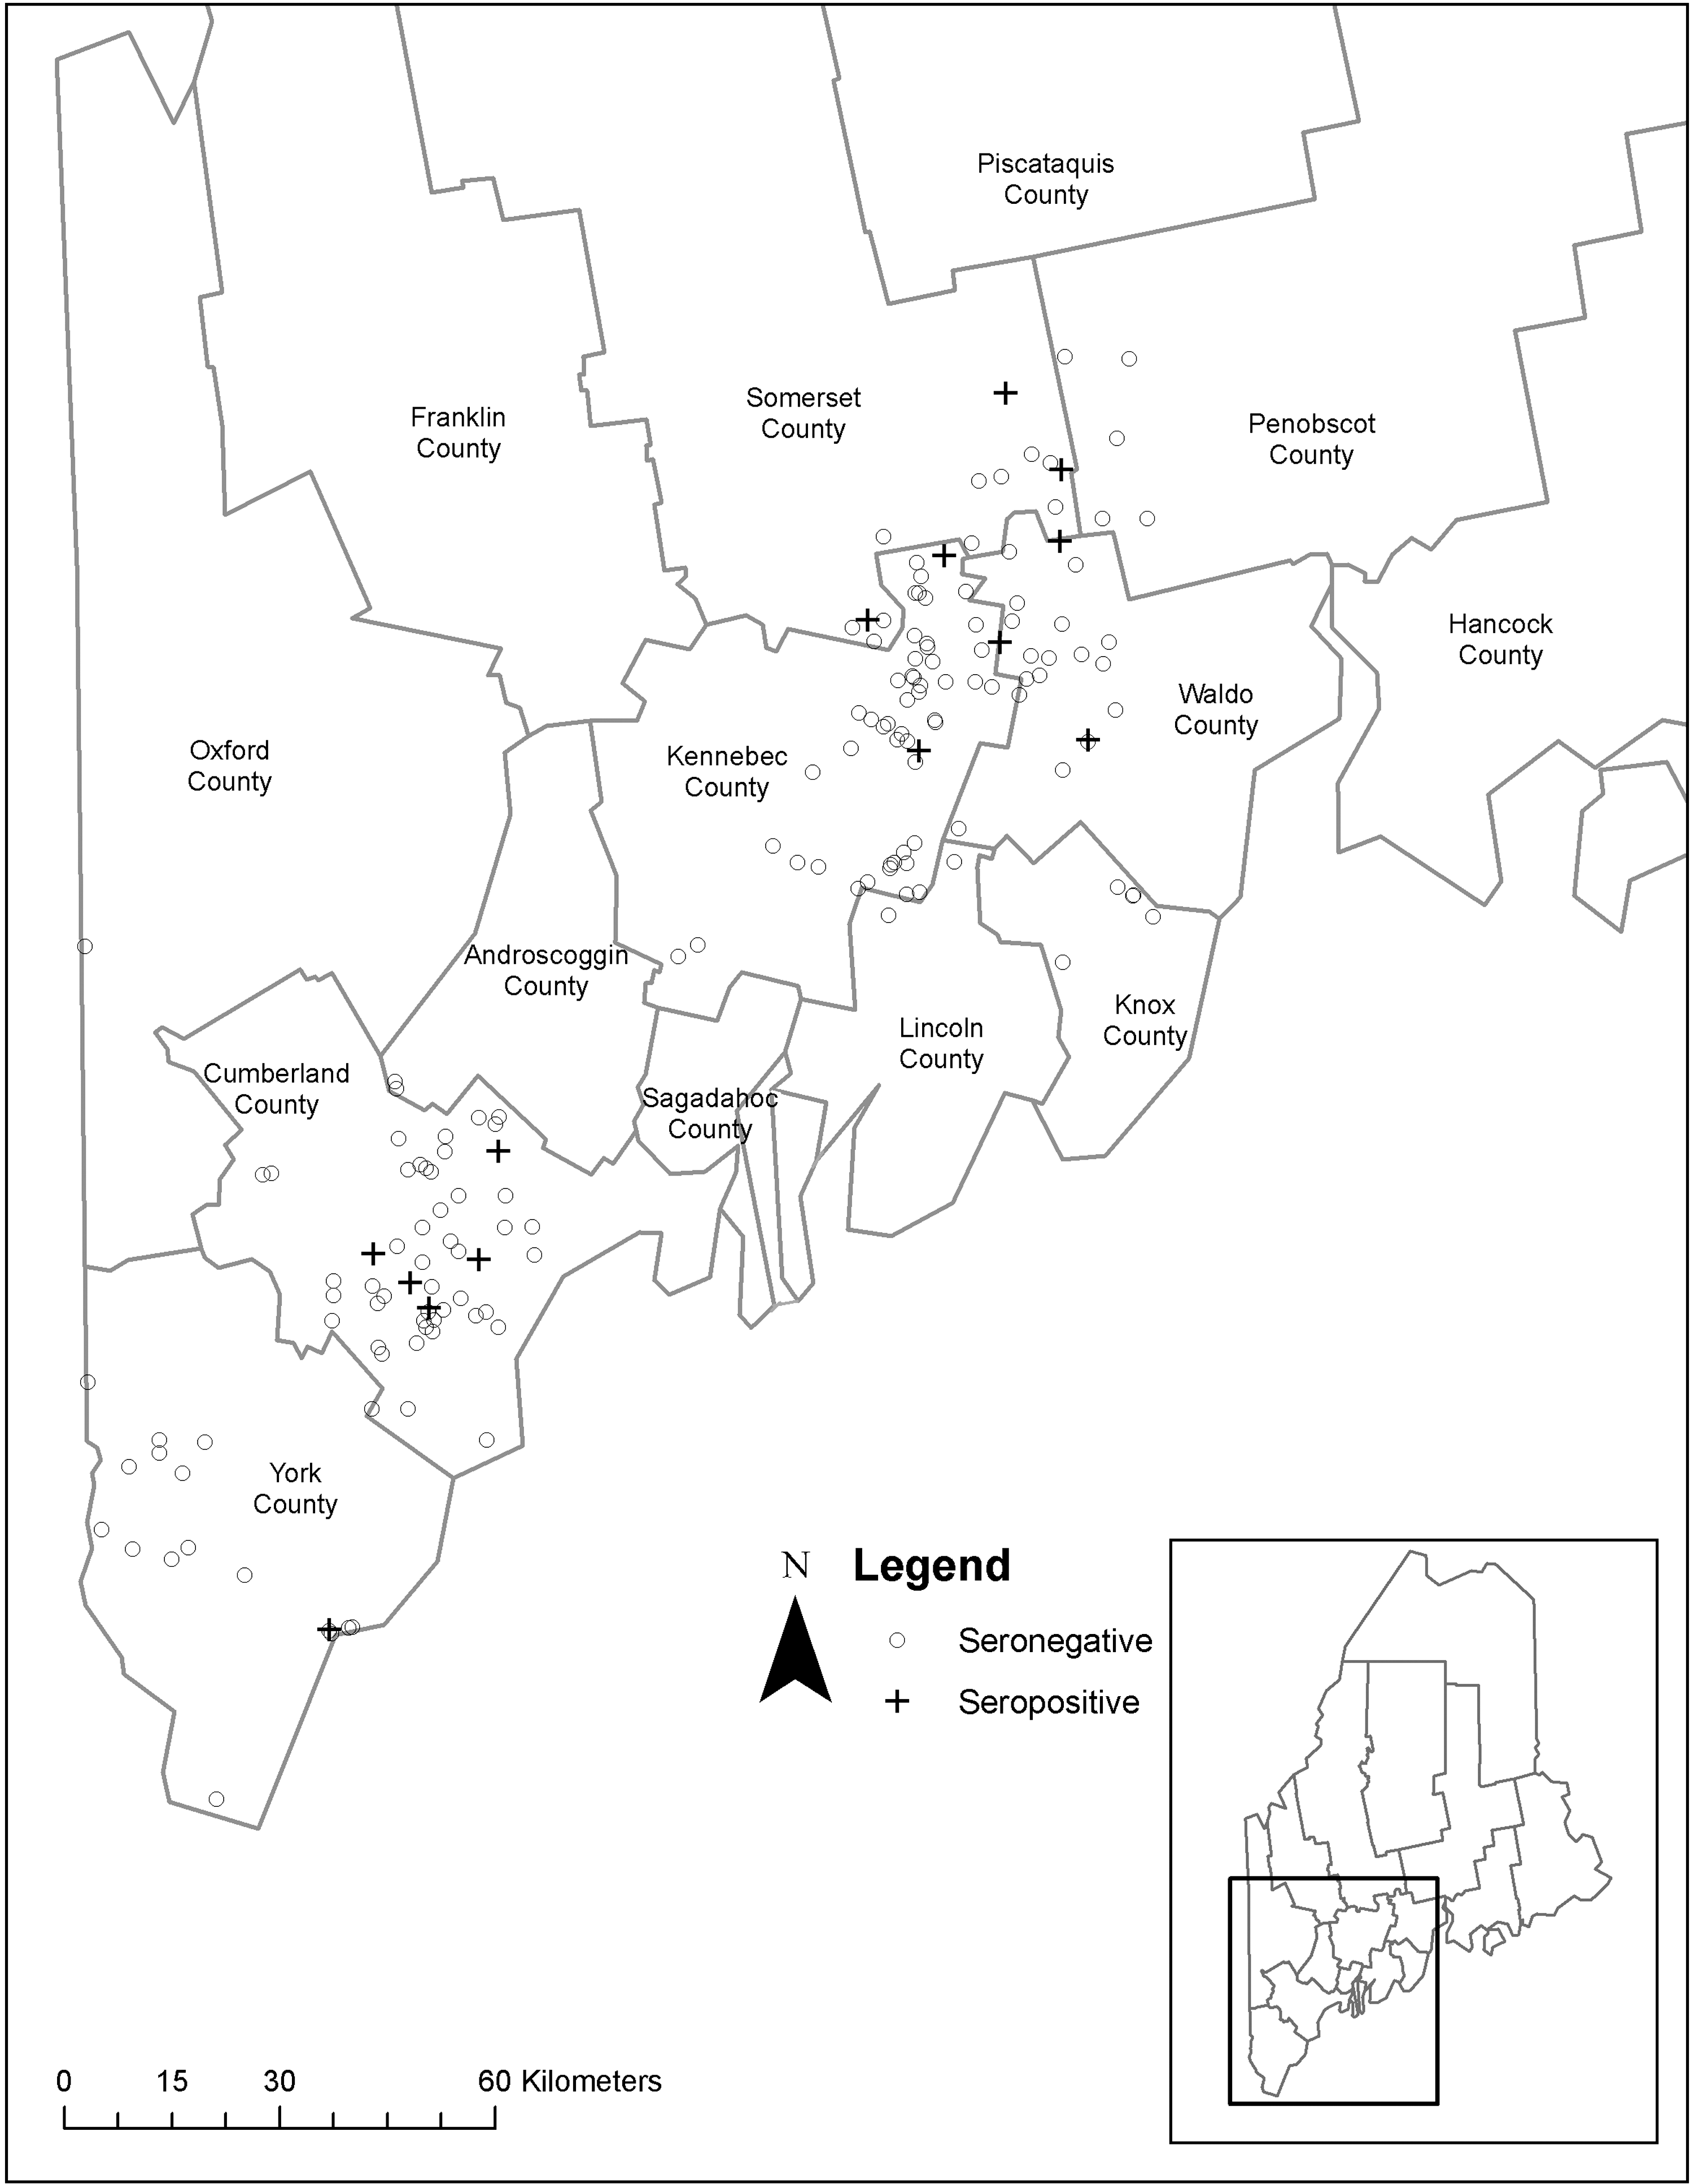
The distribution of Eastern Equine Encephalitis virus seropositive and seronegative deer samples collected in Maine, 2009. Inset shows the area of interest within the state of Maine.
Samples that were not clearly labeled were grouped together as unknown, including samples from Aroostook County.
PRNT80 EEEV
Only Nobuto Strip samples were received from these locations.
A, adult; J, juvenile; M, male; F, female.
Geographic coordinates were available for only 14 of the 16 EEEV antibody-positive deer sera samples. The two positive sera without geographic coordinates were excluded from spatial analyses. Based on Moran's I statistic, we detected no evidence of spatial autocorrelation in deer infection status (Moran's I=–0.01, p-value=0.424). That is, samples that were near to each other were about as likely as those which were distant to share the same infection status. By comparing each of the variables just described to the result (seropositive vs seronegative), only the variable “forest versus not forested” was significant (p-value=0.029; Table 3). Although significantly more deer were collected from forested (63% 106 of 168) compared with nonforested localities (χ2=11.66, d.f.=1, p=0.0006), seroprevalence was higher in deer collected in nonforested areas (9 positive of 62 tested; 15%) compared with forested localities (5 positive of 106 tested; 5%; Table 3).
Continuous variables were compared using Wilcoxon Rank Sums tests with χ2 approximations and categorical responses were compared using contingency table analysis. For each analysis, degrees of freedom equaled one.
Discussion
Similar to previous studies (Hoff et al. 1973, Bigler et al. 1975, Tate et al. 2005, Schmitt et al. 2007), we report evidence that free-ranging white-tailed deer (O. virginianus) are exposed to EEEV in the wild. To our knowledge, this is the first time that EEEV antibodies have been detected in O. virginianus populations in New England. Our observations are similar to those of a similar study (Tate et al. 2005) which reported an overall 14% antibody prevalence to EEEV in Georgia, and wide variation between physiographic regions that suggest habitat-associated EEEV transmission. We report a lower overall antibody prevalence of 7.1%, and variations between counties that suggest focal transmission typical of EEEV. However, the absence of significant clustering by Moran's I statistic suggests a widely dispersed pathogen transmission cycle with multiple small-scale foci of transmission. The observed distribution pattern may be attributed to the fact that the deer may have been infected over a several-year period, leading a more or less even dispersal of infected deer over the sampled area. Our aim in this pilot study was to evaluate the potential for using deer serosurveys to detect and map the distribution of EEEV activity in ME. Although EEEV antibody-positive deer serum has been reported earlier (Hoff et al. 1973, Bigler et al. 1975, Tate et al. 2005, Schmitt et al. 2007), the aims of these studies were to study the disease in wildlife. To our knowledge, this is the first time that white-tail deer serosurveys for EEEV have been conducted for public health reasons in the US. The mosquito species transmitting EEEV to deer in ME are not known; however, in coastal regions of the state extending to the midcoast, previous surveys have found high abundance of mammal-biting Ae. sollicitans, Ae. taeniorhynchus, and Cx. Salinarius, where saltmarsh and brackish water bodies occur, respectively (Holman 2003, MacKenzie 2005). Of the three, Ae. taeniorhynchus seems restricted to York and Cumberland Counties, whereas the other two species have been found as far up the coast as Knox County (Maine Forest Service 2004, Holman 2006, MECDC 2010).
However, larval mosquito habitats vary across the ME landscape. In coastal areas, brackish communities are abundant, whereas saltmarshes extend from the NH border to the midcoast area, typified by cordgrass (Spartina alterniflora) and salt marsh hay (Spartina patens) (Tyrrel 2006). Extending from the coast, larval mosquito habitat includes red maple swamps, cattail marshes, sedge meadows, and bogs (Tiner 1994).
Our overall goal is to develop a comprehensive EEEV surveillance system based on detailed information of EEEV regional and local distribution within ME. The overall EEEV sero-positivity rate of 7.1% is strong evidence that the deer serosurvey technique is sensitive and can be used as a tool to track EEEV in the state of ME. The fact that this was the first time EEEV activity had ever been detected in Somerset County is additional evidence supporting the sensitivity of deer serosurveys. Our observations that the highest percentage of positive deer sera were in the Somerset County (19%) (Table 1) emphasize the general lack of information about the current EEEV distribution in ME. However, the deer we screened from Somerset County were tagged in Pittsfield, St. Albans, and Detroit, which are border towns located close to Penobscot and Waldo Counties, and there is the possibility of EEEV seropositive deer wandering across boundaries from Penobscot and Waldo Counties into Somerset County. White-tailed deer can be useful as a sentinel because of their localized high abundance (Healy et al. 1997), tendency for seasonal use along wetland corridors (Banasiak 1964), crepuscular activity periods (Beier and McCollough 1990), and proximity to human habitation (Van Allen Baker and Fritsch 1997). In studies of bloodmeal analysis (Molaei et al. 2008), white-tailed deer form a significant portion of the diet of EEEV bridge vectors, primarily Cq. perturbans, Ae. sollicitans, and Ae. canadensis. Further serosurveys are planned to determine the current northern limits of EEEV activity and to identify transmission loci within the distribution range.
Based on a single year of deer surveillance data, we identified only one variable (forested vs. not forested) that differed significantly between locations that yielded seronegative or seropositive deer. Additional sampling is required to determine whether this was a spurious result, or biologically meaningful. Previous GIS-based studies that focused on single mosquito species were successful at identifying environmental correlates of vector abundance (Moncayo et al. 2000, Jacob et al. 2010). However, since EEEV is transmitted by multiple mosquito species that differ in their habitat preferences, it is possible that future sampling of deer may not yield variables that are associated with EEEV antibody-positive serum; thus, creation of a spatial risk model based on deer surveillance may not be possible for this geographic location. Instead, vector modeling may be more useful for identifying areas where EEEV is endemic and other areas where the virus may emerge. Nonetheless, continued mapping of deer collection sites in relation to EEEV antibody-positive serum rates will provide updated geographic data on the distribution of EEEV and may be useful for identifying meteorological variables that are predictive of a northerly spread of the virus. Such knowledge of the distribution of EEEV can be used to raise awareness of the disease among health care providers and for targeting education campaigns that inform the public of how to prevent exposure to the virus (e.g., use of mosquito repellents, avoiding risk areas during peak biting times, using intact screens on homes, etc.). Overall, the distribution of seropositive deer suggests that EEEV epizootics are taking place within the area and seem to be spread beyond the bird-mosquito cycle.
Footnotes
Acknowledgments
The authors thank Leticia Smith and Susan Elias from the Maine Medical Center Research Institute for their logistics, laboratory, and field assistance during this study. They especially thank Dr. Joseph Staples and the students of the University of Southern Maine, Dr. David Knupp and the students of Unity College, Dr. Stephen Hansen and the students of the University of Maine at Fort Kent, the Maine Department of Inland Fisheries and Wildlife, and USDA Wildlife Services for their help in collecting samples at tagging stations. This study was supported by funds from the Centers for Disease Control and Prevention (CDC) and the Maine Medical Center Research Institute (MMCRI).
Disclosure Statement
No competing financial interests exist.