
Abstract
The processes influencing the magnitude of West Nile virus (WNV) transmission from 1 year to the next require thorough investigation. The intensity of WNV transmission is related to the dynamics and interactions between the pathogen, vector, vertebrate hosts, and environment. Climatic variability is one process that can influence interannual disease transmission. South Africa has a long WNV and Sindbis virus (SINV) record where consistent climate and disease relationships can be identified. We relate climate conditions to historic mosquito infection rates. Next, we detect similar associations with reported human outbreaks dating back to 1941. Both concurrent summer precipitation and the change in summer precipitation from the previous to the current summer were strongly associated with WNV and SINV transmission and recorded human outbreaks. Each 100 mm interannual summer precipitation change increased WNV infection rates by 0.39 WNV-positive Culex univittatus/1000 tested Cx. univittatus. An improved understanding of biotic and abiotic disease transmission dynamics may help anticipate and mitigate future outbreaks.
Introduction
Sindbis virus (SINV) shares a similar transmission cycle and produces analogous human pathologies (e.g., flu-like symptoms) to WNV. The transmission cycle of both viruses involves avian hosts and Culex spp. mosquito vectors. Episodic SINV outbreaks were recorded in South Africa, Scandinavia, and Australia (Niklasson 1988). In South Africa, WNV and SINV continually circulate and passive surveillance records tens of human cases per year.
Patchy global surveillance and a long period between successive outbreaks limit studies of year-to-year variations in the intensity of disease transmission. Linking environmental conditions to individual mosquito-borne disease outbreaks can be problematic. Anomalous environmental conditions may simply be coincident with individual outbreaks. A long disease transmission record is required to separate systematic from coincidental climate and disease associations. Unfortunately, very few long-term standardized mosquito-borne disease records exist. South Africa, with a long history with WNV and SINV, provides a unique opportunity to investigate climatic influences on interannual disease transmission. An improved understanding of biotic and abiotic disease transmission dynamics may help anticipate and mitigate future outbreaks.
Culex univittatus is responsible for both WNV and SINV amplification among avian hosts and incidental transmission to humans in Israel, Egypt, and South Africa (Jupp and McIntosh 1970). Vertical WNV transmission and adult mosquito overwintering supports endemic South African virus circulation (Jupp 1973, Miller 2000). Cx. univittatus preferentially breeds in nutrient-poor water with emergent vegetation such as flooded grasslands, agricultural areas, and shallow wetlands (Jupp and McIntosh 1967). The vector's ecology is sensitive to seasonal temperature and moisture variability.
South Africa's temperature and moisture conditions that influence Cx. univittatus population dynamics are altered by natural oceanic and atmospheric variability like the El Niño Southern Oscillation (ENSO). El Niño events consistently bring widespread drier than normal summer conditions while La Niña events generally bring wetter than average conditions to Central and Eastern South Africa (e.g., Van Heerden et al. 1988). ENSO events may explain a large fraction of summer climatic variability, depending on the direction of tropical stratospheric equatorial winds also known as the quasi-biennial oscillation (QBO) (Mason and Lindesay 1993). During the easterly phase (defined as the negative QBO phase), ENSO tends to suppress late summer season precipitation.
The association between WNV outbreaks and abiotic conditions appears to be both vector and place-specific. Drought is linked to WNV outbreaks at various times of the year; the preceding spring, the concurrent summer, and previous year in Romania, Russia, and the United States (Han et al. 1999, Despommier 2001, Platonov et al. 2001, Landesman et al. 2007). Conversely, much wetter than normal summer precipitation is linked to a South African epidemic producing ∼18,000 human WNV cases (McIntosh 1976). Historic WNV outbreaks in South Africa, Russia, and the United States are tied to anomalously hot summer temperatures (McIntosh et al. 1976, Jupp et al. 1986, Reisen et al. 2006, Platonov et al. 2008, Ruiz et al. 2010). Interannual summer precipitation change (ISPC) is suspected of initiating South African mosquito-borne disease outbreaks, but these hypotheses have not been tested formally (Findlay and Whiting 1968, McIntosh 1980). Both anomalous temperature and precipitation over various times of the year are related to South African WNV transmission.
We hypothesize that anomalous summer season or interannual summer season changes in climatic conditions will exhibit strong and consistent relationships to the magnitude of WNV and SINV transmission. We relate temperature, precipitation, and climate oscillations to Cx. univittatus and sentinel pigeon virus infection rates in the semi-arid Highveld and arid Karoo in South Africa. Next, we attempt to detect similar climate associations to historically reported Highveld WNV/SINV human outbreaks dating back to 1941. Finally, we expand upon mechanisms potentially mediating precipitation and disease transmission relationships.
Materials and Methods
Study Area
WNV and SINV outbreaks were reported from 1941–1984 across the inland grasslands of the South African Highveld plateau (elevation 1200–1800 m) and arid Karoo desert (elevation 400–1400 m) (Fig. 1). Longitudinal WNV and SINV studies were previously conducted in the Highveld at Olifantsvlei and in the Karoo at Bethulie.
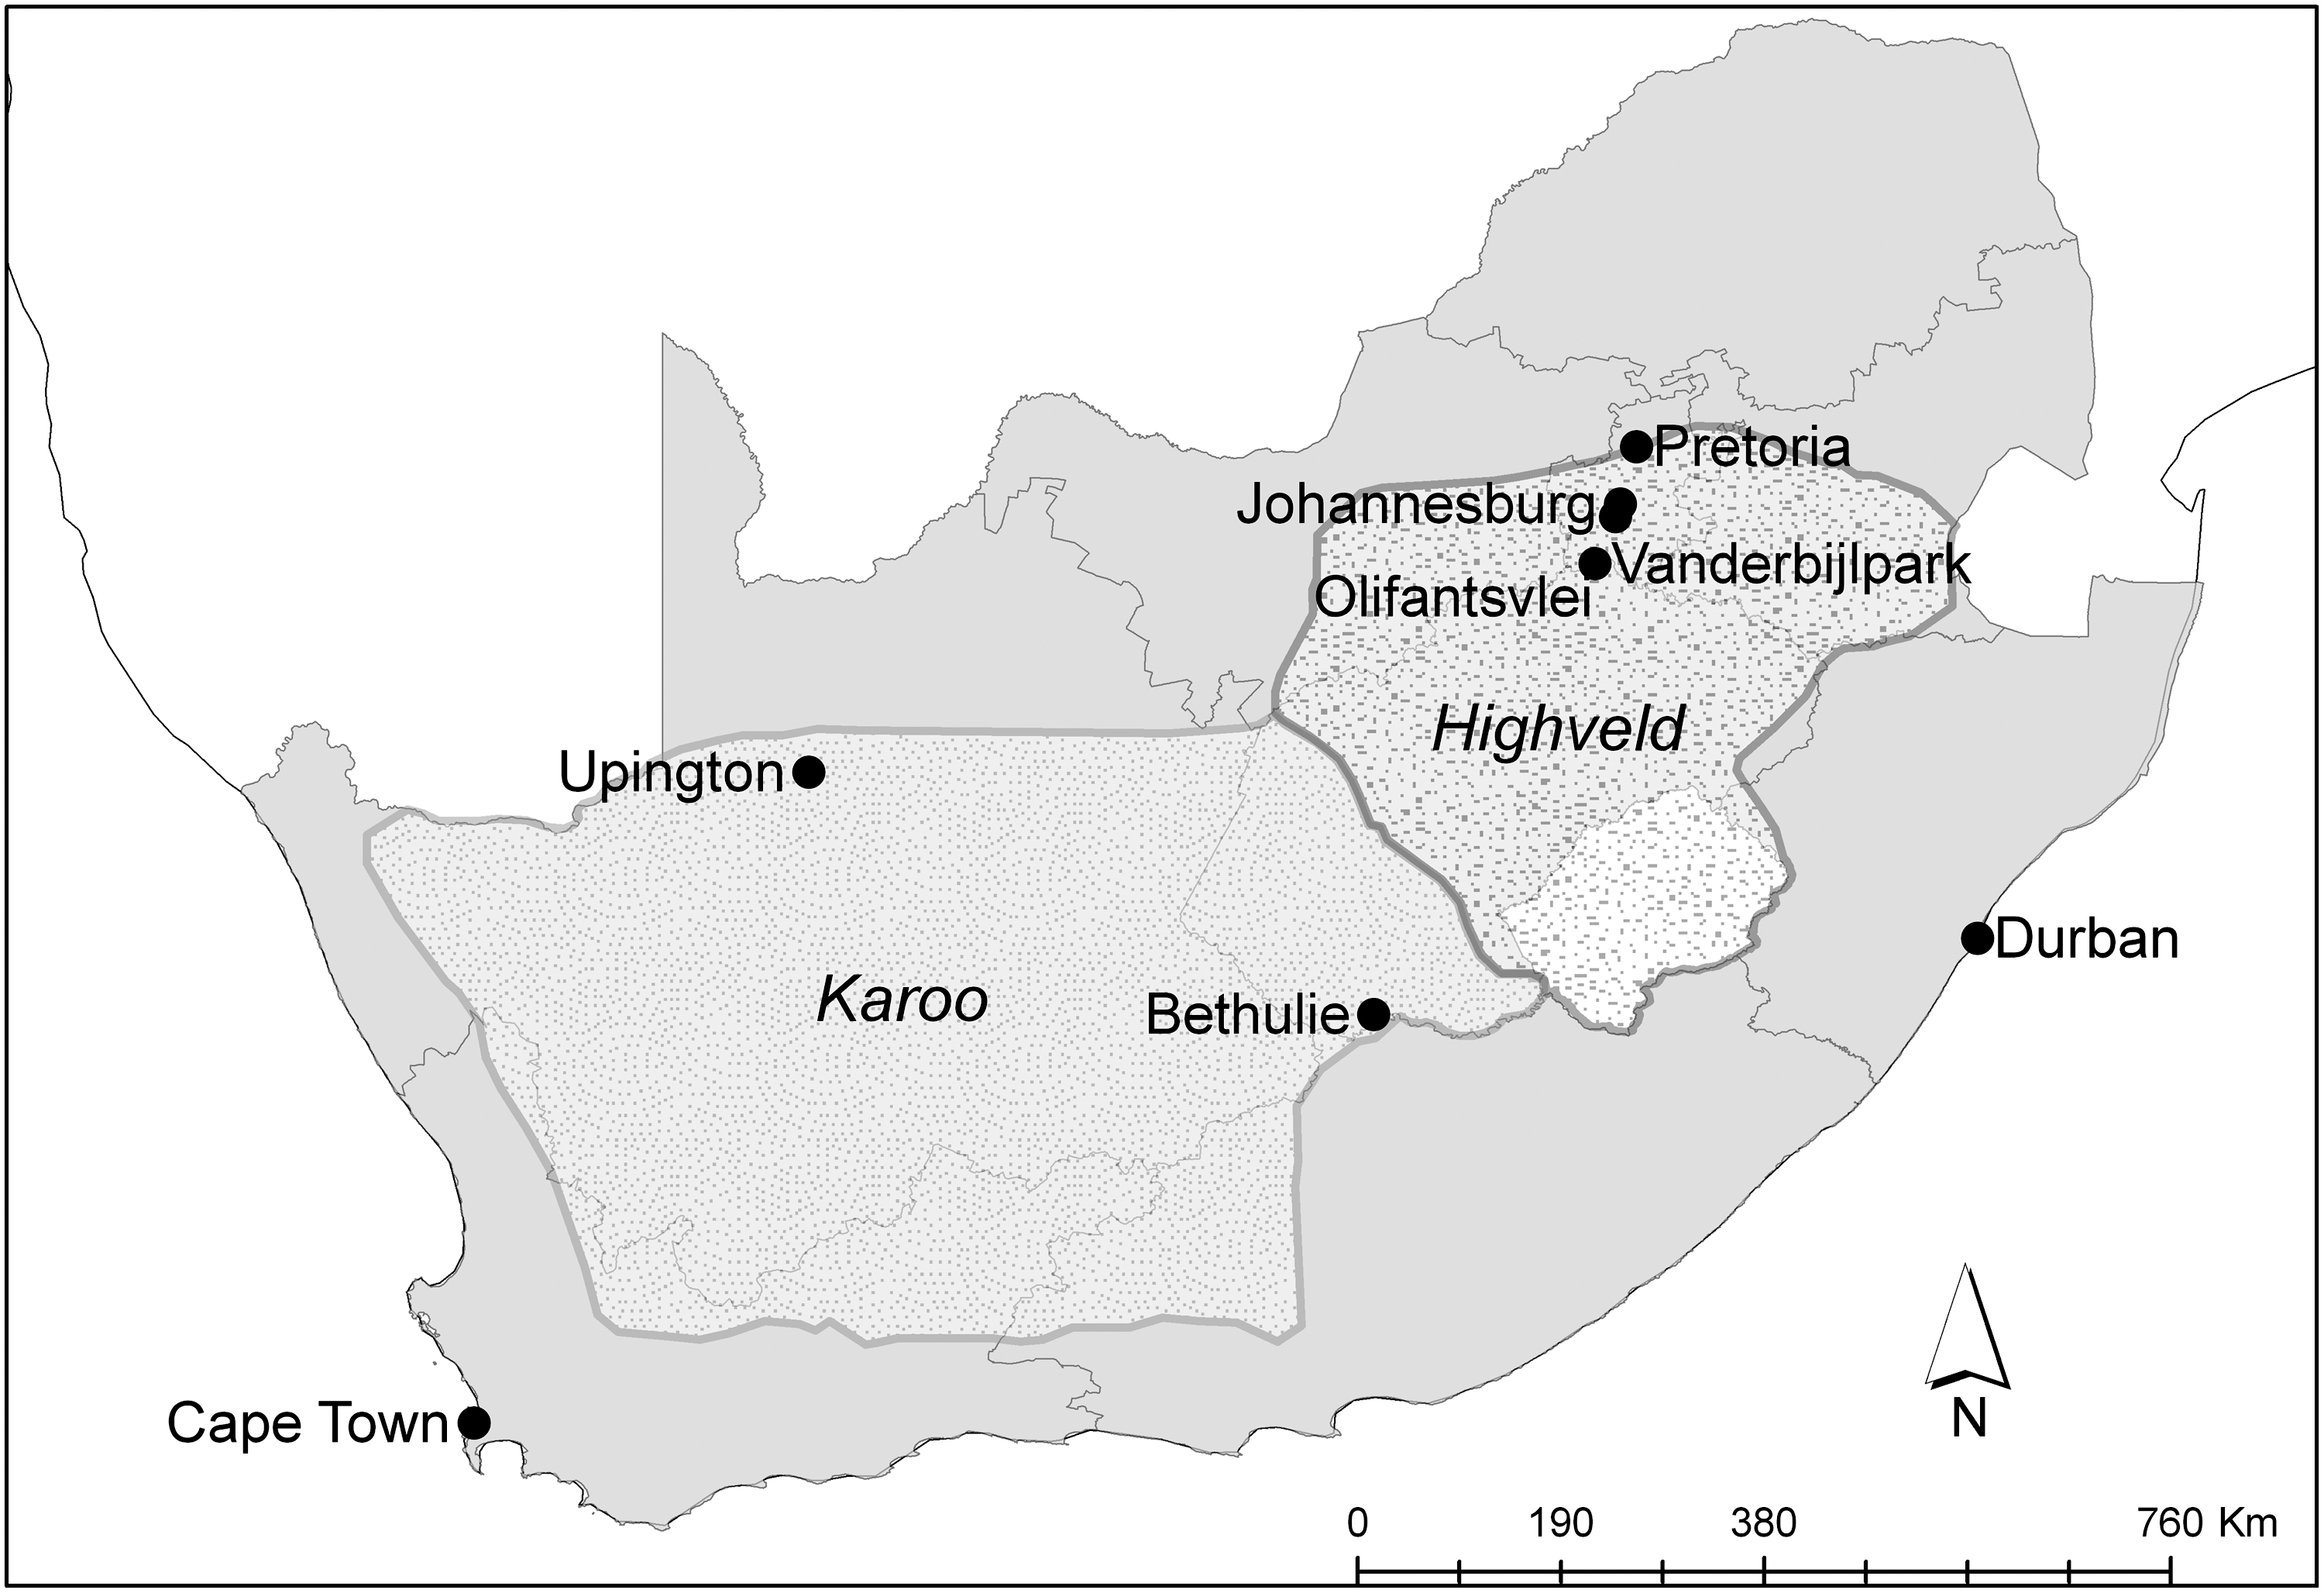
Map of South African provinces, selected cities, and interior Highveld grassland plateau (24–28°S, 26–30°E) and Karoo desert (27–34°S,16–24°E) ecological regions. Intensive field studies were conducted at Olifanstvlei and Bethulie.
Data
Our first analysis quantified the extent to which published seasonal Cx. univittatus and sentinel pigeon WNV and SINV infection rates at Olifantsvlei and Bethulie (McIntosh et al. 1967, 1978, McIntosh and Jupp 1979) were associated with precipitation, temperature, and climate oscillations over 1962–1971. Mosquitoes were collected from lard-can traps baited with carbon dioxide for two trap nights each week at Olifantsvlei. Olifantsvlei trapping took place from November–April for 4 years and January–April for 5 years (Table 1). Mosquito were collected for 3 years at Bethulie from January–April (McIntosh et al. 1978). This data set has two limitations. First, Olifantsvlei Cx. univittatus infection rates were calculated over similar but not identical periods. Minimal WNV and SINV transmission occurred between November and December. Thus, the infection rates in the later period (1966–1972) may be slightly artificially elevated compared to 1962–1965. Second, elevated virus transmission was recorded in relatively few years. A longer data record would increase the confidence in the study findings.
Culex univittatus was monitored from November to April over 1962–1965 and from January to April over 1966–1972 (excluding 1968 and 1971).
The total number of Cx. univittatus collected each summer season tested for WNV and SINV.
The minimum IR is defined as the number of virus isolates per 1000 Cx. univittatus.
IR, infection rate; SINV, Sindbis virus; WNV, West Nile virus.
Cx. univittatus were pooled by collecting site and frequently inoculated into mice on the same day mosquitoes were collected (McIntosh et al. 1967). The number of Cx. univittatus pools tested over 1966–1972 ranged from 51 to 164 per year. Complement-fixation and neutralization tests isolated WNV and SINV from mosquito pools (McIntosh et al. 1967). Virus isolation counts were standardized into infection rates per 1000 Cx. univittatus (minimum infection rate). Monthly studies of sentinel pigeon WNV and SINV infection were simultaneously conducted at both locations over 1967–1971 and standardized into an infection rate per 1000 pigeon-days of exposure (Table 2). Each month infected sentinel pigeons were replaced with immunologically naïve pigeons (McIntosh and Jupp 1979). Sentinel pigeon infection rates were evaluated for consistency with mosquito infection rates.
Time sentinel pigeons were monitored in the field. This effective exposure time is the total number of sentinel pigeon days from one to four pairs of pigeons at Olifantsvlei and eight pairs of pigeons at Bethulie.
IR is defined as the number of infected sentinel pigeons per 1000 days of exposure.
The second analysis examined the consistency of climate and virus relationships derived from the first analysis with a longer record of historic WNV/SINV outbreaks. Historic outbreaks lack appropriate serological data to distinguish WNV from SINV. Given the similar disease transmission cycles, ecologies, and human clinical manifestations, we jointly analyzed reported WNV/SINV outbreaks. Eight historic South African WNV/SINV outbreaks, the region affected, the municipality that reported the first clinical human WNV or SINV case (probable index case city), and the more prevalent circulating virus are described in Table 3 (Weinbren 1955, Cochrane and Loewenthal 1955, Findlay and Whiting 1968, McIntosh et al. 1976, Jupp et al. 1986). The 1954 and 1955 outbreaks were reported as unspecific “epidemic follicular keratosis” and retrospectively reclassified as probable WNV/SINV outbreaks (Findlay and Whiting 1968). Personal communication cited in McIntosh et al. (1967) is the only evidence of the 1941 outbreak.
Unreported or unknown information is denoted by the “—” symbol.
Table 4 enumerates the precipitation, temperature, and climate oscillations data sources and period over which data were aggregated for the analysis (Vose et al. 1992, Peterson et al. 1998). Precipitation and temperature anomalies were aggregated into three summer season definitions (November–March, December–March, and November–February). Table 4 also lists the reference period for generating anomalies and the number of weather stations that recorded each variable. Climate variables were converted into anomalies from long-term averages to remove seasonality. Anomalous temperatures were calculated over a shorter time period to minimize the effect of gradually increasing average temperatures. We also generated an ISPC time series, which is simply the change in total summer precipitation from the previous year to the current year. A positive ISPC is defined as a transition from relatively drier conditions in the previous year to wetter conditions in the current year. An ISPC from extreme drought to normal precipitation is comparable to a change from dry to moderately wet conditions. This metric emphasizes the magnitude of year-to-year precipitation changes instead of deviations from long-term average conditions.
The table lists how monthly climate information was aggregated. Climate variables were converted into anomalies from a long-term average calculated over the reference period to remove seasonality. The second analysis of WNV/SINV outbreaks considered all stations listed in the table. Independent variables denoted with a “—” were not converted into anomalies. Sea surface temperatures were averaged over multiple stations, some of which changed over time.
Global Historical Climatology Network database version 2 (Vose et al. 1992).
Global Historical Climatology Network database version 2 beta, South African Weather Service (1960–1997) (Peterson et al. 1998).
Extended Reconstructed Sea Surface Temperature version 2 (Smith and Reynolds 2004).
QBO Zonal Wind Index (Naujokat 1986).
QBO, quasi-biennial oscillation.
Tropical Pacific Ocean sea surface temperatures in the Nino 3.4 region (5°N–5°S, 120°–170°W) provide robust and representative measurements of the ENSO (Smith and Reynolds 2004). Sea surface temperatures anomalies were grouped into sequential 3-month periods to reduce intra-seasonal variations. The QBO index of monthly average 30 millibar stratospheric winds was classified into average westerly or easterly conditions based on the January QBO direction (Naujokat 1986). Univariate analysis determined the best-fitting precipitation, temperature, and climate oscillation temporal definitions as measured by Akaike's Information Criterion (AIC) to be included in the multiple variable analyses.
Study design and analysis
The first analysis examined WNV and SINV transmission. We used multiple ordinary least squares regression with a backward stepwise variable selection procedure and stopping criterion of p<0.05 to model mosquito infection rate and climate relationships. For each virus, three separate models of mosquito infection rates and precipitation (concurrent year's total summer precipitation, previous year's total summer precipitation, and ISPC) were generated. Each model also included the covariates of the concurrent year's minimum temperature, ENSO, and the interaction between ENSO and QBO phase. Minimum temperature had the most complete data record and was selected over other temperature metrics. Geographically proximate weather stations provided precipitation and temperature information for Olifantslvei (Joubert Park, Zwartkopjes) and Bethulie (Bethulie, Glen College). Standard diagnostic procedures assessed whether regression assumptions (e.g., autocorrelation residuals) were fulfilled in the final models. The best-fitting precipitation model had high fractions of explained variance, low AIC values, and low mean absolute errors (MAE) from a leave-one-out jackknifed cross-validation procedure.
The second analysis tested the consistency of local climate variability, oscillation, and mosquito infection relationships to reported WNV/SINV outbreaks in the Highveld. Each Highveld weather station missing less than 15% of observations were summed (precipitation) or averaged (temperature) into summer season periods. The summer season records were then converted into z-scores, and z-scores were averaged across the Highveld. The first reported outbreak was recorded before QBO measurements commenced in 1952. Multiple variable logistic regression analysis first tested how precipitation, temperature, QBO, and the QBO/ENSO interaction were related to outbreaks over 1952–2001. If the QBO was not related to outbreaks, the terms were removed, and the analysis was repeated over (1931–2001). Logistic regression assumptions were verified and the best-fitting model was determined by the largest area under the Receiver Operating Characteristic curve.
Results
The average Olifantsvlei vector WNV infection rate of 1.09 per 1000 mosquitoes was greater than the SINV rate of 0.77. WNV and SINV mosquito infection rates are strongly correlated (r=0.81), which is consistent with their similar disease transmission cycles and ecologies. The number of sequential infection rate observations was too small to formally test if heightened virus transmission in the current year dampened disease transmission in the following year.
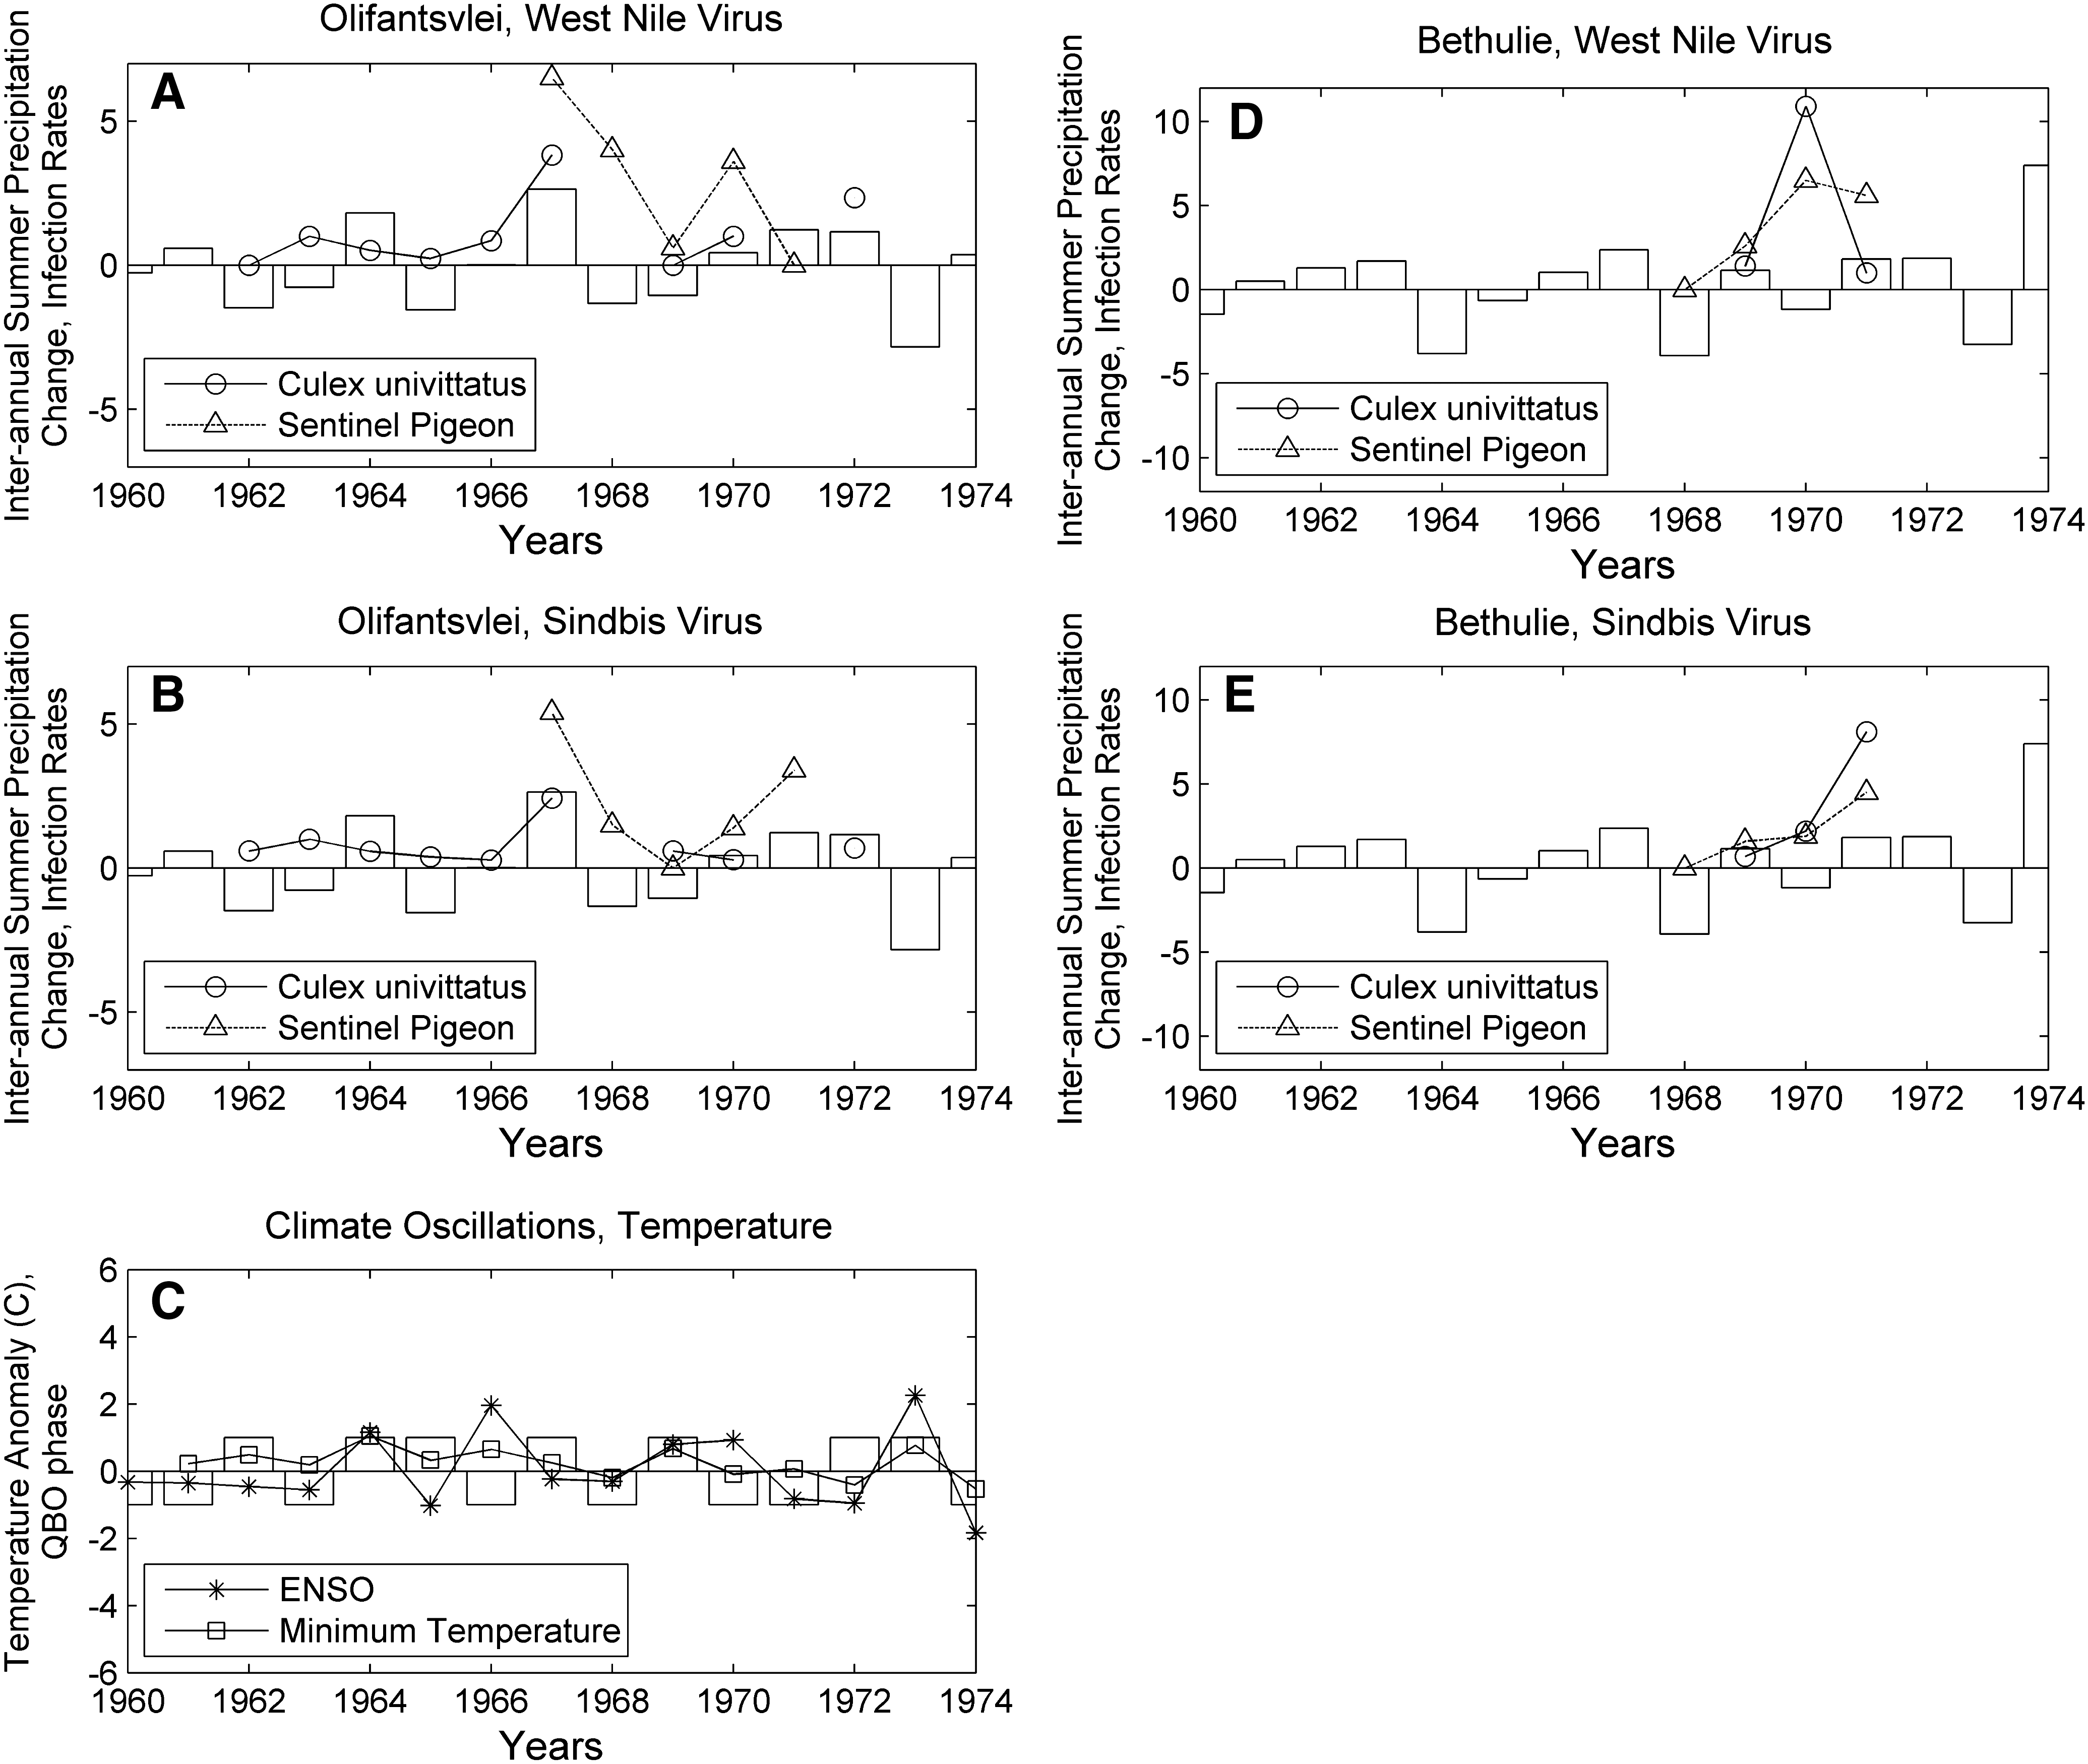
Figure 2 overlays Cx. univittatus WNV and SINV infection rates, sentinel pigeon infection rates, and ISPC (November–March) expressed in units of 100 mm at Olifantsvlei and Bethulie. Figure 2C plots the relationship between minimum summer temperature (November–March), sea surface temperature anomalies (October–December), and the QBO phase (negative-easterly, positive-westerly). Summer temperatures are partially approximated by the interaction between the QBO and ENSO (r=0.71). Olifantsvlei Cx. univittatus WNV infection rates are strongly correlated to ISPC (and summer precipitation, not shown), whereas SINV rates are marginally significantly (p ∼0.10) positively associated with ISPC (Fig. 2A, B). The small sentinel pigeon sample size prevented formal statistical testing but ISPC generally parallels SINV but not WNV rates (Fig. 2A, B). An analogous study in an arid environment at Bethulie was similarly constrained by a small number of observations. In Bethulie, neither WNV mosquito nor sentinel pigeon infection rates align with anomalous precipitation, temperature, or climate oscillations (Fig. 2D). There is more concordance but an imperfect relationship between Bethulie SINV mosquito and sentinel pigeon infection rates (Fig. 2E).
West Nile virus (WNV)
Figure 3 provides a closer examination of the best fitting ISPC (November–March) and climate oscillation relationships to observed Olifantsvlei WNV mosquito infection rates (R 2 =0.78, MAE=0.74 for WNV-positive Cx. univittatus/1000 tested Cx. univittatus). Each 100 mm change in ISPC increased WNV infection rates by 0.39 (95% CI, 0.21 to 0.57). Accounting for the interaction between climate indices further strengthened the mosquito infection rate relationship (Table 5).
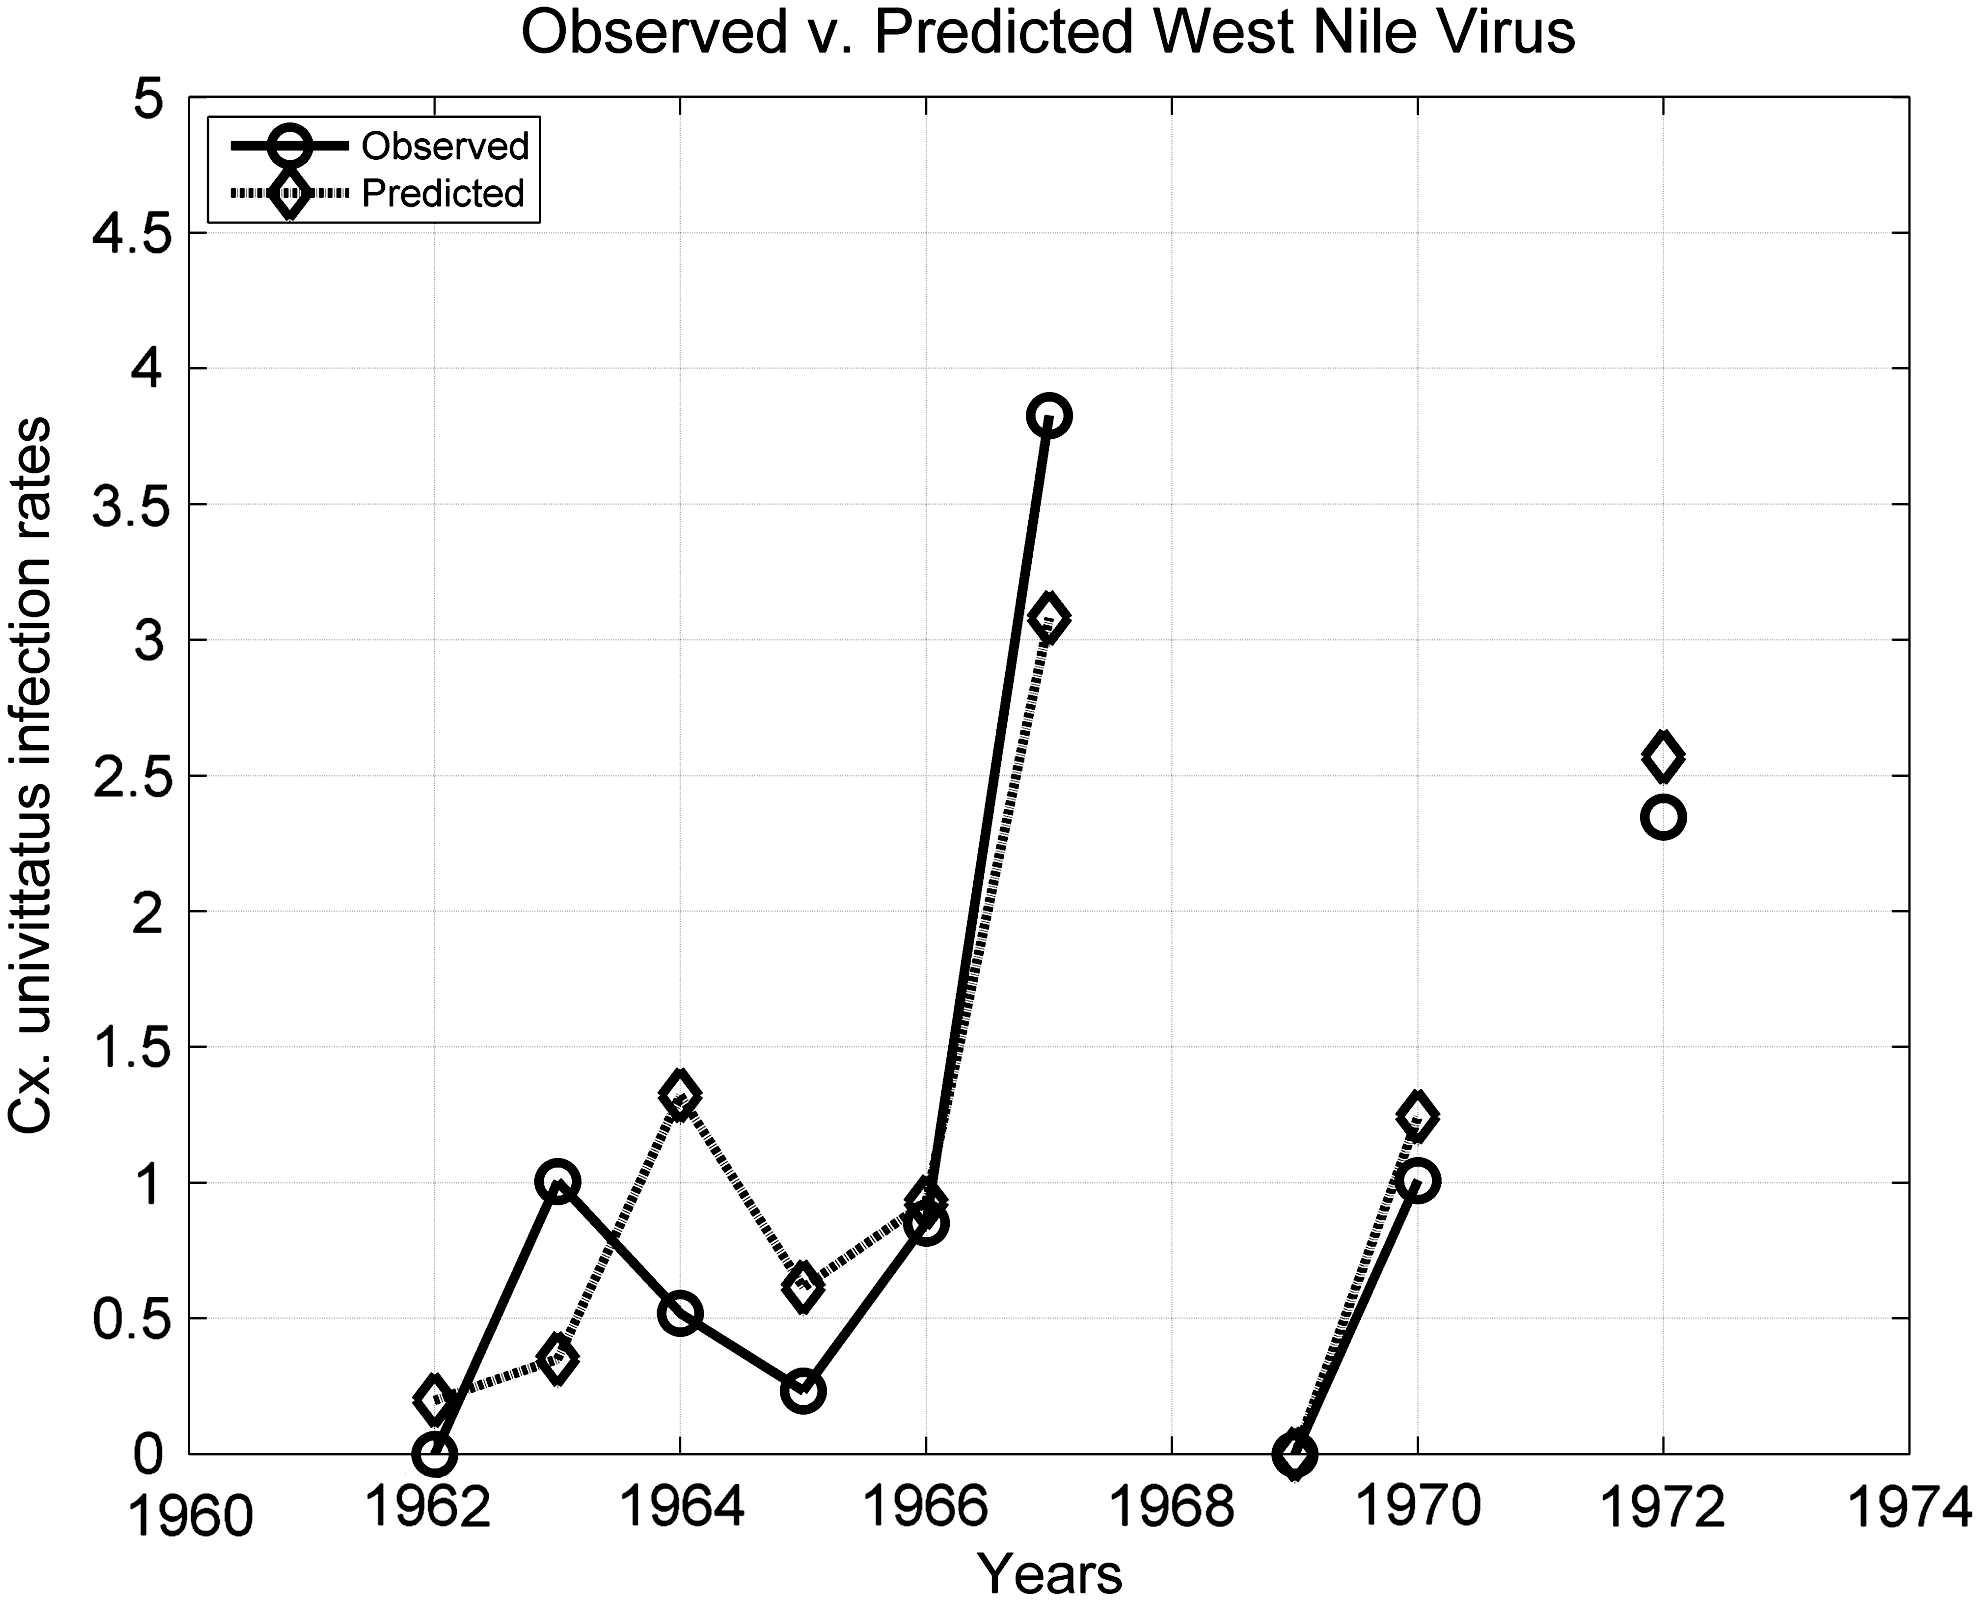
Observed Culex univittatus WNV infection rates correspond well with predicted infection rates (R 2: 0.78, mean absolute error: 0.74) at Olifantsvlei. Predicted infection rates are generated from a statistical model considering interannual summer season precipitation change and the interaction between El Niño Southern Oscillation and the quasi-biennial oscillation. The negative 1969 infection rate predicted by the multiple ordinary linear least squares regression is set to zero for illustration purposes.
The MAE units are infection rates per 1000 Cx. univittatus. The MAE was generated from a jackknifed leave-one-out cross-validation procedure.
Summer season defined as November–March.
The QBO is the shift in equatorial stratospheric winds.
The interaction between the quasi-biennial and El Niño Southern Oscillations may alter South African climatic conditions. The interaction multiplies Tropical Pacific sea surface temperature anomalies (El Niño Southern Oscillation) by the phase of upper stratospheric equatorial winds (QBO).
MAE, mean absolute error.
In the multiple variable models, concurrent total summer precipitation, the previous year's total summer precipitation, and ISPC all exhibited strong relationships to Olifantsvlei WNV vector infection rates (Table 5). All models met the regression assumptions. The previous year's total summer precipitation analysis was consistent with the stronger ISPC associations. Every 100 mm of above normal precipitation in the previous summer (November–March) decreases WNV mosquito infection rates by −0.52 (95% CI, −0.94 to −0.09) in the following summer. Each degree of above-normal concurrent summer season (November–March) minimum temperatures was inversely related to WNV infection rates (−1.19; 95% CI, −2.06 to −0.32).
The second analysis examined if environmental signatures relevant to seasonal WNV/SINV transmission may also control historic outbreak genesis. The results from the logistic regression analysis show that ISPC z-scores (November-March) are positively associated with six WNV/SINV outbreaks recorded in the Highveld (2.16; 95% CI, 1.11 to 4.20). Large ISPC corresponds to recorded outbreaks as the area under the Receiver Operating Characteristic curve (0.79) is well above the null value of 0.50. Concurrent total summer season precipitation was marginally significantly (p=0.06) associated with reported WNV/SINV outbreaks. Both models fulfilled the logistic regression assumptions. After considering precipitation, neither temperature nor climate oscillations were consistently related to historic WNV/SINV outbreaks. In the historical analysis, climate oscillations may still indirectly influence precipitation but do not independently influence recorded outbreaks.
Discussion
We identified systematic interannual precipitation and WNV and SINV relationships in South Africa's long disease record. Summer precipitation and ISPC explain a large fraction of seasonal vector infection variability and relate closely to recorded outbreaks. Low ISPC values may approximate two different disease transmission processes. During consecutive wet summers, low ISPC may approximate high avian host herd immunity levels. In sequential dry summers, low ISPC represents low vector population densities and disease transmission. This long-term study improves upon individual outbreak reports where environmental conditions may be coincidentally related to anomalous disease transmission. This study also expands upon weather and WNV transmission studies (e.g., Soverow et al. 2009) by illustrating that climate influences WNV transmission from 1 year to the next.
Remarkably, the previous year's precipitation is emerging as a driver of WNV transmission in subtropical areas. Incident U.S. WNV cases are linked to the previous year's total annual precipitation and the effect is modified by geographic location. Consistent with the South African Highveld, more precipitation in the previous year decreases the current year's WNV transmission west of the Mississippi River (excluding California), United States (Landesman et al. 2007, DeGroote et al. 2008, Reisen et al. 2009). However, the converse appears to be true east of the Mississippi. Total annual precipitation captures information leading up to, during, and following the WNV transmission season. This metric may be confounded with precipitation in the late fall and early winter that are loosely related to summer WNV transmission. Future studies should consider precipitation at multiple temporal lags and interannual summer precipitation change. In practice, the previous year's precipitation may provide timely WNV transmission intensity forecasts for mosquito managers.
Strong ISPC influences on virus transmission are consistent with two overlapping disease amplification mechanisms; vector population explosions and decreased avian host herd immunity. Environmentally driven Cx. univittatus population explosions may result from an increase in larval habitats and/or a decrease in Cx. univittatus's predators/competitors. Abnormally large vector populations may result from drought and desiccation of ephemeral habitats in the preceding summer (Chase and Knight 2003, Lounibos 1985). Habitat desiccation may suppress drought intolerant mosquito competitors/predators. Mosquito populations may rebound before competitor/predator populations do in the following summer. An unrelated study documented temporary river desiccation during a normal summer precipitation season (Harrison et al. 1960). This suggests that other semi-permanent habitats may regularly desiccate. A Cx. univittatus population explosion and competitive displacement of Aedes (Ochlerotatus) juppi was documented in two epidemics with extremely wet summers in the desert Karoo, South Africa (McIntosh 1976). The population explosion was hypothesized to broaden Cx. univittatus's normally ornithophilic feeding preferences to increases mosquito–human contact and disease transmission.
Drought during the preceding summer may minimize avian herd immunity if accompanied by decreased arbovirus transmission. A larger fraction of susceptible avian hosts may survive and increase the risk of a WNV/SINV outbreak in the following summer. Avian herd immunity may conversely dampen WNV/SINV transmission the summer season immediately after an outbreak. McIntosh et al. (1968) estimated that 13–20% of the Highveld avian population was previously infected with WNV/SINV. However, historic molecular techniques exhibited low sensitivity to detect WNV/SINV antibodies and likely underestimated herd immunity. Avian recruitment can be sensitive to abiotic conditions in arid areas and may also influence WNV and SINV transmission (e.g., Hamer et al. 2008). This study could not measure the influence of herd immunity on interannual WNV and SINV transmission. More research is needed to determine interannual herd immunity and population variations in key avian amplifying hosts (Kilpatrick et al. 2006).
Precipitation in the preceding and concurrent summer is the dominant influence on the Highveld's WNV/SINV transmission. Concurrent summer temperatures can be considered secondary influences. Optimal temperatures decrease the time before a newly infected mosquito can retransmit a pathogen and increase the lifespan of an infected mosquito (Cornel et al. 1993). For South African WNV strains, optimal temperatures for WNV transmission correspond to below-average summer season temperatures. After controlling for the effect of the previous year's summer precipitation, Cx. univittatus WNV infection rates agree with laboratory studies and are inversely related to summer temperatures.
Elevated WNV/SIN transmission likely occurred since 1984 but was not documented. The primary reason is shifting South African public health priorities toward HIV/AIDS and chronic diseases and away from WNV/SIN mosquito and human surveillance. The second reason is that large ISPC shifts occur infrequently (Tyson 1971). The Highveld experiences multiyear cycles of below average precipitation followed by consecutive years of above average precipitation. Translating the ISPC and WNV/SINV outbreak logistic regression relationships to probabilities suggests that outbreaks may have occurred in 1934 (60%), 1953 (40%), 1996 (40%), and 2000 (70%).
The intensity of WNV and SINV transmission is related to the dynamics and interactions between the pathogen, vector, vertebrate hosts, and environment. Precipitation will not uniformly impact WNV transmission that may involve different virus strains, vector mosquitoes, and human infrastructure (Moudy et al. 2007, Reisen et al. 2008). For example, alternating patterns of dry and wet conditions synchronize WNV transmission between amplifying and bridge mosquitoes and avian hosts in the Southeastern United States (Day and Shaman 2008). It was beyond the scope of this study to examine other interannual WNV disease transmission drivers such as virus evolution and failing human infrastructure. In Central California, USA, foreclosed households and neglected swimming pools were associated with an outbreak of human WNV cases (Reisen et al. 2008). However, both virus evolution and human infrastructure are unlikely to mimic year-to-year changes in summer precipitation and ISPC.
The analysis of reported WNV/SINV outbreaks is limited by the quality and consistency of reported outbreaks. Uneven surveillance, recognition of WNV and SINV, and changing public health priorities suggest outbreaks may be inconsistently reported. Recorded outbreaks, nonetheless, exhibit the same relationship to precipitation as the shorter but in-depth WNV infection rate studies. Multiple years between WNV/SINV outbreaks pose challenges to public health institutions. Resources for public health surveillance and mosquito control may be waning at the same time an outbreak may be more likely to occur.
Footnotes
Acknowledgments
This work was supported by the Climate Assessment for the Southwest project at the University of Arizona, a Regional Integrated Sciences and Assessment initiative funded by the National Oceanic and Atmospheric Administration. The authors thank Robert Swanepoel, Stephen Yool, Willem van Leeuwen, and the Applied Climate for Environment and Society laboratory members at the University of Arizona for comments on earlier versions of the article. The authors also thank anonymous reviewers whose comments improved the article.
Disclosure Statement
No competing financial interests exist.