
Abstract
Aedes (Stegomyia) aegypti, the main vector of Dengue and Yellow Fever viruses, is present in all the northern and central provinces of Argentina. During 2009, a Dengue outbreak spread broadly throughout the country, causing 27,752 infections in 13 provinces. In Argentina, little is known about the demographic history of this vector, which suffered a drastic decrease in abundance and distribution during a major control campaign performed in the Americas between 1950 and 1960. With the aim of uncovering the past and present events that determined the present distribution of the genetic variability in Ae. aegypti populations, we analyzed the distribution and abundance of mitochondrial haplotypes obtained by sequencing a 450-bp fragment of the ND5 gene. We detected 14 haplotypes among the sequences of 197 individuals from 22 populations that cover most of the distribution of the species in Argentina; one population from Bolivia and one from Paraguay were also included. A high heterogeneity in the geographical distribution of the genetic polymorphism was observed, with a pattern of isolation by distance in the north-west of Argentina. Haplotypes nested in three haplogroups, representing different colonization events and evolutionary histories in distant geographical areas. North-western and north-eastern populations correspond to independent introduced stocks for which a past fragmentation and rapid restoration from highly polymorphic relicts were inferred. By contrast, a unique genetic variant was detected in the east, probably as the result of a recent re-colonization event after the major control campaign; in this area, the mosquito would have been practically eradicated as a consequence of the continental control campaign.
Introduction
A genetic approach to infer past processes from the geographical distribution of variants is particularly necessary in a country where little is known about the demographic history of the vector responsible of a re-emerging epidemiological threat. Different genetic markers have been used in studies performed on Ae. aegypti populations in Argentina. Rondan Dueñas et al. (2009) analyzed the genetic structuring of Argentine populations based on restriction fragment-length polymorphism (RFLP) of the A+T-rich region of the mitochondrial DNA. The results showed that passive migration from Brazil and Paraguay to Argentina would be strongly enhanced by human commercial traffic. The methods used in that study analyzed variation among populations. However, other analytical strategies proved to be useful to obtain information not only about the genetic diversity of populations, but also about the history of haplotypes. The origin of colonizing groups can be determined by exploring the relationships among genotypes (i.e., phylogeny of mtDNA haplotypes) of one or more populations relative to their geographical location, and interpreting the results from the phylogeographic perspective, that is, involving the geographical distribution of lineages and their genealogical relationships. Accordingly, Mousson et al. (2005) analyzed the variability levels of the mitochondrial genes COI, Cytb, and ND5 based on a hypothesis of multiple introductions of Ae. aegypti in America; the authors proposed that South American populations might have been established from different founding lineages, represented by successive colonization waves before and after the massive eradication programs. Urdaneta-Marquez et al. (2008) detected six different ND4 haplotypes in nine collections from Venezuela; patterns of variation suggest that collections are isolated by distance. In Argentina, Albrieu Llinás (personal communication) analyzed sequences of the mitochondrial gene ND4 and determined the presence of three haplotypes representing different Ae. aegypti lineages previously reported in other countries of America, Africa, and Asia (da Costa-da-Silva et al. 2005, Bracco et al. 2007).
Here we inferred the phylogenetic relationships among differentially distributed genetic variants of Ae. aegypti, with the aim of assigning present and past events to the origin of the stocks currently infesting Argentina. For that purpose, we conducted a phylogeographic analysis of the distribution and abundance of mtDNA haplotypes within and among populations, covering the entire distribution of the species in the country.
Materials and Methods
Sample collection and conservation
Third- and fourth-instar larvae of Ae. aegypti were collected from artificial containers, mostly used tires, located in urban centers (Table 1). Samples were taken from various containers per sampling site, and three or more different sites were chosen in each locality to reduce the risk of including directly related individuals. The harvested larvae were transported to the laboratory in 90% ethanol and analyzed morphologically following Darsie (1985), to avoid possible collection of other container-breeding mosquito species that inhabit the study area. Samples were stored at −20°C before DNA extraction.
H, haplotype diversity; π, nucleotide diversity; κ, mean number of nucleotide differences; n, number of individuals per population.
DNA extraction and PCR
Each larva was homogenized individually in a 1.5 mL centrifuge tube, with 250 μL of lysis buffer (10 Mm Tris-HCl, pH 8.0, 60 mM NaCl, 10 mM EDTA, and 5% [v/v] Triton X-100). After the addition of 3 μL of proteinase K (100 μg/μL) and 10% (w/v) SDS, the homogenates were incubated at 37°C for 12 h. Subsequent steps followed Ballinger-Crabtree et al. (1992). DNA precipitation was accomplished with 0.1 volume of sodium acetate (3M; pH 8.0) and 2 volumes of 100% ethanol. Samples were dried, suspended in 50 μL of TE buffer (10 mM Tris-HCl, pH 8.0, and 0.1 mM EDTA), and stored at −20°C. Genomic DNA was quantified with an Eppendorf biophotometer (Eppendorf) and DNA aliquots were standardized to a concentration of 10 ng/μL with TE.
A 450-bp fragment of the mitochondrial gene ND5 was amplified by means of polymerase chain reaction (PCR), using primers N5A (5′-GATCAAGG
Data analysis
The following genetic diversity indices were estimated using DnaSP software (Rozas et al. 2003): haplotype diversity (H), nucleotide diversity (π) as the mean number of substitutions per site between two sequences, and mean number of nucleotide differences (k). A haplotype network was constructed by statistical parsimony as implemented in TCS 1.21 software (Clement et al. 2000) at the 95% connection limit. The statistical significance of the geographical association among haplotypes after 10,000 replicates (α=5%) was assessed using GeoDis 2.6 (Posada et al. 2000). Templeton's inference key (Templeton 1995, revised in 2008) was used to determine the likely mechanism of the observed genetic structure. To support the topology obtained using a different methodology, a network based on Bayesian inference using MrBayes 3.1 software (Huelsenbeck and Ronquist 2001) was also constructed. The analysis began with two starting randomly generated topologies, with two chains each (one cold and three hot) and it was ran for 2,000,000 generations, reaching a sufficiently low standard deviation (<0.002). Markov chains were sampled every 1,000 generations; of the 2,000 topologies obtained, 200 were discarded by burn-in and the remaining ones were summarized in a consensus tree. All the PSRF (potential scale reduction factor) were close to 1. The analysis was performed with the GTR+G+I (Gamma=0.5574, I=0.5809) model, selected on the basis of the Akaike Information criterion, using Modeltest 3.7 software (Posada and Crandall 1998).
Population structuring was screened by means of the analysis of molecular variance (AMOVA), using Arlequin 3.0 (Excoffier et al. 2005). Pairwise F ST values were regressed on the logarithm of pairwise geographical distances to estimate whether isolation by distance exists among populations. Its significance was calculated by the Mantel (1967) test.
Results
Four hundred fifty base-pair sequences from 197 individuals were obtained and used for phylogeographyc and population genetic analyses. Fourteen haplotypes were detected based on 11 polymorphic sites (GenBank accession numbers: GQ855221 to GQ855234). The nucleotidic composition of this mtDNA fragment was 28.8% T, 14.3% C, 48.9% A, and 7% G.
Geographical distribution and the relative frequencies of the 14 haplotypes detected are shown in Figure 1. In many populations from the east only haplotype 1 was present, with frequencies that decreased toward the west and north-west of Argentina (NWA). However, this extremely low genetic diversity was not observed either in populations from the north-east of Argentina (NEA), very close to Brazil and Paraguay (Resistencia, Clorinda and Iguazú), or in samples from Asunción (Paraguay). To the west-NWA, we detected more haplotypes, two of which (H4 and H6) were shared with the Bolivian population included in our study (Yacuiba). This population also presented haplotype 5, which is absent in the remaining populations analyzed.
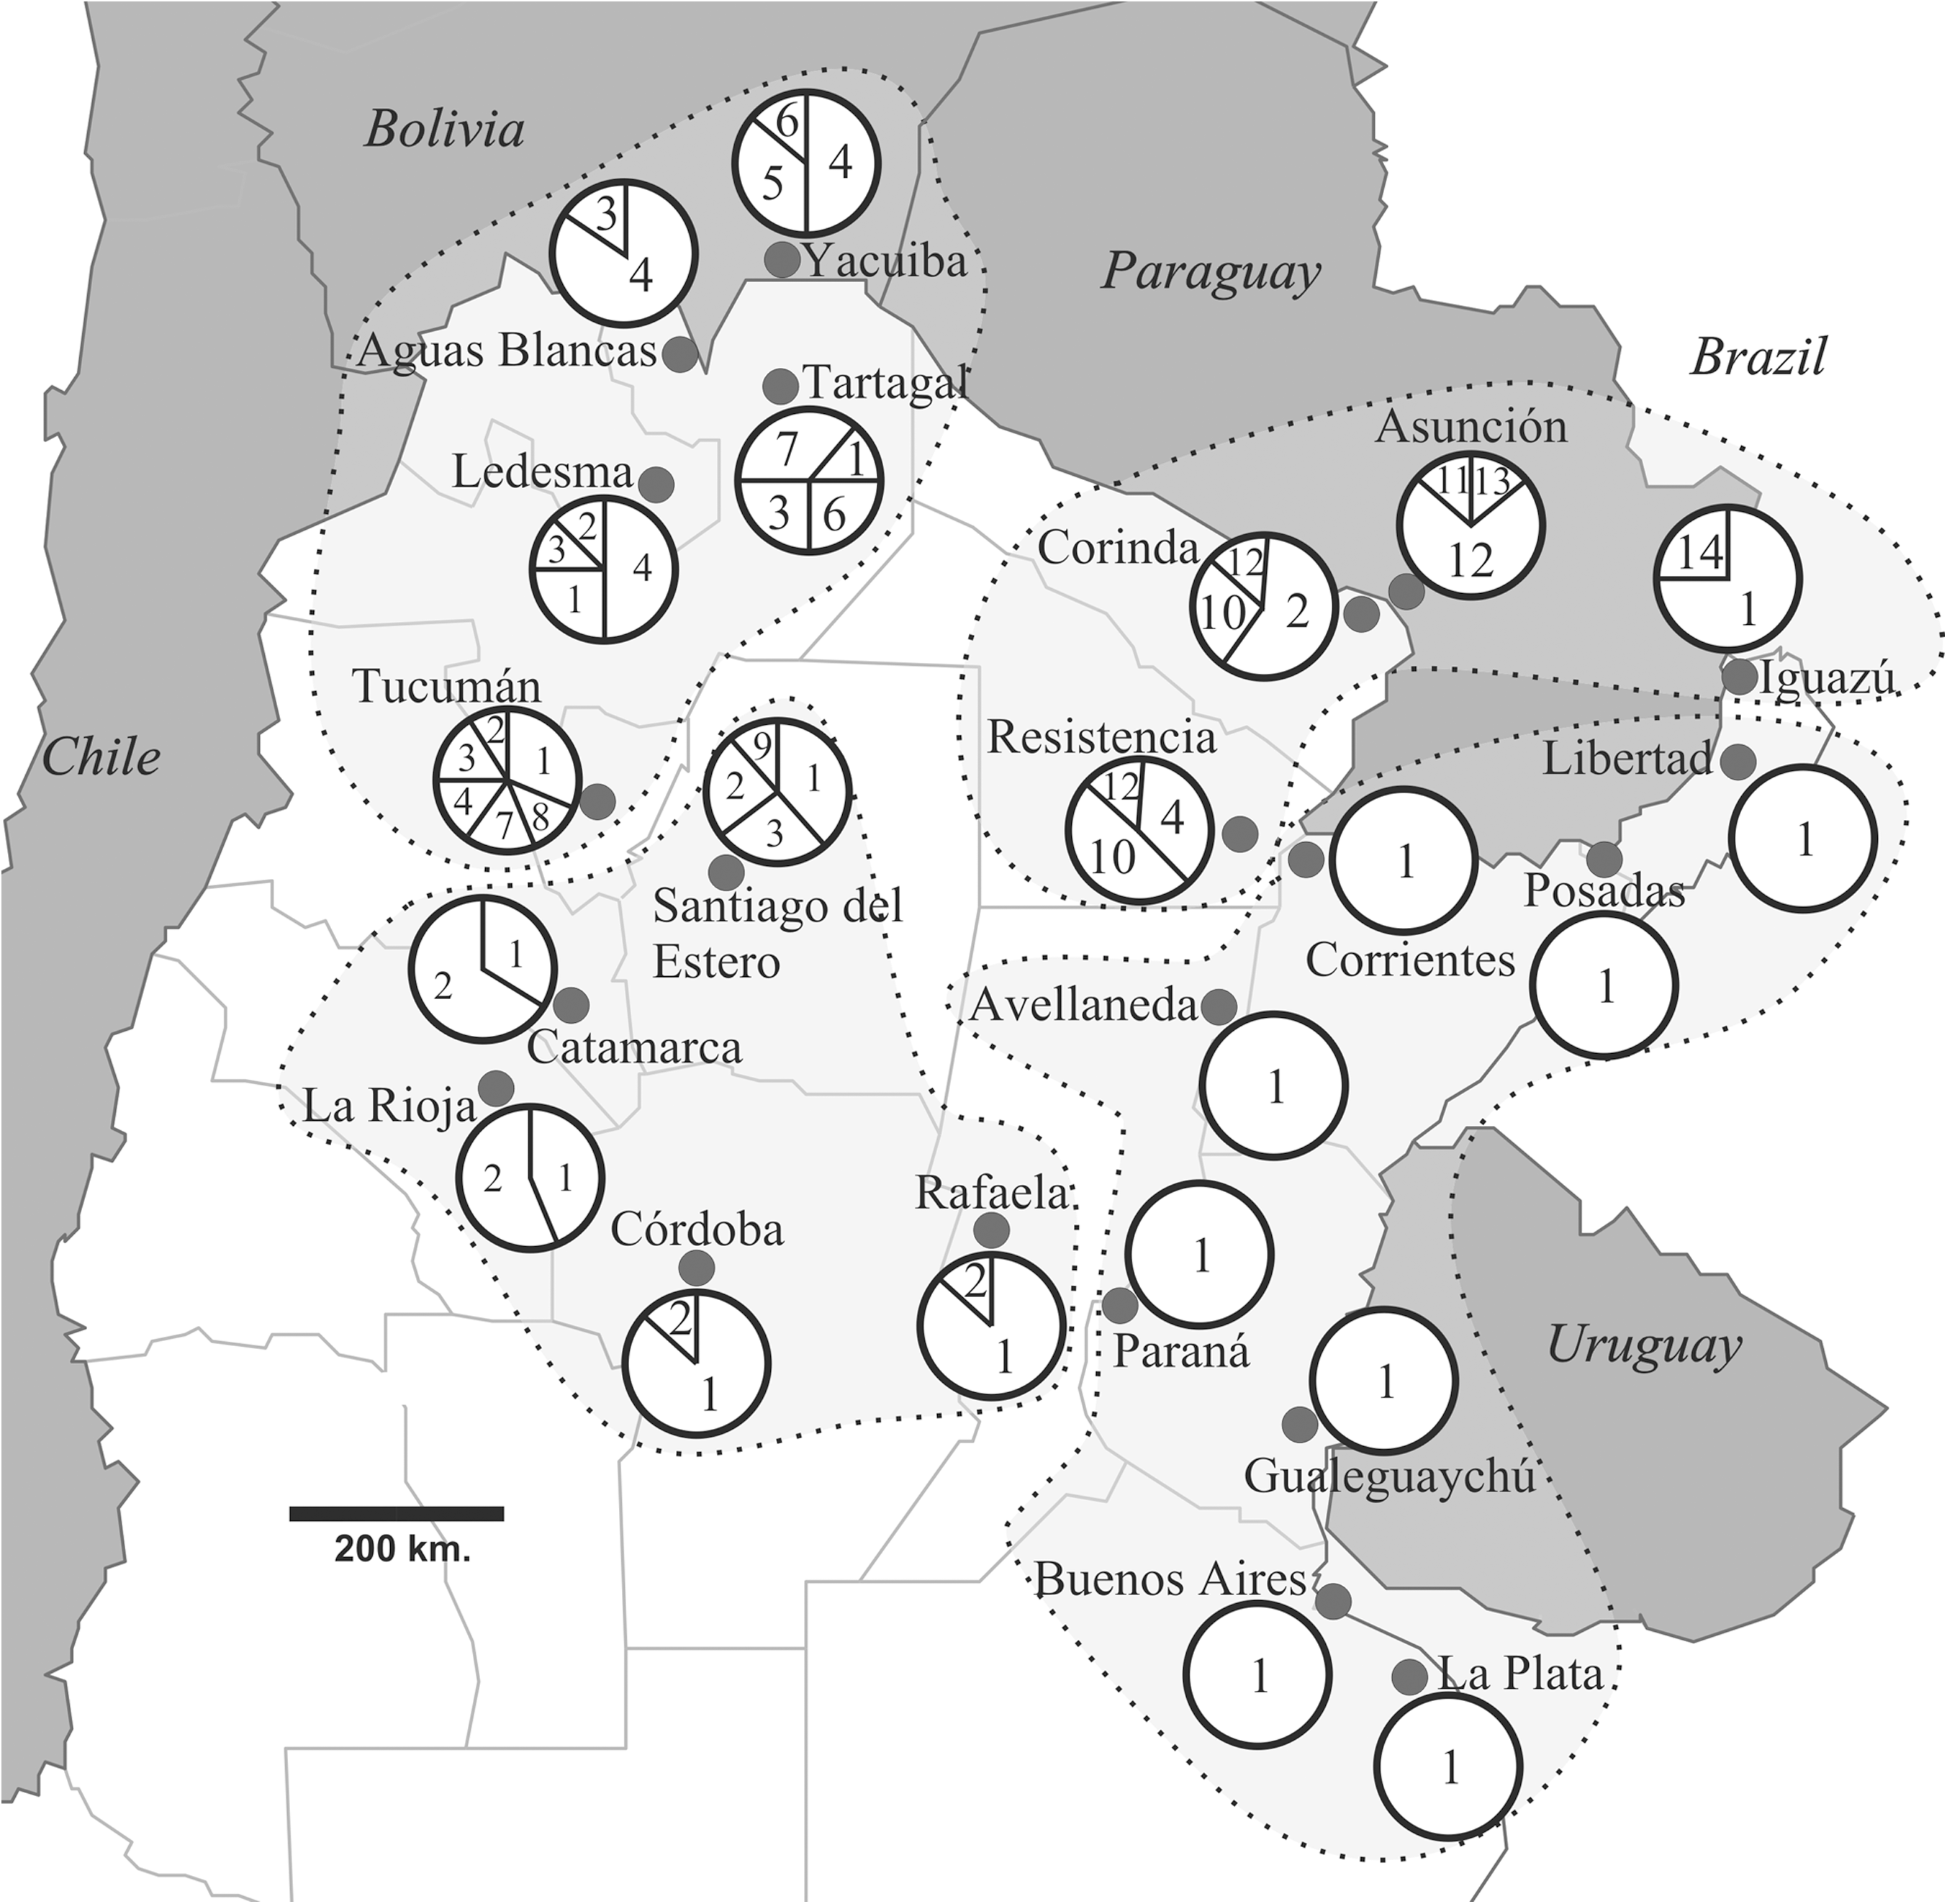
Partial map of Argentina and neighboring countries showing the distribution of haplotypes in the sampled localities. Each haplotype is identified by a number (1–14) and its frequency is proportional to the assigned area within each circle. The four groups used in the analysis of molecular variance are separated by gray areas with dotted borders.
The haplotype network constructed by statistical parsimony and the hierarchical design for the nested clade analysis (NCA) are shown in Figure 2. According to this clustering methodology, haplotypes were organized in seven one-step clades, included in three major haplogroups designated 2-1, 2-2, and 2-3. Clade 2-1 is represented by haplotypes mainly present in localities from NWA and in Bolivia (H2 to H7). Clade 2-2 contains haplotype 1, the one with the highest frequency (49.74% of a total of 197 individuals) and the broadest geographical distribution, although conspicuous in the east-NEA. Haplotypes 8 and 9, found in NWA (Tucumán and Santiago del Estero, respectively), also belong to this clade. Finally, clade 2-3 is composed of haplotypes present in localities from NEA and in Asunción (Paraguay) (H10 to H14).

Haplotype network for the ND5 gene of Aedes aegypti obtained by Statistical Parsimony. Each white circle corresponds to a haplotype (H1 to H14) and the size is proportional to its frequency. Each line represents a mutational step and black circles correspond to hypothetical haplotypes, not found in the sampled individuals. Light-gray areas (1-1 to 1-7): one step nested clades; dark-gray areas (2-1, 2-2 and 2-3): two steps nested clades.
Significant Dc and Dn values used for the NCA are shown in Table 2; this analysis was used to infer past events and processes to explain the phylogeographic patterns found. Among one-step clades, a pattern of restricted genetic flow with some degree of isolation by distance was suggested for clades 1-1, 1-2, and 1-5. At the highest hierarchical level, NCA revealed a historical origin in the present population structure. On the one hand, for clade 2-1 a past range expansion followed by fragmentation or extinction in intermediate areas was the most probable inference. On the other hand, the pattern observed for clade 2-2 might be determined by a long-distance colonization pattern. For the total cladogram, the inference was of past fragmentation followed by range expansion.
Only Significantly high (h) and low (l) values of Dc and Dn are shown.
The haplotype network obtained on the basis of the Bayesian approach is shown in Figure 3. Haplotypes clustered in three different groups, one of them mostly represented in populations from the west (H3, H4, H5, H6, and H7). In another group, containing haplotype 1, many haplotypes collapsed in one position due to the low level of differentiation among them. The third group was composed of haplotypes exclusive to populations from the east (H13 and H14). In summary, the topology of three phylogenetically different groups was very similar to the one obtained by statistical parsimony.
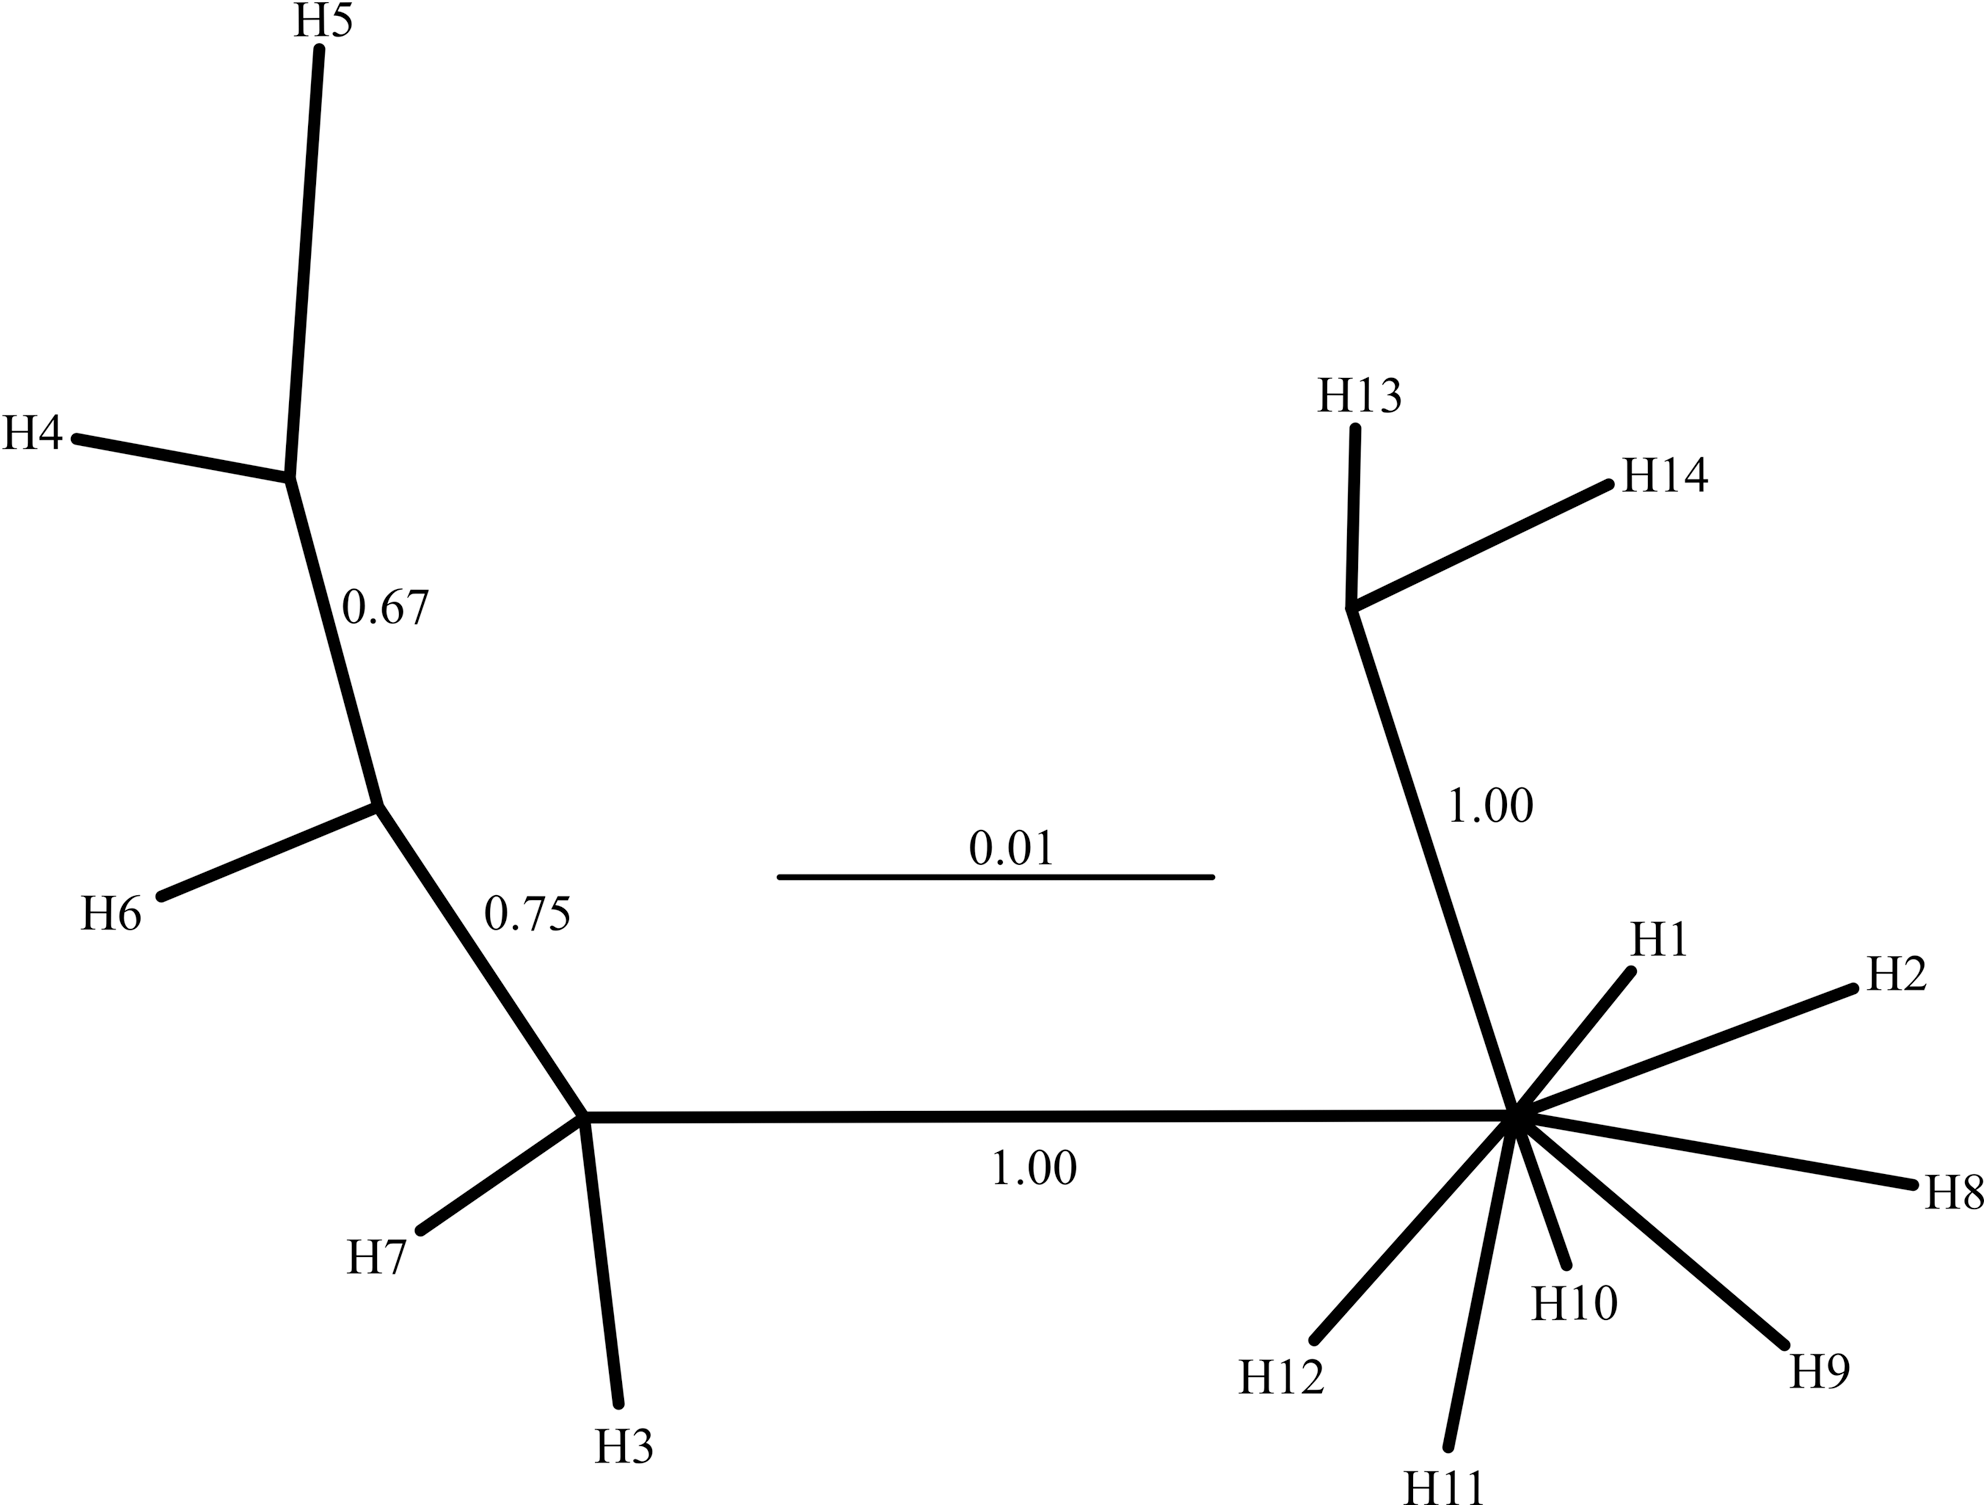
Haplotype network (50% majority rule consensus) obtained with Bayesian Inference. Each terminal corresponds to a haplotype, and numbers on the branches represent posterior probabilities used as support values.
To evaluate the possible existence of subpopulations within the two geographical regions (west and east) that were considered to be differentially affected by human commercial traffic (Rondan Dueñas et al. 2009), an AMOVA was performed by grouping populations according to their correspondence to four groups with differential haplotype composition. A high percentage of sequence variability (44.27%) was explained among the defined groups, followed by 37.92% within populations and 17.81% among populations; this analysis supported the existence of genetic structuring in the sampled populations, since all the fixation indices showed highly significant values (Table 3).
Significance tests=10100 permutations.
The Mantel test identified correlation between genetic and geographical distances when it was performed only with populations from the west of Argentina and the one from Bolivia (Tartagal, Aguas Blancas, Ledesma, Tucumán, Santiago del Estero, Catamarca, La Rioja, Córdoba, and Yacuiba) (r=0.7785, p=0.0003; Fig. 4).
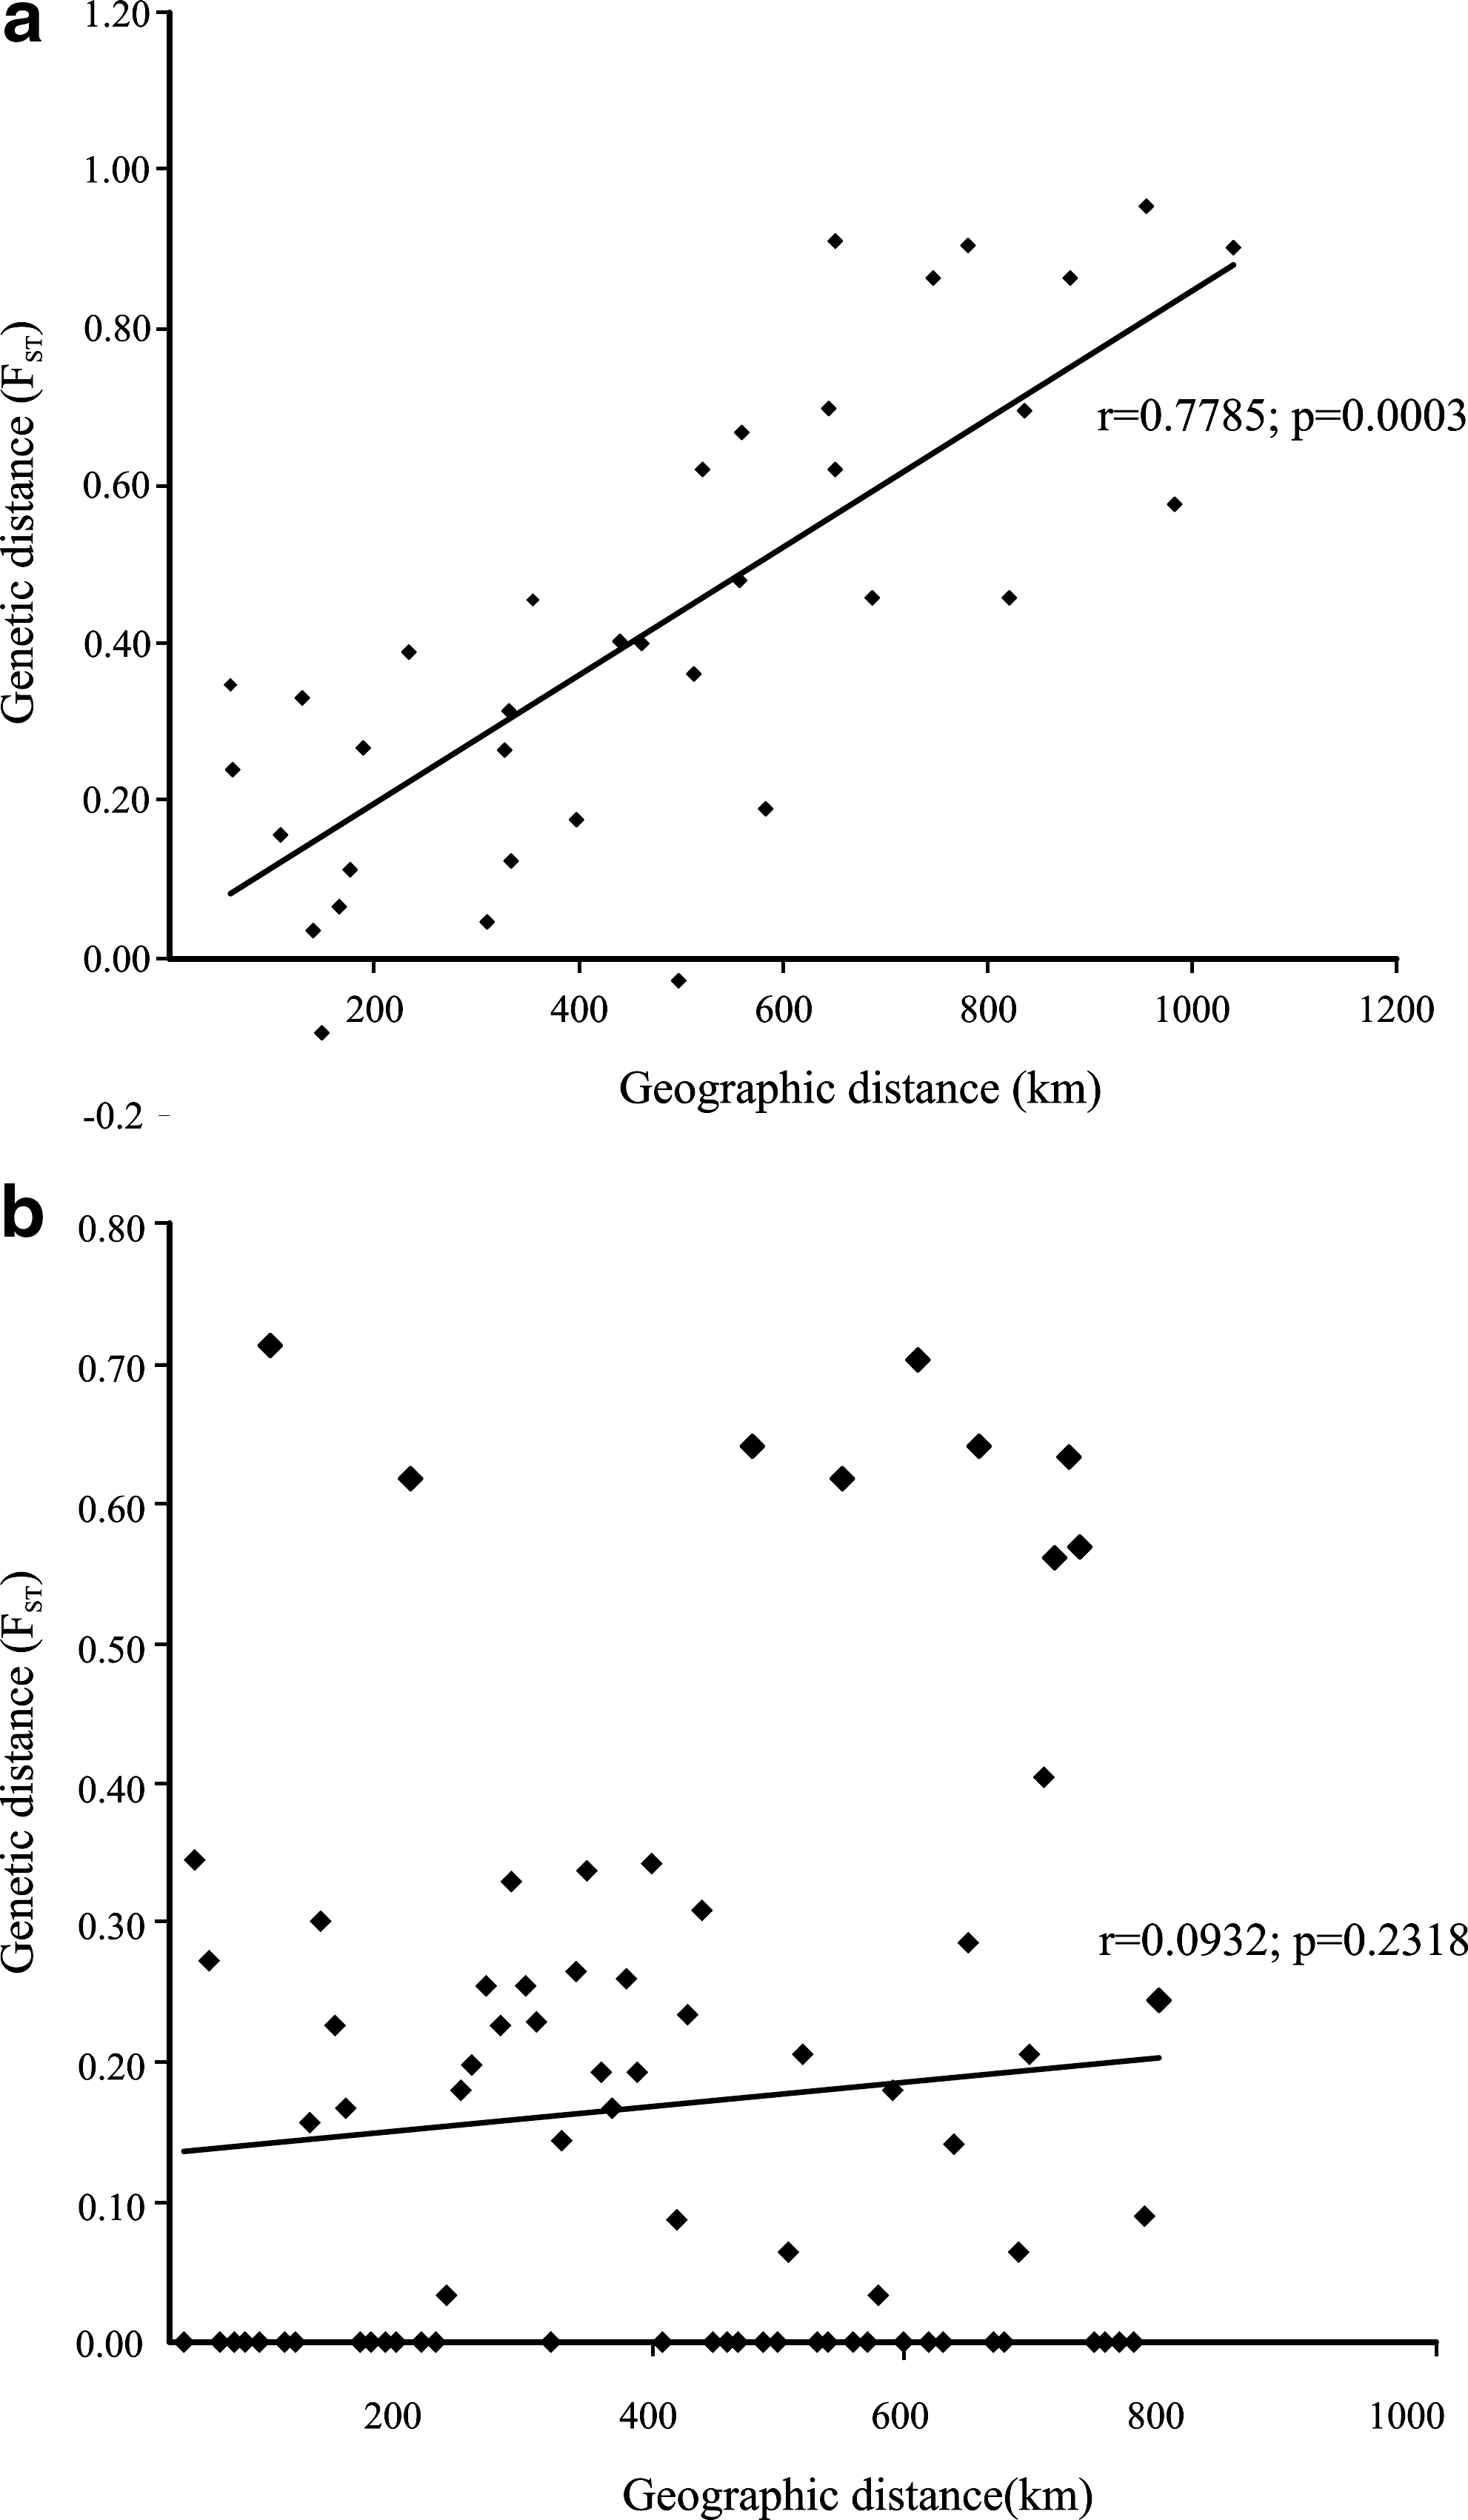
Correlation among geographic distances (km) and genetic distances (pairwise F
ST).
Discussion
Studies involving genetic analyses of populations of invasive species are challenging for several reasons. Species that have recently colonized new geographical regions as a result of human activity often present low levels of genetic diversity when analyzed at a regional scale. That is the case for mosquitoes adapted to breed in artificial containers that hold water; these species are responsible for most remarkable invasions and geographical range expansions (Philip Lounibos 2002).
In a present study we demonstrated that a 450-bp fragment of the mitochondrial gene ND5 could be used to estimate the genetic structure and to reconstruct the phylogeographic pattern of Ae. aegypti in Argentina. In a comparative study, Mousson et al. (2005) analyzed the variability levels of partial fragments of the mitochondrial genes COI, Cytb, and ND5, and also observed that the one corresponding to ND5 was the most informative for Ae. aegypti and the less variable for Ae. albopictus. A fragment of the ND5 gene was also successfully used in intra- and inter-specific population analyses in Anopheles gambiae and An. arabiensis (Besansky et al. 1997).
In our study, we detected 11 polymorphic sites that differentiated 14 haplotypes among the 197 sequences analyzed. The mean values of haplotype and nucleotide diversity found (H=0.720, π=0.00538) were similar to those obtained in other studies based on mtDNA of Ae. aegypti (da Costa-da-Silva et al. 2005, Scarpassa et al. 2008). In the analysis of individual populations, we detected relatively high values of haplotype and nucleotide diversity in localities from NWA and NEA. By contrast, in eight populations from the east, a unique haplotype (H1) was found. The remarkable differences in these indices strongly reveal a high heterogeneity in the distribution of genetic variability in the sampled localities.
The phylogeographic analysis showed that the 14 haplotypes nest in three different clades (Fig. 2). Haplotypes from NWA and Bolivia tended to be located at the extreme of the network and were clustered in the same clade (2-1), whereas those from NEA and Paraguay were clustered in an opposite extreme (clade 2-3). The distribution of these groups would correspond to category I described by Avise (2000), where the gene tree presents discontinuities among haplogroups that have allopatric distribution. This phylogeographic pattern might be due to a reduced historical genetic exchange between the haplogroups, which suggests that the geographical regions have different evolutionary histories.
Despite the recent re-invasion of the species to the country, NCA suggested past processes that influenced the present population structure. Clade 2-2 contains haplotypes 8, 9, and 1; the latter exhibits higher frequency in the east, although it is broadly distributed, without showing a defined geographical distribution. The NCA pattern inferred was a past fragmentation or extinction, followed by long-distance colonization. This result is in agreement with the high frequency and broad distribution of the most conspicuous haplotype in this group (H1) and suggests a very recent range expansion of that clade in a vast geographical region, haplotypes 8 and 9 being recent diversifications of haplotype 1. For clade 2-1 a past range expansion followed by fragmentation, or extinction in intermediate areas was inferred. This analysis would reflect the first invasion into Argentina and the effects of the subsequent control campaign, which would have attained local eradication only in some areas, allowing the persistence of relic populations.
The inference for the total cladogram was a past fragmentation, followed by range expansion. This result is in agreement with the genetic variability we found in our country, which is evidenced by the presence of high polymorphism in some regions that are fragmented and not very affected by genetic flow, and the extremely low haplotype diversity in others, with populations that are closely connected. The drastic drop in densities during the control campaign may have caused fragmentation and isolation, followed by a rapid re-invasion of the complete region starting from the surviving relicts. The Bayesian inference also identified three well-supported haplogroups.
To detect a possible hierarchical structuring in Ae. aegypti subpopulations from Argentina within the two major colonization routes formerly defined (Rondan Dueñas et al. 2009), an AMOVA was performed by clustering localities in four groups according to their haplotype composition and geographical location. This criterion added two groups of population to the division between East and West; those populations had a particular haplotype composition close to the frontier with Paraguay and Brazil on one side, and to the frontier with Bolivia, on the other. The high statistical significance obtained for the fixation indices in the AMOVA indicates the existence of genetic structuring in NEA, where populations appear to be less homogeneous in their haplotype composition than revealed by the previous study based on RFLPs (Rondan Dueñas et al. 2009). The existence of different evolutionary histories in Argentina is also evidenced in the results of the Mantel test, which showed significant correlation between genetic and geographical distances only when populations from NWA-Bolivia were analyzed. Such result is in agreement with the higher polymorphism observed in this region than in eastern populations (mostly represented by a unique haplotype), since only those populations that have been established in an area for a long period were able to actually reach the equilibrium between genetic drift and genetic flow.
In summary, different evolutionary histories of Ae. aegypti populations from Argentina emerged from the phylogeographic analysis presented in our study. The three main haplogroups identified would represent different colonization events, probably from neighboring countries: Bolivia, Paraguay, and Brazil. The high genetic variability in NWA and Bolivia, and in NEA and Paraguay, would correspond to independent introduced stocks that were fragmented in the past during the major control campaign and that were then rapidly restored from highly polymorphic relicts. On the other hand, the control campaign was probably most effective in the east, where the original variability was practically eradicated; the present occupation of Ae. aegypti in this region is represented by a unique genetic variant that showed a pattern of range expansion and colonized a vast region in a very short period.
After the important outbreak occurred during 2009, Dengue proved to be a re-emergent threat in Argentina, where the early loss of interest in vector surveillance and control allowed for the maintenance of a high genetic variability and important levels of present genetic exchange among several provinces. The success of any control campaign depends, at least partially, on the degree of knowledge about the demographic structure, including population sizes and the level of genetic exchange among subpopulations. Accordingly, indirect estimations based on the analysis of the geographical distribution of phylogenetically related haplotype groups allow us to identify different processes that determined such structuring.
Footnotes
Acknowledgments
We are indebted to Walter Almirón and Eduardo Lestani for providing some mosquito samples. We are also grateful to Juan José Martínez and María Carla De Aranzamendi for their valuable help with the analyses. This work was partially supported by the Agencia Nacional de Promoción Científica y Técnológica (FONCyT-PICT14530) and the Secretaría de Ciencia y Tecnología (SECyT)-Universidad Nacional de Córdoba, both from Argentina. G.A.L. is a post-doctoral fellow of CONICET. C.N.G. is a Career Investigator of CONICET.
Disclosure Statement
No competing financial interests exist.